

|
educational blogs |
|
THIS IS NOT A TIP OR RECOMMENDATION. I AM NOT A TIPSTER. PLEASE DO YOUR OWN RESEARCH. PLEASE READ THE DISCLAIMER ON THE HOME PAGE OF MY WEBSITE. IF YOU COPY MY TRADES, YOU WILL PROBABLY LOSE MONEY.
If you follow me on Tweets or have looked at the ‘Changes List’ on my Homepage, you might have seen that I bought a Long Spreadbet on FTSE100 at 6389 late on the Evening of Thursday 26th November 2015 (equivalent to about 20% of my existing Long Exposure via Stocks in my Trading ISA and Spreadbets) and I wanted to do a quick Blog to show my reasoning and to also do a quick glimpse at how the FTSE100 and S&P500 look for the coming Weeks and for December.
Fundamental Drivers
As ever with how I do stuff, there are a mix of Fundamental Reasons and Technical Reasons which have pushed me into the Decision to Buy the FTSE100. The Fundamental Reasons are as follows:
Technical Factors Probably the biggest development which forced my Buy Decision on the FTSE100 was the Breakout of a Downtrend Line from mid October as I will show below. As usual, all the Charts coming up next relate to the situation as it confronted me on Thursday Night just before my Decision to buy - so this is the information I was acting upon. The Chart below shows the FTSE100 Daily Candlesticks Chart for a big part of this year. The Blue Parallel Lines show an Uptrend which seems to be forming since the ‘Black China Monday’ August 24th lows. The Red Line (marked with the Red Arrow) shows a Downtrend Line that comes from back in June which was broken out of several times over the last 6 weeks or so but it couldn’t really make much upward progress and it meant that another Downtrend Line formed (the sort of Mauve one marked with the sort of Mauve Arrow), which was finally broken out of on Thursday (as marked with the Green Arrow). This Breakout was what really made my Buy Decision. Not only did it break the Mauve line, it also got above 6350 ish which had been Horizontal Resistance a few days ago. Note also how the 2 White Up Candles followed a lovely Hammer and this was a Reversal Point for the Price to change direction. 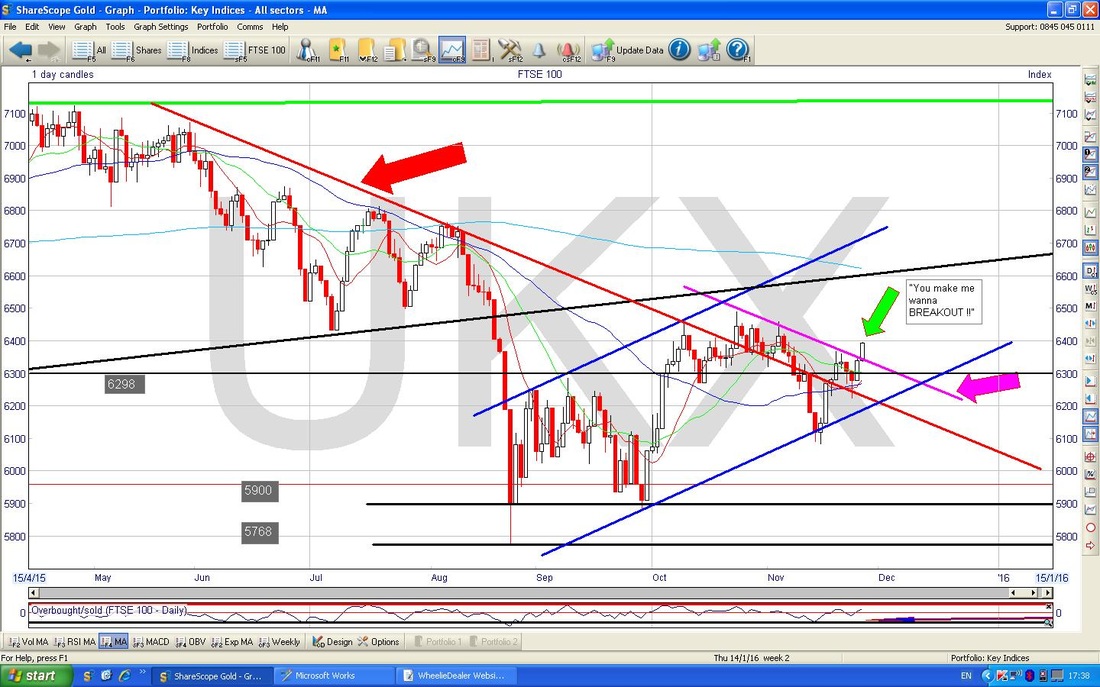
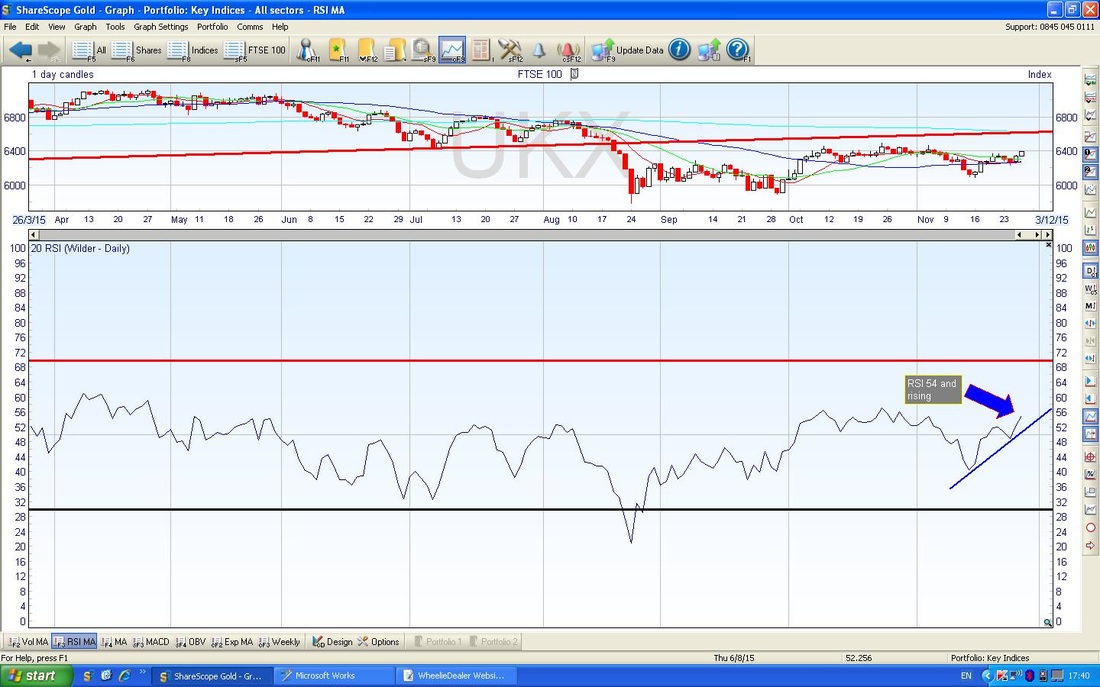
The Chart below shows the Relative Strength Index (RSI) in the bottom window. Please note that the RSI is rising and has passed through 50 (which is good) and with a reading of RSI 54 it has plenty of room to move up before it gets Overbought (usually around 65 to 70).
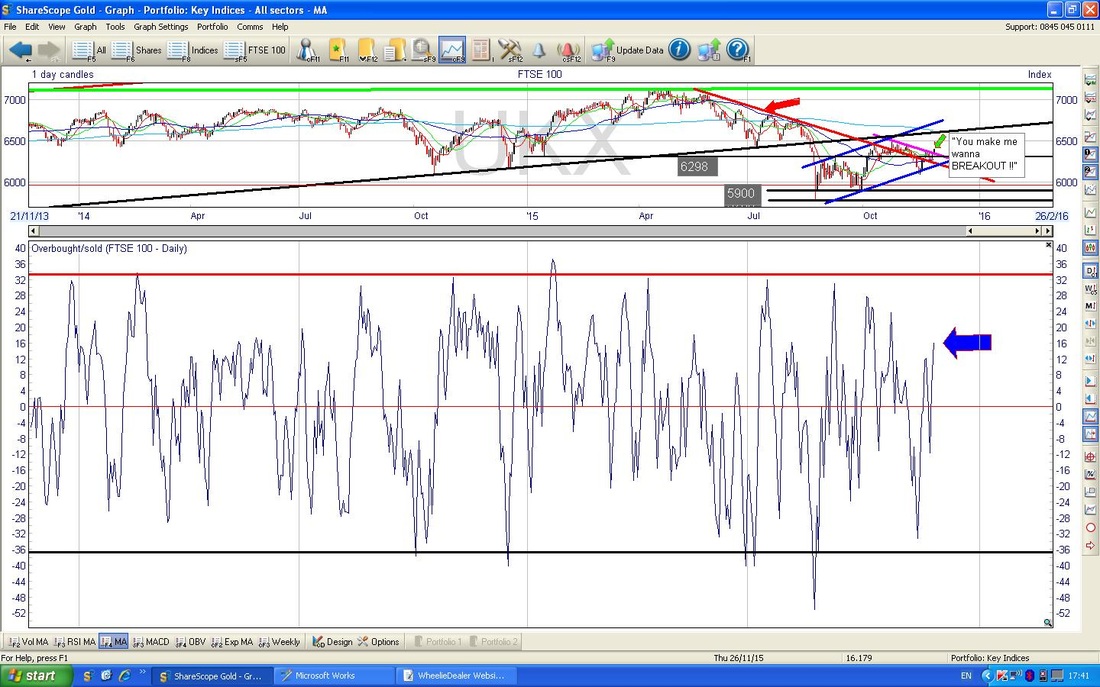
On the chart below, in the bottom window we have the ‘Overbought/Oversold’ Indicator - this is a very Short Term ‘Oscillator’ sort of thing and at the moment the Blue Arrow is pointing out that it has a little room to move up but not a huge amount. This suggests we might see some gains and then a pullback - but I don’t see this as much to be worried about - it is very much a Short Term Position Trader’s Tool.
In the Upper Window on the Chart Below, please see the Bollinger Bands. My Black Arrow shows that the Candle from Friday is in the upper third or so of the Range between the Bands so perhaps we will not get much more upside before a pullback. However, in Bullish times the Price can ‘hug’ the Upper Bollinger Band so it is again not overly worrying.
In the bottom Window, my Blue Arrow is marking where there was a Bullish MACD Cross (Moving Average Convergence Divergence) - I love this Indicator - it is really very reliable and obviously hints at more gains to come. 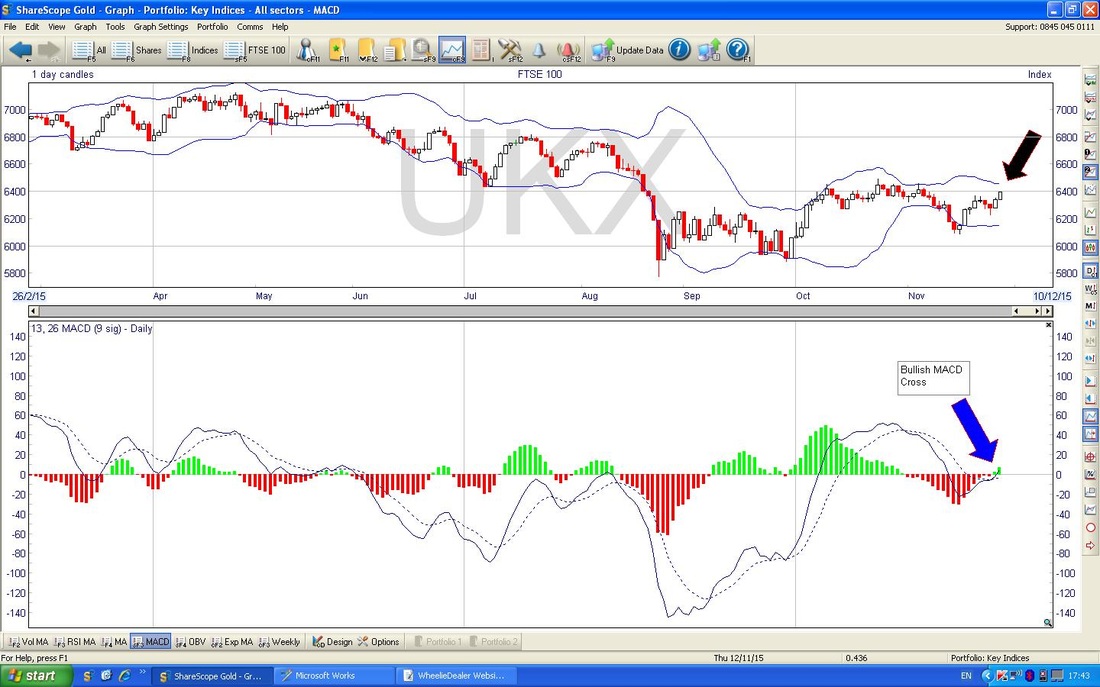
Right, how did things turn out on Friday after I bought the Long FTSE100 Spreadbet?
Right, now we move onto the situation after I updated ShareScope with Friday’s data. The Chart below has a Black Arrow which points to the Candle created on Friday. This is a Hammer and in this context it might mean a pullback but I doubt it will be much. If we had had a big run up over several Days and then we had a Hammer like this, that might mean a proper fall back - but in the context of just a couple of Up candles for the 2 days before, I doubt it will pullback much. There is good Support at 6350, 6275, 6220, etc. According to the UK Stockmarket Almanac, the coming Week (W/E 4th December 2015) is Positive for only 43% of Years historically and the Average Return is ZERO percent. In fact it is historically one of the 10 Worst Weeks of the Year. Looks dull then !! 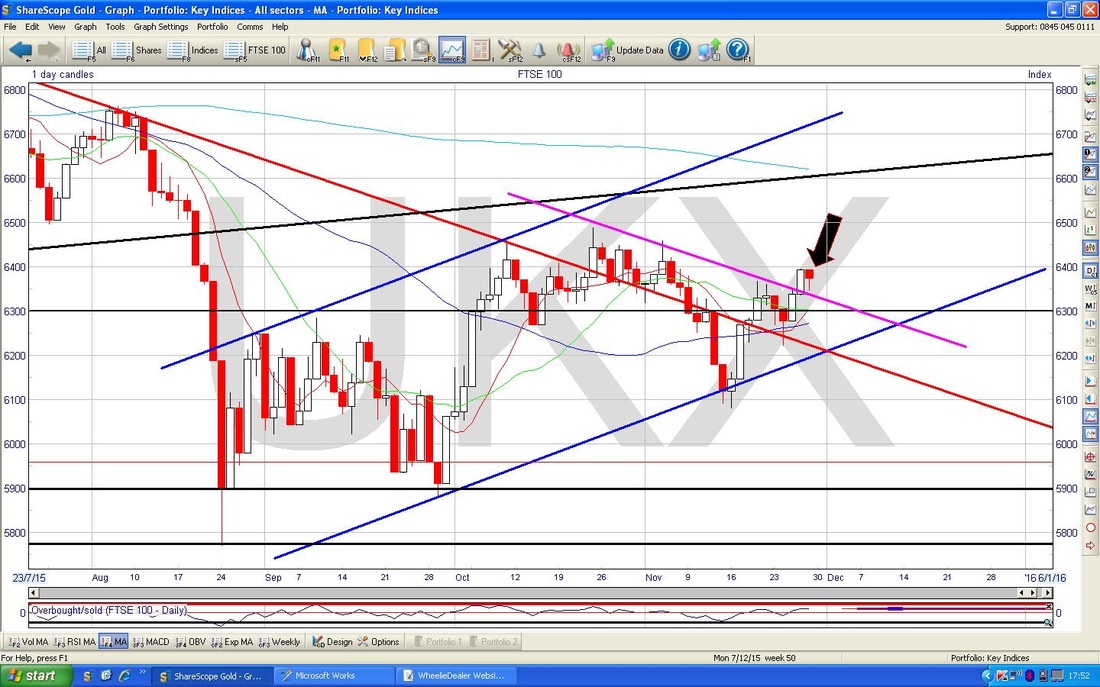
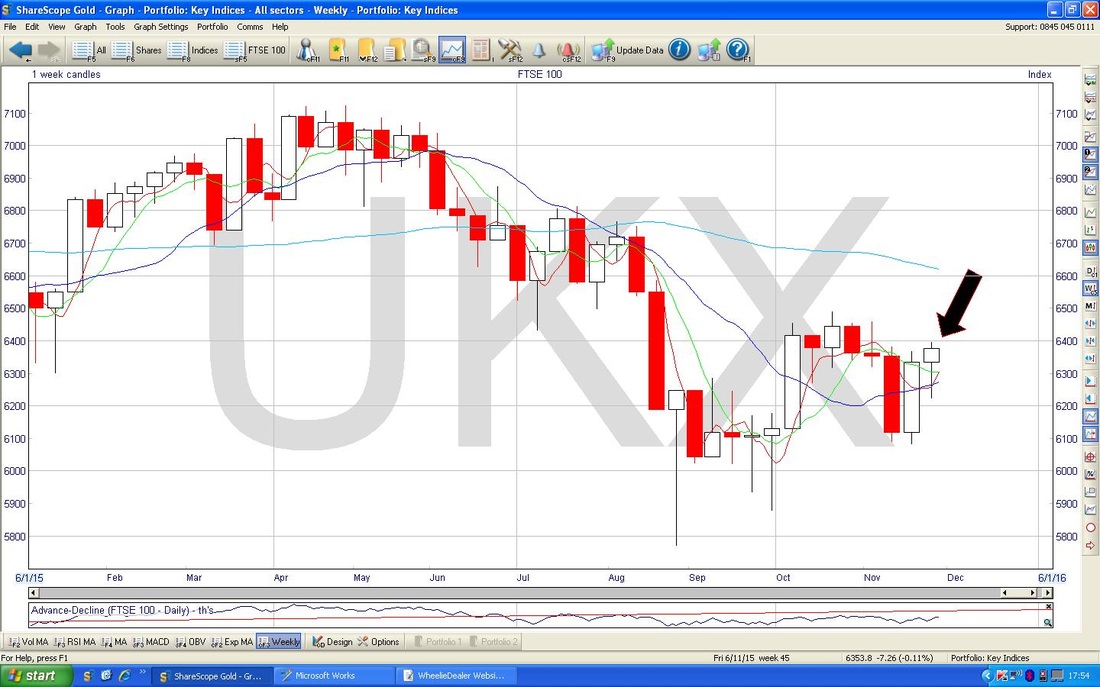
The Chart below shows the FTSE100 Weekly Candles. My Black Arrow is pointing to a Hammer which formed last week - like the one from Friday above, this could mean a Pullback is due but in the context of just one Up Candle before I would not expect much of a drop if any.
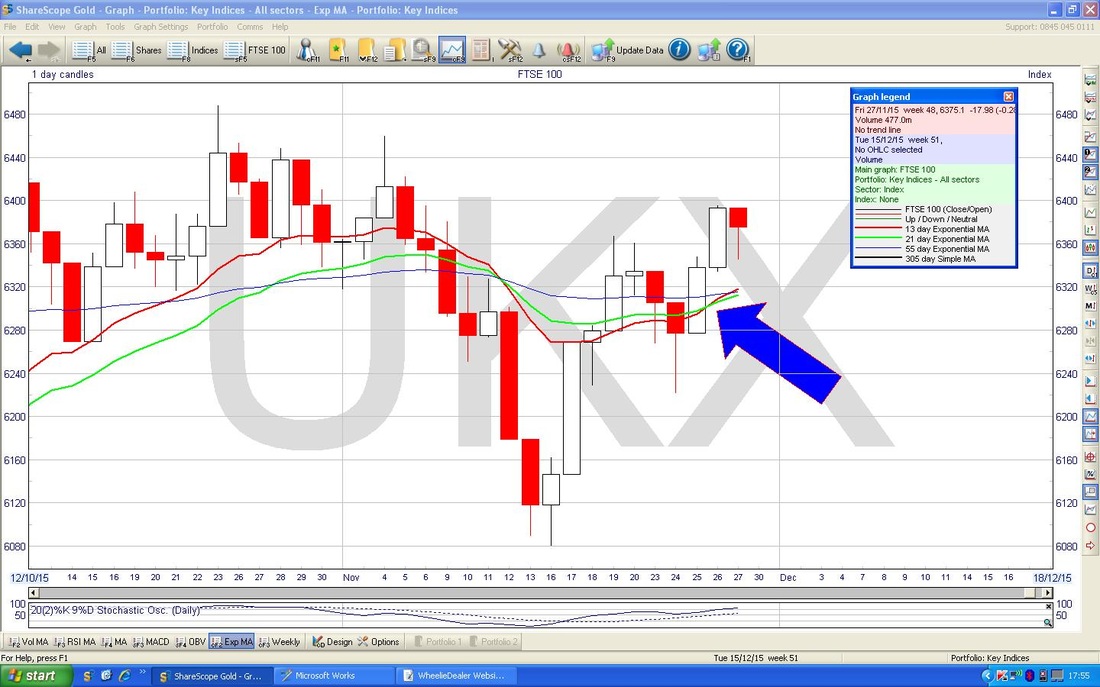
The Chart below shows the Daily Candles for the FTSE100 but with some Exponential Moving Averages (EMAs) drawn in on it. My Blue Arrow is pointing out how the Red 13 Day EMA has done a ‘Golden Cross’ moving up over the 21 day EMA from underneath. “Big Deal………” you might well say.
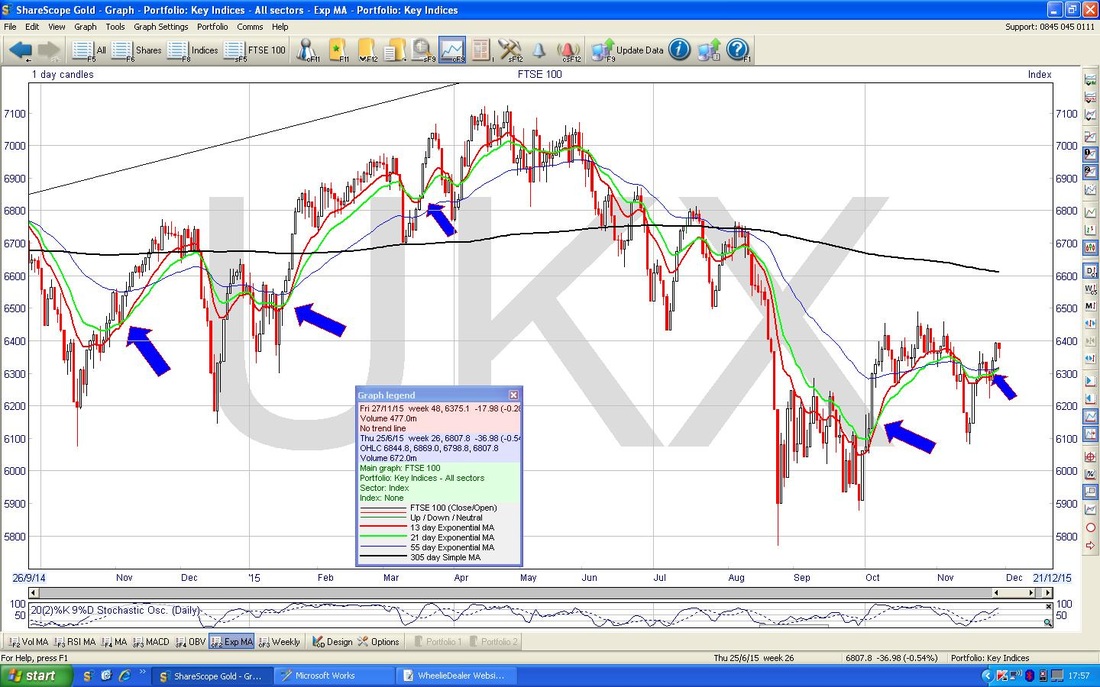
OK, on the Chart below I have panned out for a longer period and marked with Blue Arrows many times where this 13/21 Day EMA Golden Cross has happened before - you can draw your own conclusions.
S&P500
The US Markets have very strong power over the UK markets so let’s check this baby out. My Chart below shows the Daily Candlesticks for the last 6 months or so. I think there could be a ‘Flag Pattern’ forming here - my Blue Arrows point to 2 Candles which might be the Flagpoles and my Black Circle encompasses 5 days or so where the S&P500 has pretty much gone sideways. This could be the Flag. It is quite normal for Prices to move Up and then to consolidate Sideways for a while and then to move Up again - hopefully this is what we will see here !! Obviously there is Resistance just above which could prove problematic for a while - however, a Breakout above All Time Highs in a traditionally Bullish Month could really surprise people !! 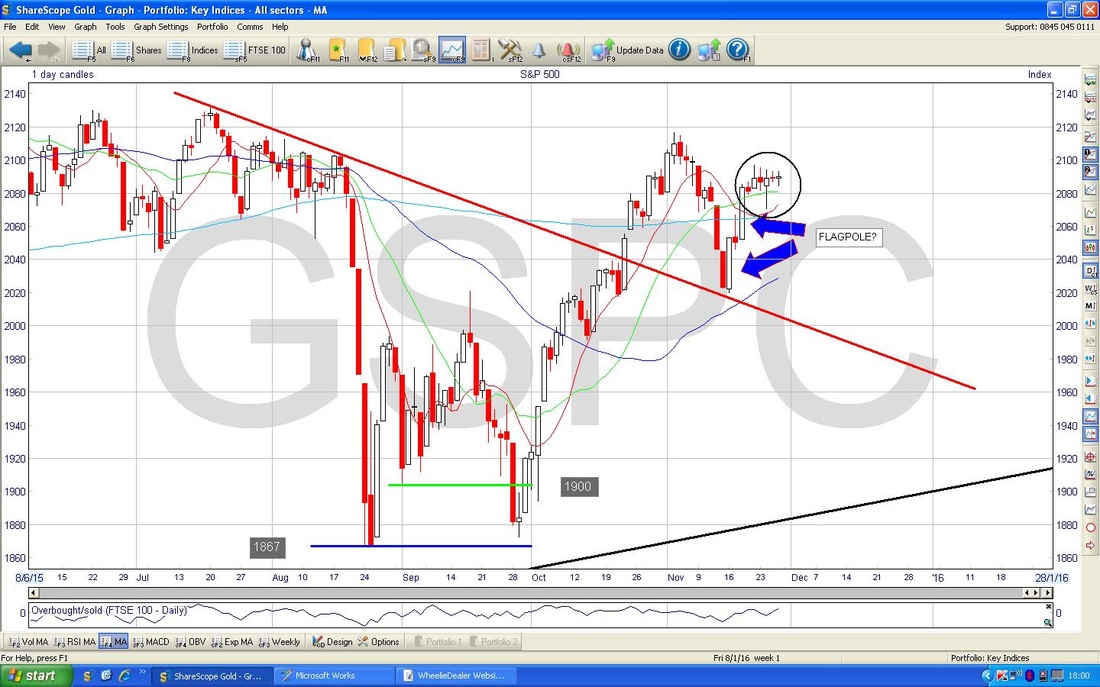
In the Upper Window of the Chart below we have the Bollie Bands - my Green Arrow shows that we are nowhere near either Band - I am not sure this tells us much really !!
In the bottom window, the MACD is on the verge of a Bullish MACD Cross - however, there is clearly a risk that it ‘glances off’ and instead the MACD goes Negative again (i.e. more Red Histograms underneath.) I would think the Bullish outcome is more likely. 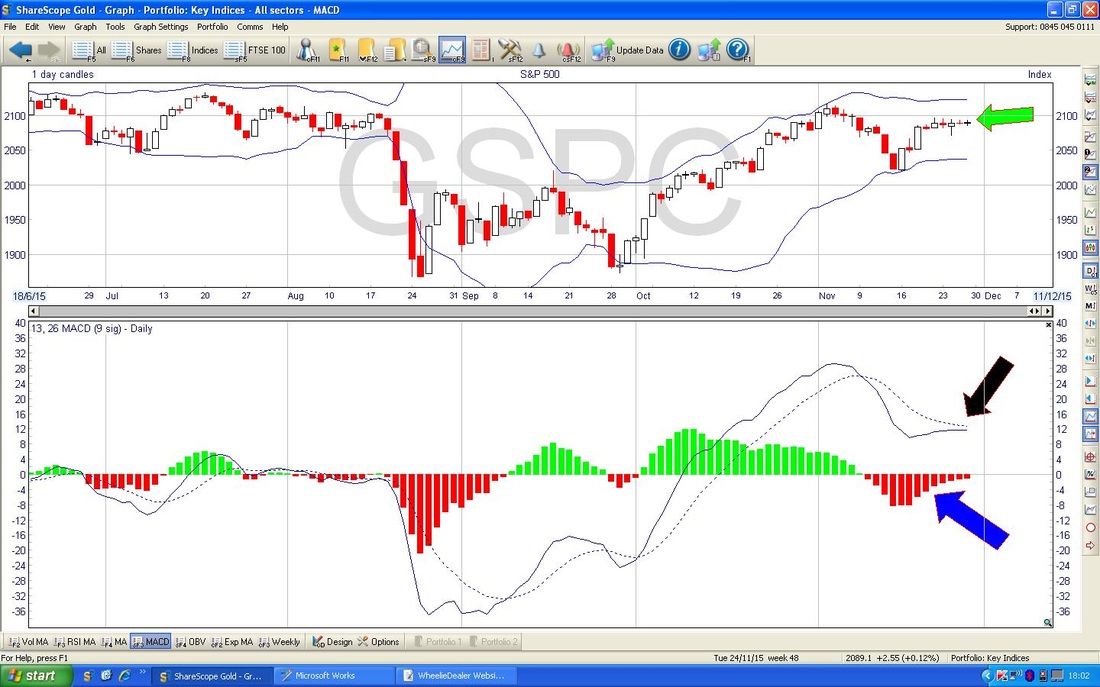
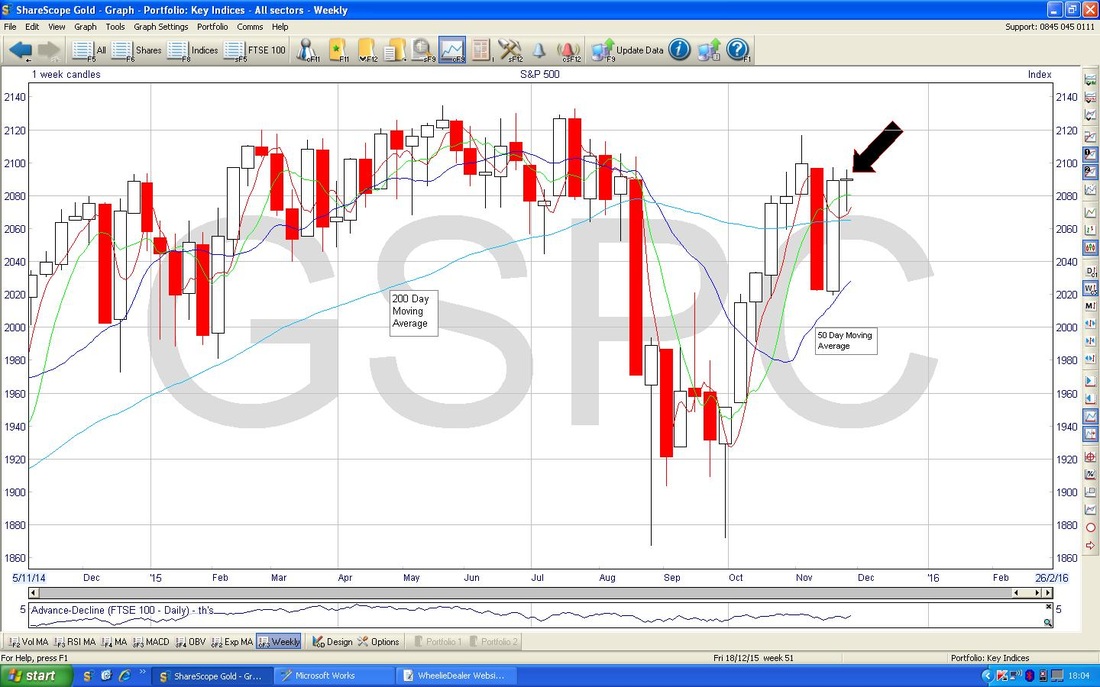
On the Chart below we have the Weekly Candles and my Black Arrow points to a Hammer which was formed last week. As with the other Charts, this is unclear and might lead to a pullback - but I doubt it would be much in the context of just one Up Week before.
On the Chart below for the S&P500, I have got the Daily Candles along with some Exponential Moving Averages. On this one, look at how the light Blue 55 Day EMA is just about to a ‘Golden Cross’ against the 305 Day Simple Moving Average. The relevance of this should become apparent on the next chart - but it is good.
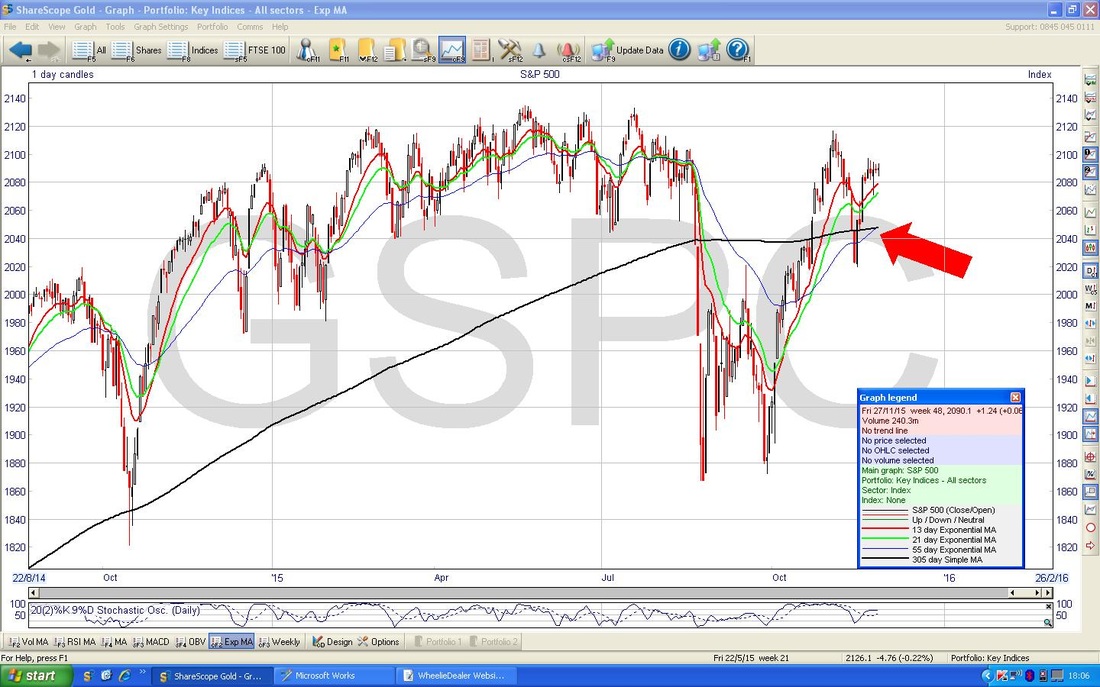
On the Chart below, I have expanded things out to about 6 years and if you look at the Green Arrows you will see where the 55 Day EMA did a Golden Cross against the 305 Day Simple Moving Average in recent years.
Interesting stuff ‘eh? Right, that’s snuff, hope you all have a great week, WD 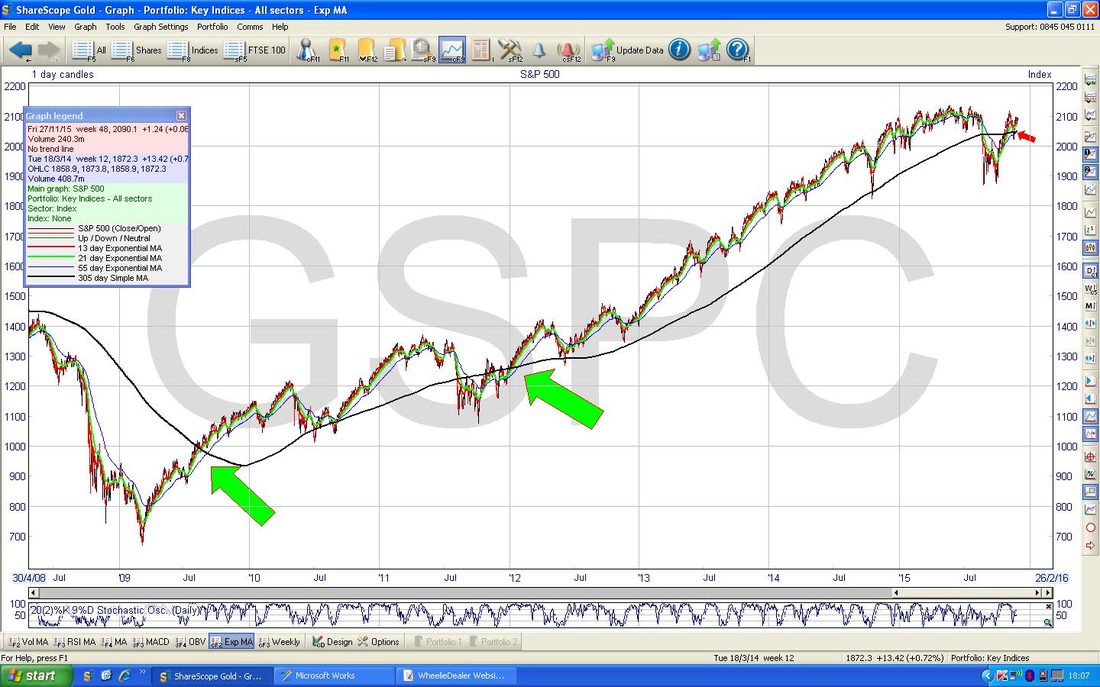
6 Comments
catflap
29/11/2015 11:20:13 pm
Great post. There is likely to be some volatile days with various key (again) central bank meetings this month . Just sayin'.
WheelieDealer
30/11/2015 11:53:16 pm
Hi catflap, Thanks for the feedback - I thought the Golden Crosses on the Moving Averages were the rather exciting bit. I agree with you, the Central Banks mucking about will cause some short term choppiness most likely - but I would bet on any Dips of a couple of days or so getting bought up. I note tonight (Monday 30th Nov) that the FTSE250 looks really bullish and so does the DAX. Cheers, WD
Jon H
14/12/2015 10:36:54 pm
Hi Pete - Love it when you go out on a limb with your predictions and all the reasons for it then the markets do the exact opposite. Makes you human like the rest of us. However if you are right 2 out of 3 times you will be a winner. Well done.
WheelieDealer
14/12/2015 11:44:50 pm
Hi Jon, I'm not sure I love it so much when the Markets do totally opposite to what I expect - ha ha. As ever, all this stuff is probabilities and it's vital to size positions well (i.e. keep them a sensible size in case they go against you) and be realistic that many Trades/Investments will go wrong, cheers WD.
Jon H
14/12/2015 10:39:01 pm
After the recent falls would you buy now given the opportunity and your belief that the market is generally healthy?
WheelieDealer
14/12/2015 11:47:18 pm
Hi again, yes, funnily enough I just placed another Buy Spreadbet on the FTSE100 at 5947 (14/12/2015) - US markets put in some nice Hammer Candles and so did Brent Oil and looks like we will get a bounce from a very oversold FTSE100. With luck I can escape from the screw up of my earlier FTSE100 Long Spreadbet which is deep underwater at the moment, cheers, WD Leave a Reply. |
'Educational' WheelieBlogsWelcome to my Educational Blog Page - I have another 'Stocks & Markets' Blog Page which you can access via a Button on the top of the Homepage. Archives
May 2024
Categories
All
Please see the Full Range of Book Ideas in Wheelie's Bookshop.
|
