|
Of course the big event at the moment is the Hurricane hitting Florida, Cuba and the Islands - we are so lucky here in the UK to really have very benign weather (and we have few Animals that will eat you or poison you !!).
Obviously once the Storms have passed there will be much rebuilding to do and life will be extremely tough for the People involved for a long time I would guess - especially on the Islands where there are very few inhabitants and the ability to rebuild (and the necessary dosh) will not be plentiful. In terms of Stocks these kinds of awful events rarely have a long-lasting effect although perhaps we will see a bit of a Sell-off early next week, especially in the US Markets, but I doubt it will be anything too dramatic. Of course Markets are often fragile at this time of year so perhaps these events could trigger further falls and that remains to be seen. For specific Stocks, there might be a few that benefit like AGK Aggreko (who do Power Generators) and those that might be involved in reconstruction like HILS Hill & Smith and perhaps ALU Alumasc - that sort of thing. On the flipside, SOM Somero Enterprises is based in Florida and although they are unlikely to be required for the laying of more huge Concrete Floors, it is possible that New Buildings get delayed as a result of the destruction. Insurance Companies could also suffer especially the Lloyds Syndicate ones but there are few of those left now on the Market.
Something I find incredible about these Storms is how Reporters are on the spot right in the thick of it - they must be nuts. On CNN (fake news !!) just now they were saying that People were out walking their Dogs in it and stuff - unbelievable. One can easily picture some poor little bedraggled Mutt flying through the air and probably its Owner flying along behind it dragged by the Lead !!
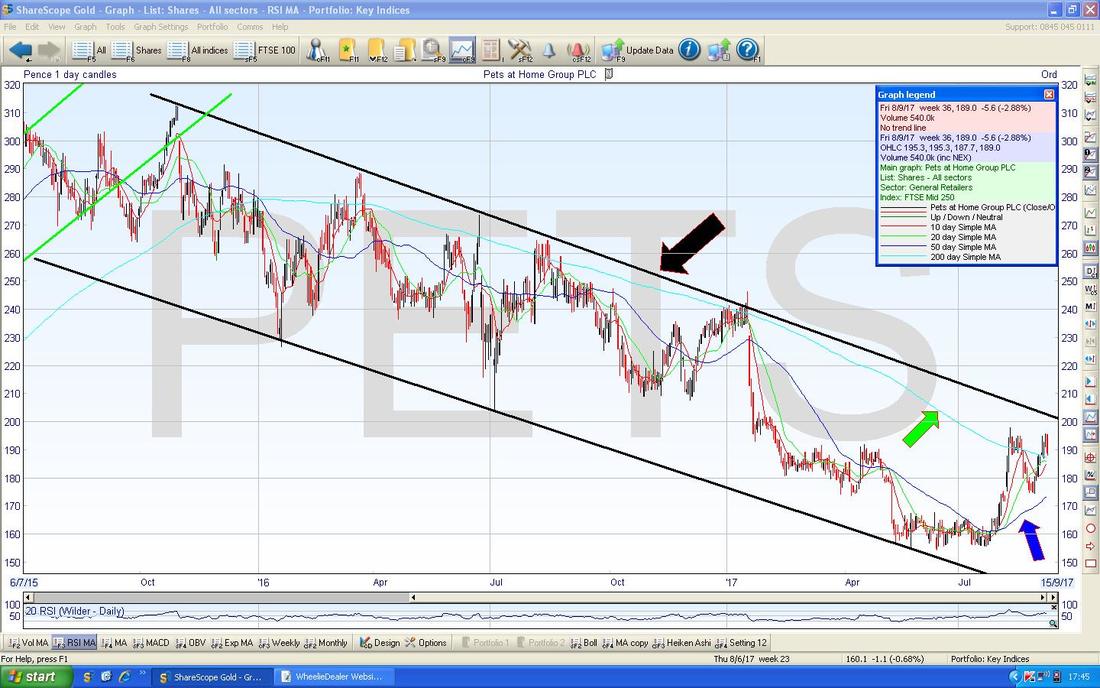
Last Week Things were a bit tepid last week, with Stocks not really moving much - my Portfolio was down a tiny bit, but nothing I can get concerned about and it is still just under 2% off the All Time Highs it hit recently - but I am still taking a very cautious stance and I want to lower my Leverage and increase Cash. It looks to me like the Paysafe PAYS takeover is now a ‘Done Deal’ and other Bids are very unlikely so I will probably Sell my Positions next week - this will free some Cash but even though I am after another Stock, I am unlikely to spend the Cash. I might top one up that I hold already but I don’t want to burn too much Cash - I doubt there is much need to rush - if we do get a proper Autumn Pullback then I will have the chance to buy some Stuff very cheap. If we don’t get a drop, then I am hugely Long the Markets anyway so it is not a big deal; I can feed Cash in during November or whatever once things seem more stable. I had Results from Molins MLIN, Avation AVAP, and Water Intelligence WATR last week and all of them were ‘ok’ but not something to blow anyone’s Socks off. I am not too surprised by AVAP and WATR, both of which will probably continue to crawl upwards over time, but I did expect more excitement out of MLIN - it is clearly extremely cheap with Cash being very near its Market Cap - I am sure this mismatch will correct over time - the Market rarely misses such mis-pricing for long. Simon Thompson in Investors Chronicle covers MLIN I think so he will no doubt be pointing this anomaly out soon. After the wonderful start to 2017 when Stocks just seemed to go up and up, we are most definitely in that grinding Late Summer/Autumn period where the only way a Stock can rise on Results day is if something really special is announced - if Results just meet expectations, then they either drop back or just go sideways at best. Conversely, if Results disappoint then Stocks get massively spanked - as we have seen recently with Provident Financial PFG (although arguably that one really deserved a big kick), Green King GNK and Fulham Shore FUL - the latter 2 showing that Restaurants/Consumer Discretionary are finding things tough - this could be partly due to over capacity in the ‘Eating Out’ Sector but also Consumers seem to be very wary with Political Uncertainty, Brexit, High Debt and Inflation from a relatively weak Pound (although that latter impact will fall out of the figures soon and the Pound is most definitely recovering). We also saw more evidence of the Consumer Slowdown with Safestyle SFE putting out a Warning and remember Dixons Carphone DC. also did one recently although I think that might be partly down to the lack of new exciting Smartfones to a large extent. Despite the challenges in the UK, the Global Picture still seems pretty good with the US chugging along nicely and Europe putting in the best Economic figures it has for ages - this could help the UK a lot if it continues. In terms of Economic stuff next week I think the only big event is the Bank of England Interest Rate Decision which is due on Thursday - although I suspect it will be a non-event and not much will happen. Perhaps if Mark Carney says something the Pound will wiggle around a bit and that could impact the FTSE100. In reality though, the Trend in the Pound is clearly up against the Dollar (although it has been weakening against the Euro) and this overall trend is unlikely to change. DIY Investor Magazine Interview If you have not seen it, last week an Interview I did with DIY Investor Mag was published which Readers might find worth a read - if you go to the Homepage and scroll down, there is a link to it. I also recorded a Podcast with Justin which you can find a link to on the Homepage also. I started work on a new Stock Blog last night and it will take quite a bit of work to finish it - so there might not be anything much coming out from me this week (apart from the odd Tweet or two I suspect !!) but I will issue that Blog as soon as I can - I am quite busy socially this week which gets in the way a bit !! Pets at Home PETS Sorry to bore you and labour the point on this one, but there is something I promised on the Podcast (or maybe it was via a Tweet), that I would show here. On the Chart below (as always, all Charts shown are from the Flushing Meadows Championship Winning ShareScope Software [that might not be all true] that I use), the key thing to notice is the Black Downtrend Channel Top Line which I have marked with the Black Arrow - the Price must breakout over this for real progress to be made - I think it will do it and we need to see the Price over about 210p really. Once it does this, assuming it does, then 240p looks quite a tough Resistance area to get through. In addition, we are getting near a Bullish ‘Golden Cross’ between the 50 Day Moving Average (my Blue Arrow) and the 200 Day Moving Average (my Green Arrow) - as I always say, if we get this Cross, then that is often a good predictor of more gains to come in subsequent months - this is what makes me say I think the Breakout of the Downtrend Channel will happen. PETS is on a Forward Divvy Yield of 4.2% and still looks good value - and it might be a lot more resilient than the usual Retail Stocks because people are unlikely to starve their beloved ‘companion’ animals and PETS are doing a very good job combating Internet Challengers and the Vets4Pets bit is doing really well and the expected Growth here in coming years is very strong.
Communisis CMS
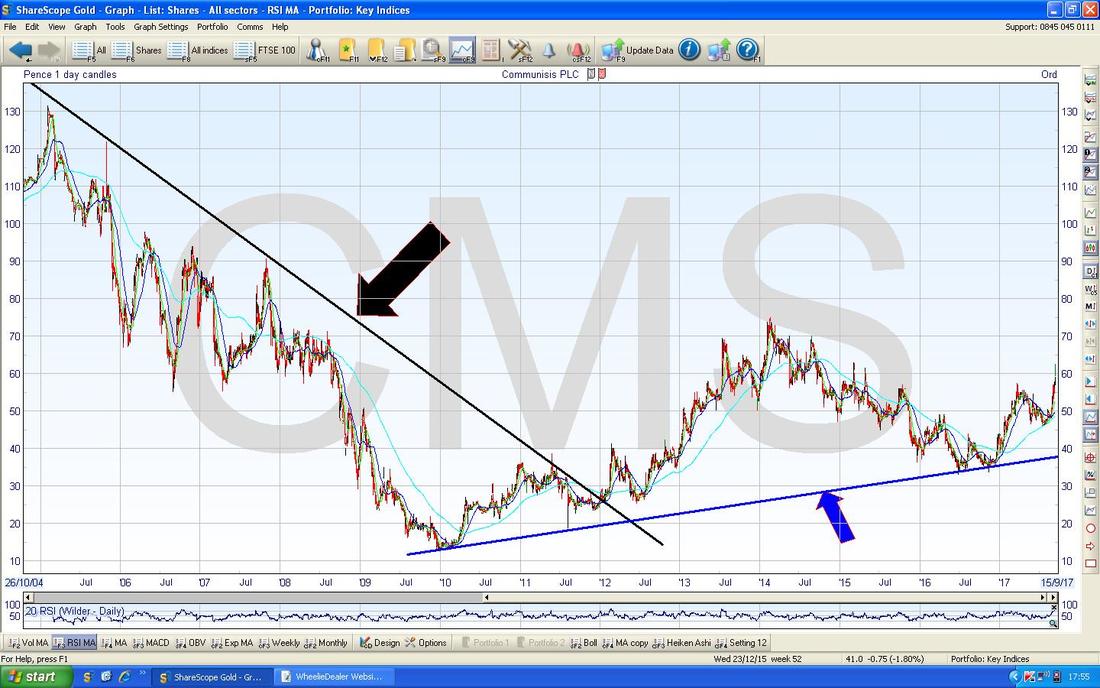
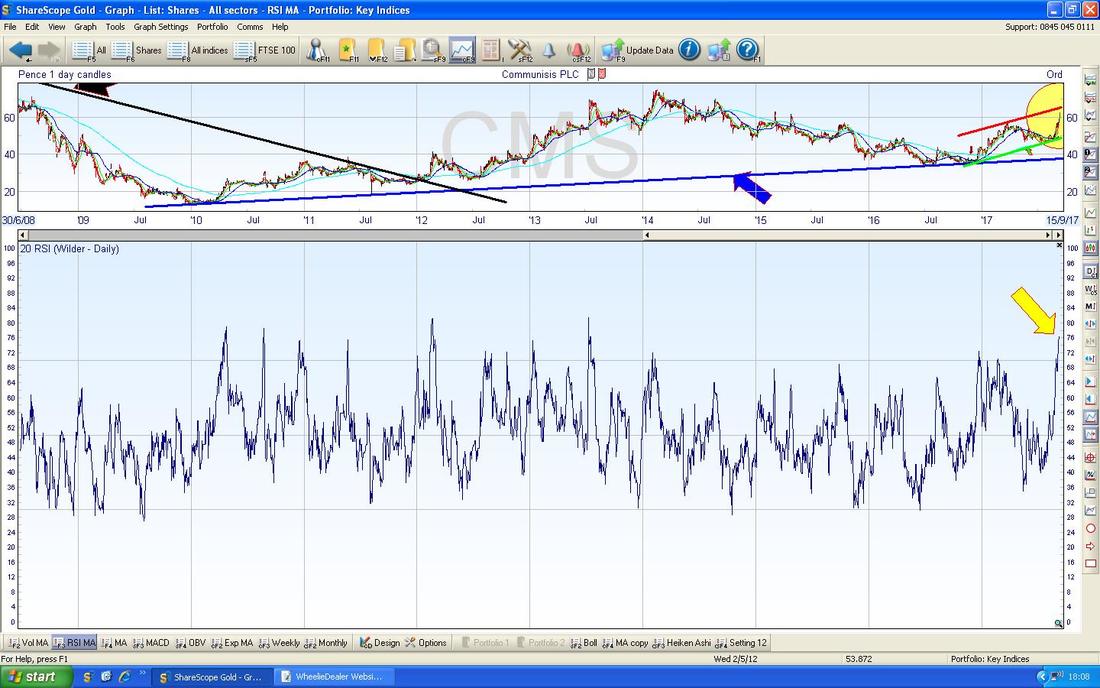
This is one that I really don’t know much about - I think it is involved in some sort of Marketing and has had recent troubles but perhaps it is on the mend - the Chart certainly suggests this is the case. It was tipped by Investors Chronicle this Week which was what made me notice it but as always when good things are tipped, it is often best to wait a bit and let any Short Term excitement die down, and then buy when the Chart tells you to. Starting with the ‘Big Picture’, as we always should when looking at the Charts on an Asset for the first time, the Chart below goes back many years and the key thing is the clear Downtrend which is marked by my Black Line and Black Arrow which actually originates from around 1999 in the DotCom Boom and dominated the Chart all those years up to nearly 2010 - just shows how a falling Stock can keep dropping. Anyway, after that the Price seems to have managed to get into a bit of a Shallow Uptrend which has a Bottom Support Line which is the Blue Line with the Blue Arrow.
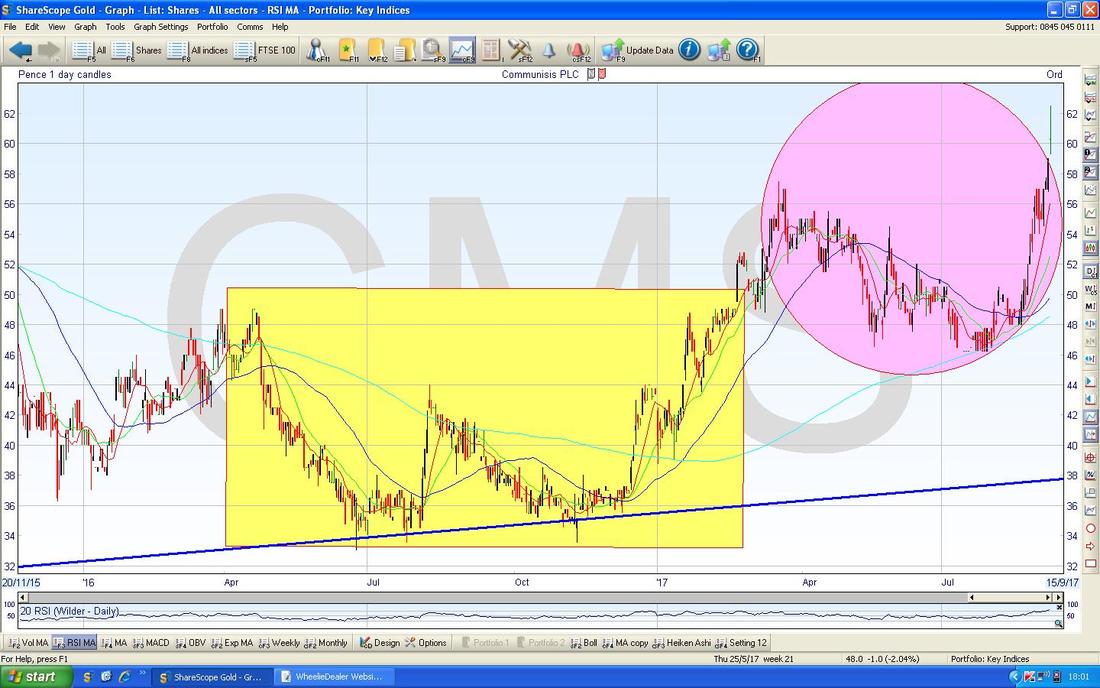
On the next Chart I have zoomed in and I am trying to show a possible Bullish ‘Cup & Handle’ formation - the Yellow Box captures the Cup bit and the Barbie Circle has the ‘Handle’.
You need a good imagination……..
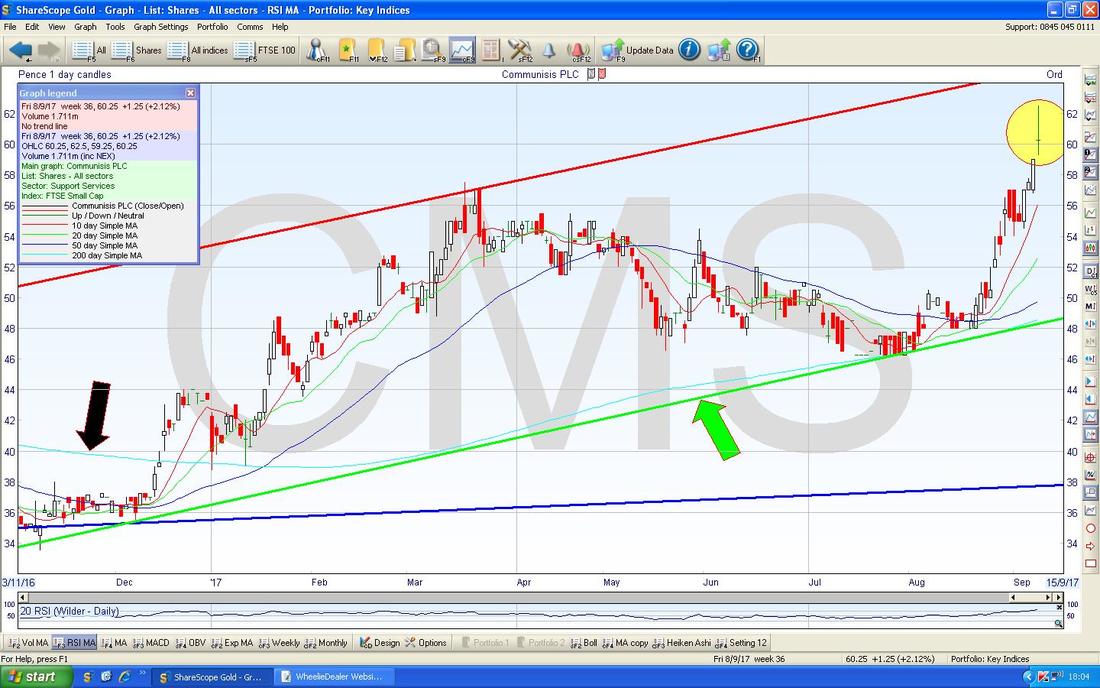
On the Screen below I have zoomed in a lot more and I have marked the Support Line of an Uptrend in Green (with Green Arrow) and note how this also seems to mostly coincide with the 200 Day Moving Average which is the Light Blue Wiggling Line which I have pointed at with the Black Arrow.
I have drawn the Red Line (no arrow !!) at the Top just as a parallel to the Green Line - this might be a good Resistance Line as the Top of an Uptrend Channel but it might not be !! My Yellow Circle is capturing what looks to me like a bit of a ‘Shooting Star’ Doji Candle from Friday 8th September which suggests that the sharp rise in the last few weeks might be waning - as always, the Price tops out just as Investors Chronicle tips it - this is not a criticism of IC, it is just how these things often play out and the time to buy is after things have calmed down.
The next Chart shows the RSI (Relative Strength Index) for CMS and this is best thought of as the ‘Force’ of a move or perhaps the ‘Speed’ of it. On a Reading of RSI 76 where my Yellow Arrow is, this is quite an elevated level for CMS and also ties up with the idea on the last Chart that the ‘Shooting Star’ was showing this has topped-out in the Short Term. However, smaller Stocks can be on very high RSI Readings for quite some time.
From a quick look at the Numbers, CMS is on a Forward P/E of 9.2 and a Forward Divvy Yield of a smidge under 4.5% - so it could be worth a good look - it seems to have some debt so that needs looking into and understanding.
Goodwin GDWN
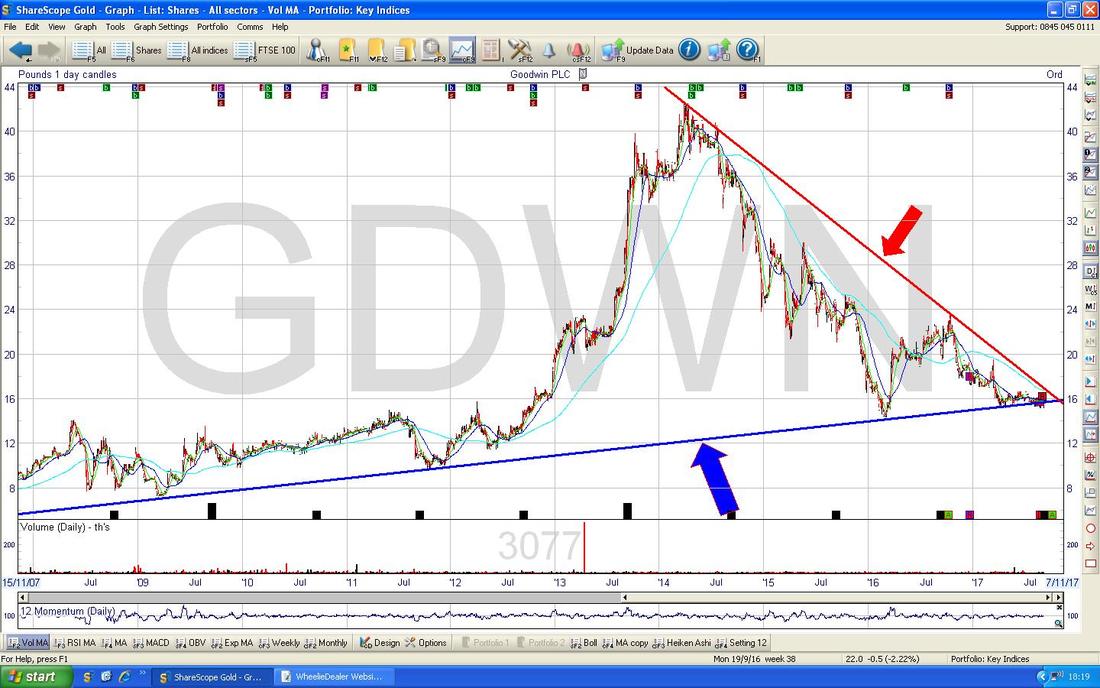
Mostly I can’t remember where, but I have seen some stuff written about GDWN recently and I think @RichardBeddard talked about it in an article on the www.iii.co.uk (Interactive Investor) website. Anyway, I thought I would check out the Chart and see how it looks. On the Big Pic Chart below, first off we have what looks like a good Long Term Support Line drawn in Blue with the Blue Arrow - and clearly the Price is down near that at the moment. Then we have a fairly well established Downtrend Line shown in Red with the Red Arrow - this is still a problem for the Price to breakout over.
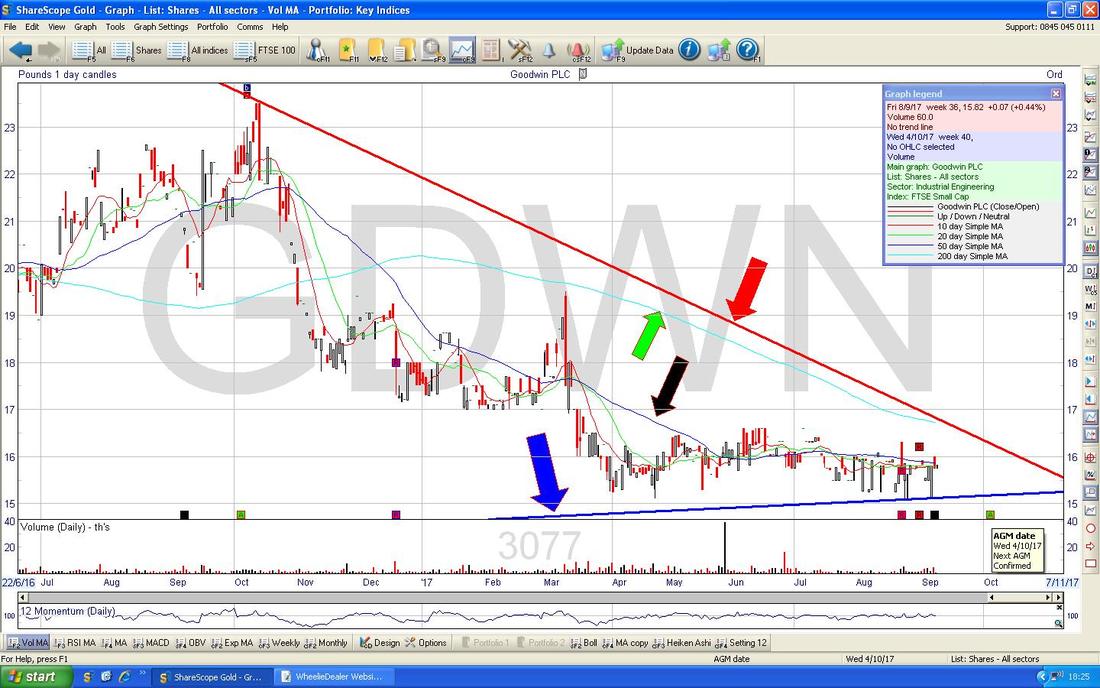
I have zoomed in on the Chart below and it is not particularly great for Bulls yet - as before, the key thing now is for the Price to Breakout over that Red Downtrend Line (marked with the Red Arrow) - to do this it needs to get over 1700p really. It is vital that the Blue Support Line (Blue Arrow) holds to the Downside - if the Price falls below 1500p that could be really bad news.
Something a bit more exciting for the Bulls is that the Blue Wobbly Line 50 Day Moving Average (marked by my Black Arrow) is moving up towards the Light Blue Meandering Line 200 Day Moving Average - maybe it will do a Golden Cross in coming Weeks. Note there is an AGM due (you should be able to see the Text Box in the Bottom Right Hand Corner) on Wednesday 4th October - maybe they will put out a Statement which triggers some action. I don’t know much about GDWN although I think it is a family run business and does Engineering stuff - but has suffered due to Oil & Gas Sector exposure I think. Check out Richard’s iii article if you want to find out more.
DOW - Dow Jones Industrials Index (US)
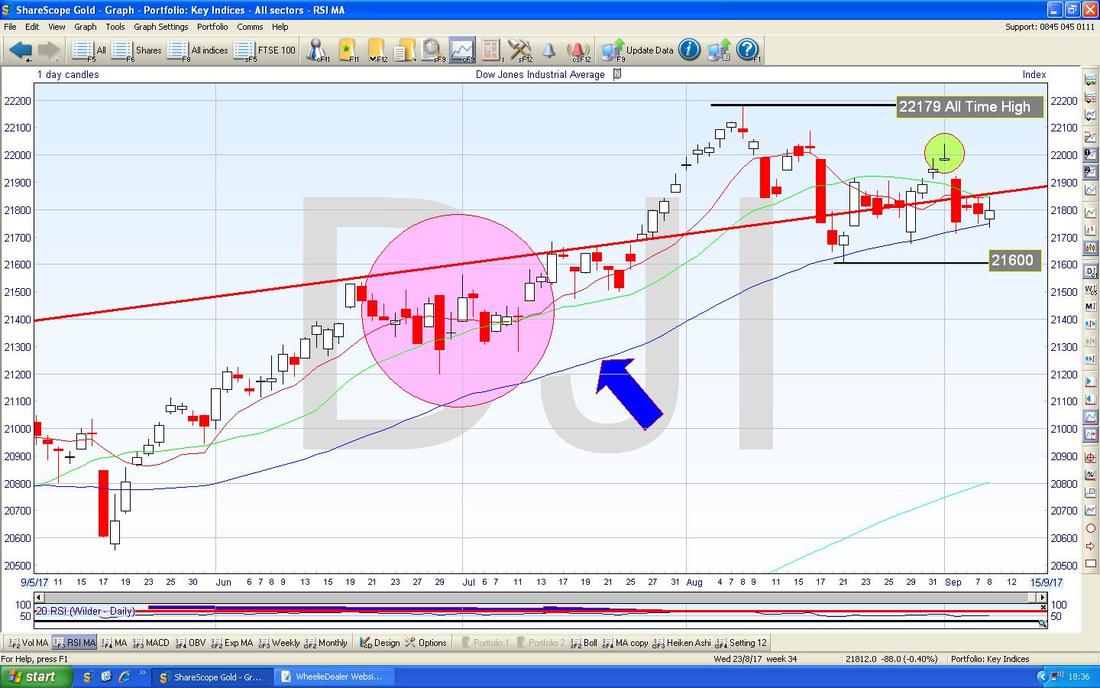
This is a weird Index because it only has 30 Stocks but it is probably the most widely looked at so it is always worth keeping an eye on. The main thing here is that we are still very near to the All Time High at 22179 and the 50 Day Moving Average (pointed at with my Blue Arrow) has been acting as good Support for a while and we are pretty much touching that again. If the Storms cause some worry, then maybe the DOW will fall below the 50 Day MA but if that happens then there is good Support at 21600 just below and then where my Pink Circle is there is an area of Support down to around 21200. The most Bearish thing about this Chart is that the Inverted Hammer in my Green Circle didn’t manage to get up to the All Time Highs - this shows a bit of weakness.
Nasdaq Composite (US Tech)
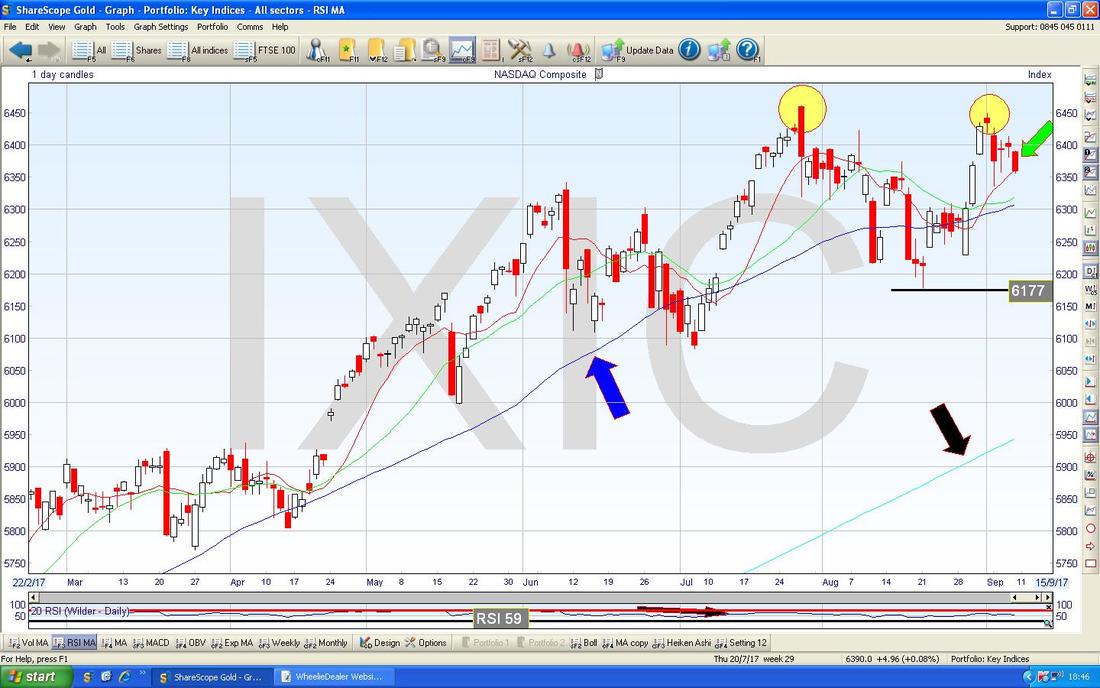
First thing to notice here is that we are up near the All Time Highs, but where my Yellow Circles are we might have just put in a Bearish ‘Double Top’ pattern - something to watch. My Green Arrow is pointing at a Big Red Down Candle from Friday 8th September which suggests more falls but there is good Support below from the Blue Wavy 50 Day MA (pointed at with my Blue Arrow) at around 6300 and then there is more Support down at 6200 and 6177 in particular. If these fail and things really kick off to the downside (quite possible in Autumn) then we should get good Support from the 200 Day MA (marked by my Black Arrow down around 6000. The S&P500 is very similar to the Nasdaq Comp.
FTSE100
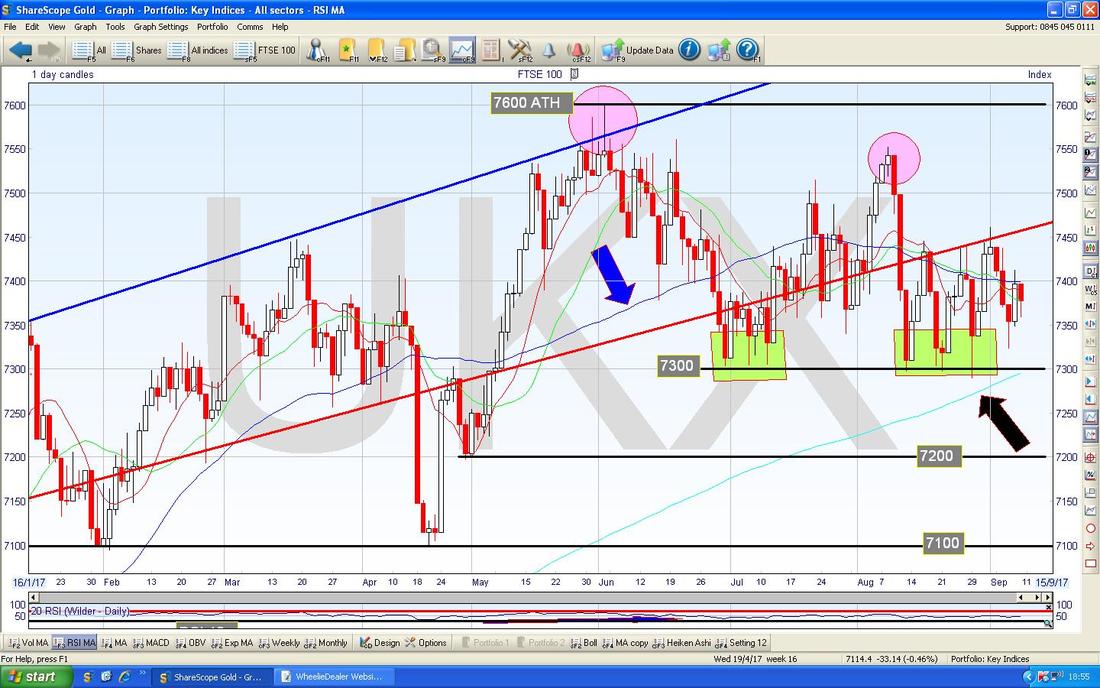
Not much has changed here since last week. The story is still really that we are stuck in a tight Sideways Range between about 7300 at the bottom and 7450 at the top - but tight Ranges like this don’t tend to last long and I expect soon we will see a Break to the Upside or Downside - being September, I won’t be surprised if it breaks down. My 2 Pink Circles are highlighting a possible Bearish ‘Double Top’ pattern. My Blue Arrow is pointing to the Blue Wavy 50 Day MA Line and note how it is starting to drop towards the Lighter Blue 200 Day MA Line (marked with my Black Arrow) - this hints at a Bearish ‘Death Cross’ and if it happens it might mean some proper falls to come. To cheer Bulls up, there is a lot of good Support on this Chart - from 7300 to 7200 to 7100 to 7000 to 6900 etc. - so chances are that any Drops will be bought before long.
Pound vs. Dollar
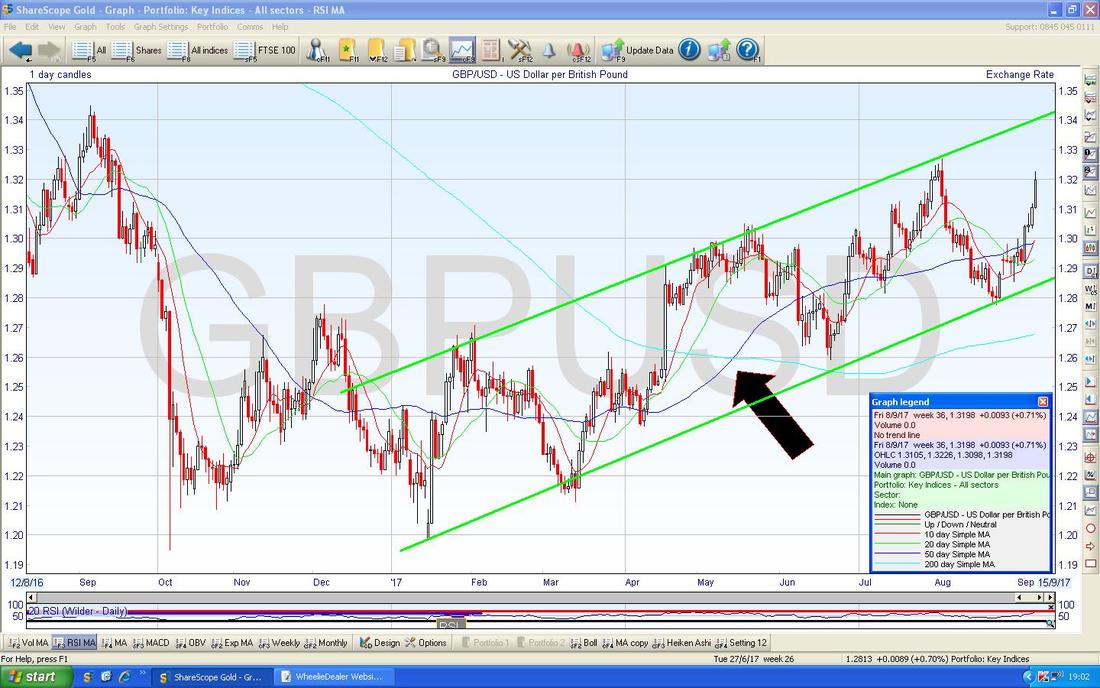
This is the most important Currency Pair for people in the UK and particularly for its impact on the FTSE100 mainly because Commodities (think Oil) are priced in US Dollars and a falling Pound against the Dollar is inflationary. Conversely, when the Pound rises against the Dollar, this reduces the effects of Inflation - and this is what is happening now as I said in the opening text to this Blog. I have mentioned this on Twitter a few times but I wanted to show it very clearly on a Chart - the point is that since the Brexit Vote shock when the Pound collapsed, it has been steadily recovering in a very well defined Uptrend Channel as shown below with my Green Parallel Lines. Note, the key event here was when we got a Bullish Golden Cross between the 50 day and 200 Day Moving Averages which I have pointed to with my Black Arrow. There is a fair bit of Resistance up above at around 1.36 which might present a challenge, then 1.40 to 1.48 is quite a zone of Resistance. Further strength in the Pound looks most likely and this could be a negative for the FTSE100. In many ways this is a story of Dollar Weakness rather than Pound Strength (you can see this because the Euro is rising against the Dollar as well) - which also helps explain why the Metals have been so strong recently (they like a weak Dollar).
Brent Oil (Spot)
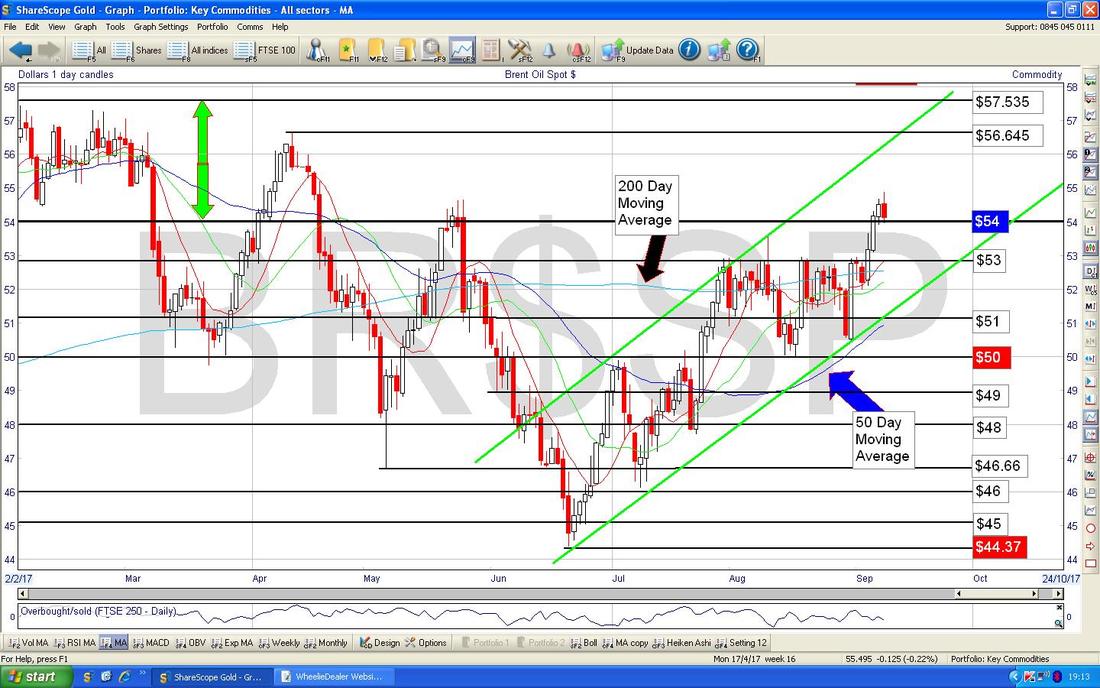
This is quite interesting simply because after recent falls down to $44 ish, Brent Oil (Spot) has recovered very well and is now challenging Resistance up at $55 - it looks pretty Bullish really. On the Chart below I have drawn in 2 Parallel (ish) Green Lines which might be marking an Uptrend Channel - something to watch. My Green Arrows are showing a Range between $54 and nearly $58 which will probably be quite difficult Resistance to wade through. The other important thing to watch out for is a possible Bullish Golden Cross between the 50 and 200 Day MAs - this looks very likely. Strength in Oil might help the FTSE100 and the DOW because they both hold the Oil Majors in heavy Weightings.
Gold (Spot)
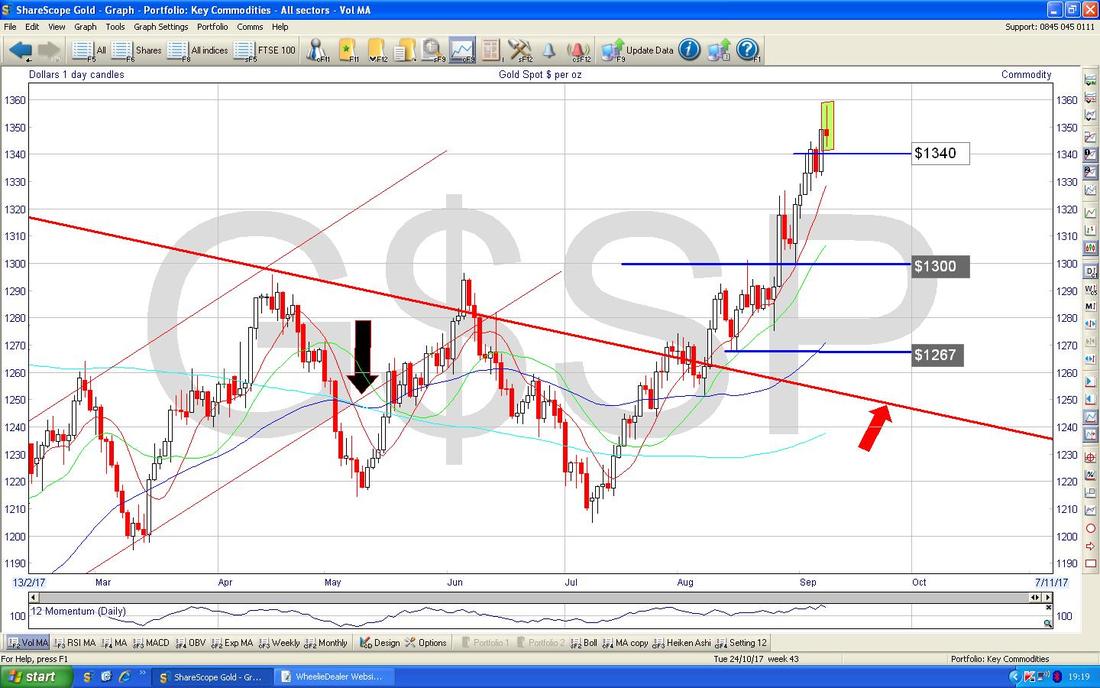
Gold moved up strongly in recent weeks after finally breaking-out of that Long Term Downtrend Line (the Red Line with the Red Arrow below) but maybe in the very Short Term it has topped out. I say this because on Friday we got a bit of a ‘Shooting Star’ type Doji Candle and this hints at a pullback - but if it does drop, it might find support very soon and it is quite natural and healthy for such easing back after strong moves up. $1300 is now an important Support level and if that was to fail, then maybe the whole recent Bull Story is coming to a very quick end - I doubt that will happen.
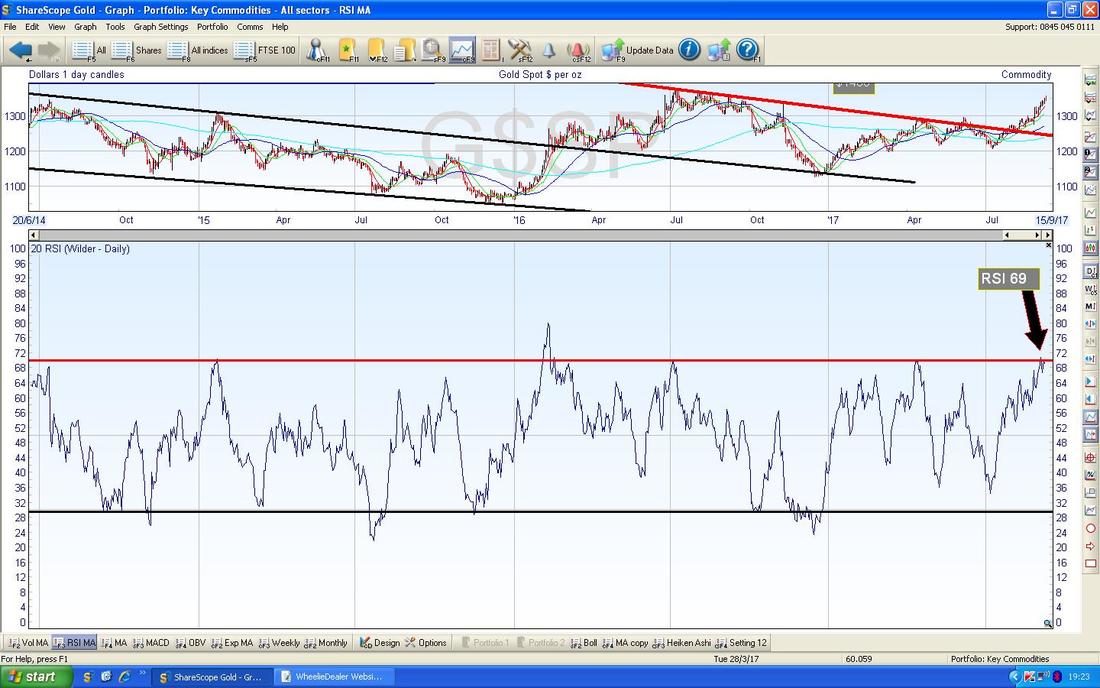
On a Reading of RSI 69 Gold Spot is getting quite Toppy - it can go higher, but combined with that Shooting Star, I would not be surprised if it dropped back a bit now.
That’s it for this week - I hope everyone prospers in the week ahead or at least avoids any proper trouble !! Cheers, WD.
0 Comments
Leave a Reply. |
'Educational' WheelieBlogsWelcome to my Educational Blog Page - I have another 'Stocks & Markets' Blog Page which you can access via a Button on the top of the Homepage. Archives
May 2024
Categories
All
Please see the Full Range of Book Ideas in Wheelie's Bookshop.
|


