|
I am out all day tomorrow and will probably get home late so I won’t have time to look at the Charts - so I am going for the Saturday Night Chart Fever instead. Time is tight so I will go straight into things - although a couple of factors to watch are the rising Bond Yields on Sovereign Debt and everyone seems to think the Quid will fall more which is probably the best indication you will get that it is going to rise !!
Historical Backdrop
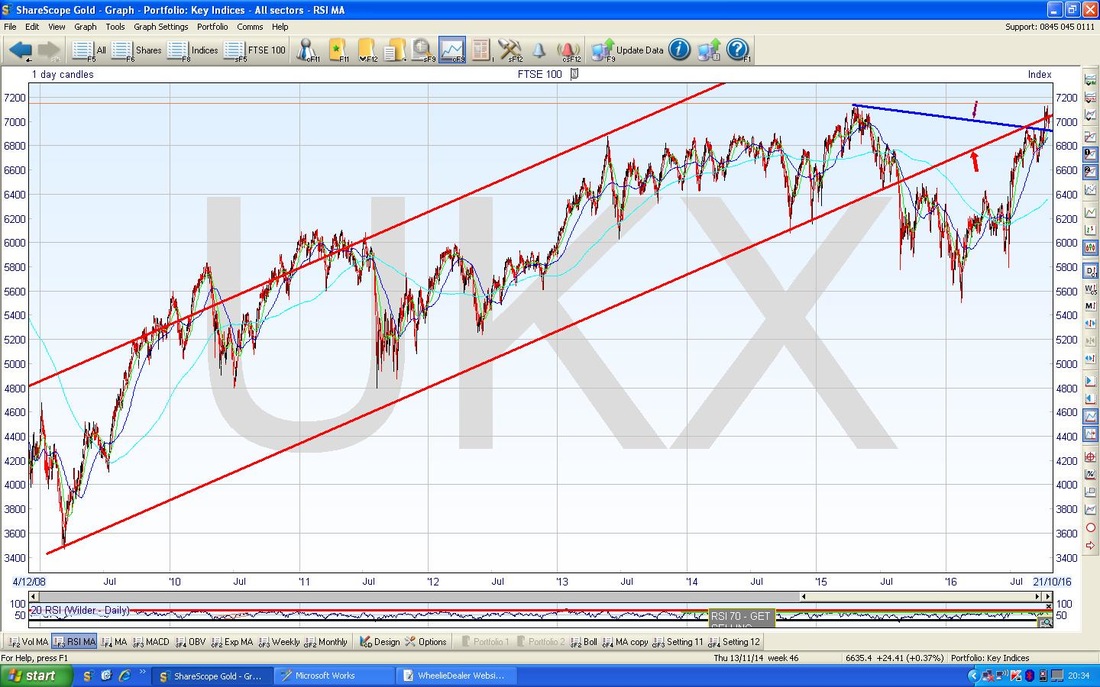
According to the UK Stockmarket Almanac 2016, for the coming Week (w/c 17th October 2016), the FTSE100 is UP for 61% of Years but with an Average Return of MINUS 0.2% - so a mixed picture again. Wednesday might be amusing as we have the Fed Beige Book being published apparently and I think Apple AAPL has results that day as well - probably after the Bell. AAPL has a huge weighting in the Nasdaq (7% or so from memory) so it might affect that Index. The Almanac says that a typical October rises for the first 2 weeks and then falls back before rising again right at the end of the month - so this coming week might be soggy. FTSE100 As usual, here is a reminder of the 6 Year Uptrend Channel marked by my Red Parallel Lines.
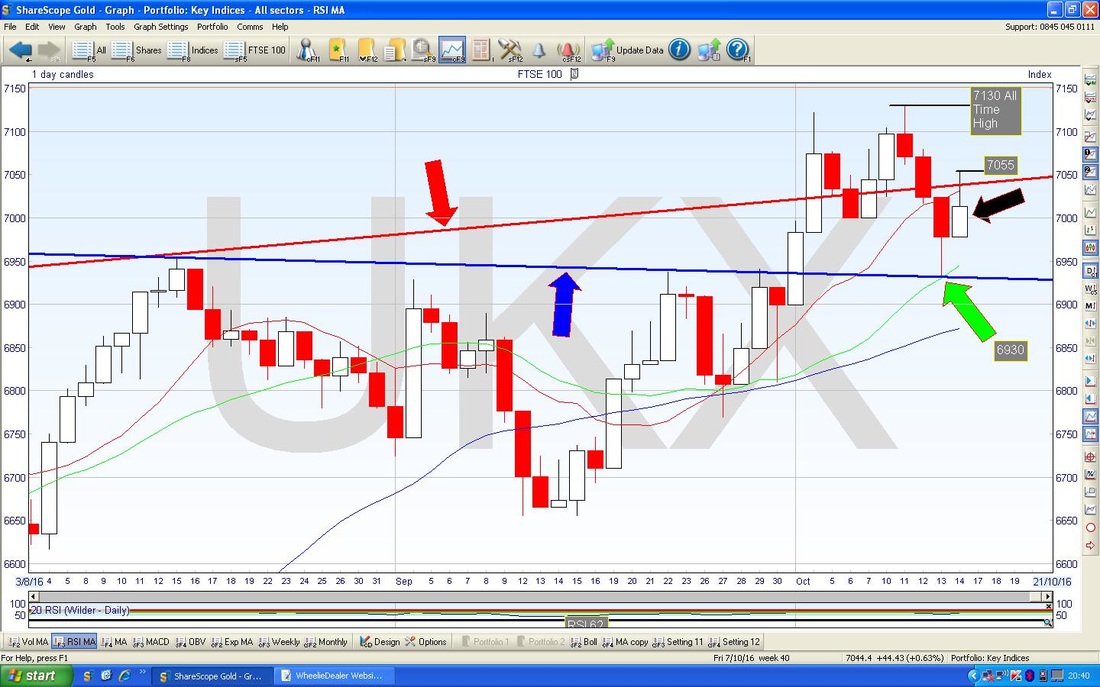
There are some great Technical things going on in the Chart below. Again it has the Daily Candles and I have zoomed in on the Chart I showed above to just the last 3 months ish. First thing to note is how the Price from yesterday (Friday 14th October) ended up Closing below the Red Bottom Uptrend Channel Line from 6 years ago - this is an important Line that was broken as Resistance in the last couple of Weeks but the Price has failed to stay above this Line and it is now again acting as Resistance.
Note how yesterday’s Candle (the Black Arrow is pointing at it) went up above the Red Line Intraday but it then pulled back to end up below. Resistance at 7055 is now important in the very Short Term and the FTSE100 needs to get over this level and then take on the All Time High up at 7130. It is not great that the Price fell back Intraday yesterday but it is arguable that yesterday’s Candle combined with the Candle from Thursday (my Green Arrow is pointing at this one) could be forming a Bullish Harami (there it is - the Preggers Lady which I know regular Readers love so much !!) - apart from the failure to stay up Intraday yesterday, the other difficulty here with the Bullish Harami theory is that the context is not great - these Haramis work best after a sustained move down where the RSI and stuff get low as well - this is not the case here. There is something very pleasing here in Technical Terms for Charting Purists - if you look at where my Green Arrow is pointing, you can see how the Price Intraday on Thursday moved down and ‘kissed’ the Blue Line - this is lovely because the Blue Line was formerly a Resistance Line and it is classic Charting Theory that ‘Former Resistance becomes Support’ (and vice versa) and clearly this has happened in this case. On the immediate Downside, the bottom of Thursday’s Candle at 6930 is critical Support which must hold. As we will see further on, both Oil and the Quid might not be supportive of a rising FTSE100.
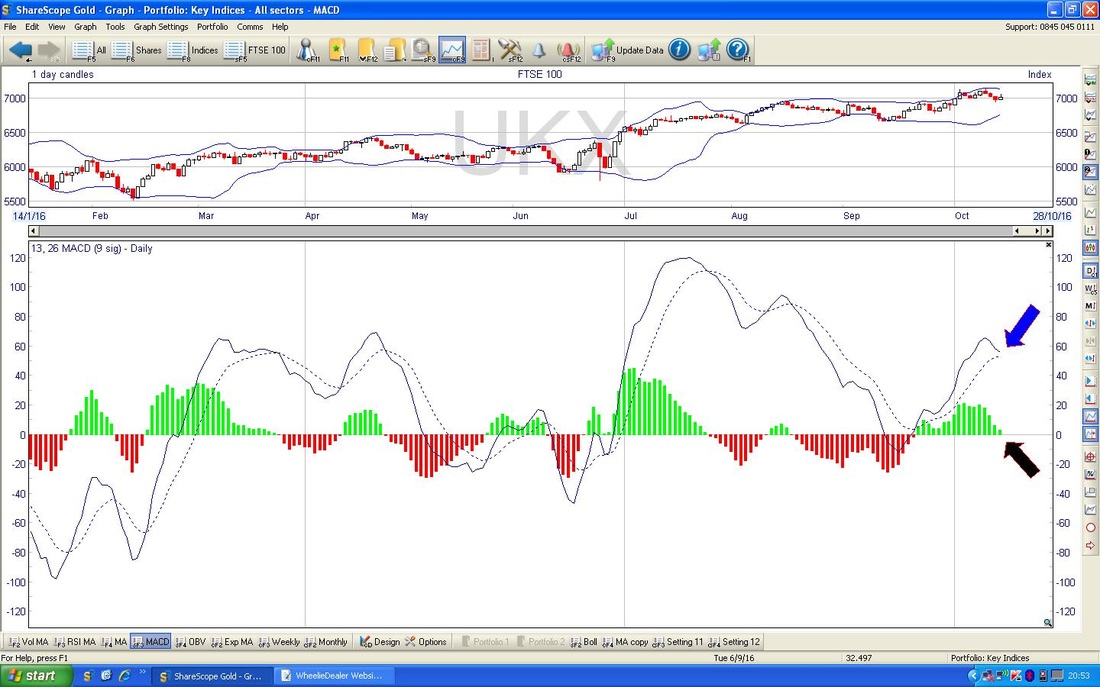
In the bottom window on the Chart below we have the MACD for the FTSE100. My Blue Arrow and my Black Arrow are showing different representations of the same thing - namely that we are on the verge of a Bearish MACD Cross - it is possible that we will ‘Skim off’ but it is something to watch for.
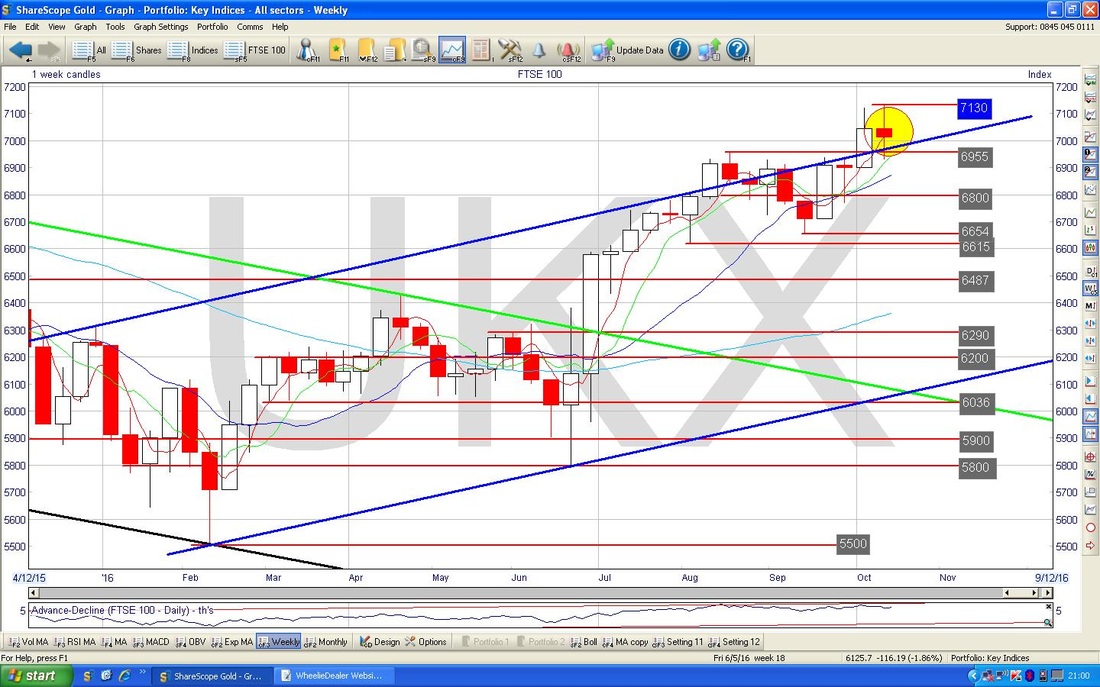
The Chart below has the Weekly Candles for the FTSE100. In the context of the recent Rally, the Doji Candle produced last week (captured in the Yellow Circle) could be marking a Reversal (in other words, the FTSE100 may drop) or it might be saying that a Reversal will happen soon if not immediately. Note how the Price is up slightly above the Blue Lines Uptrend Channel - it is possible that there is a small ‘Overshoot’ here and it will fall back inside that Channel.
The only trigger for Bullishness on this Chart would be a decisive and powerful move over 7130 - it is notable that recent moves over previous All Time Highs (like at 7122) have been really pathetic and suggest a lack of commitment on the Bull side.
FTSE250
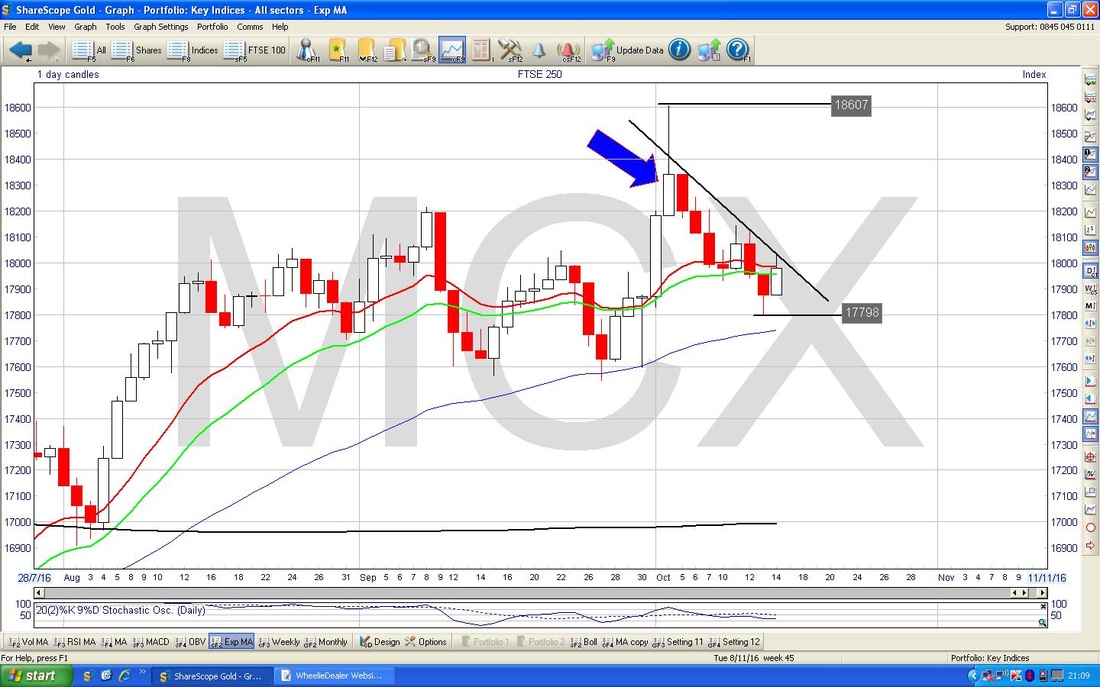
I might have mentioned last Week in a ‘Technical View’ update and maybe on a Tweet that the FTSE250 was being Dominated by an Inverted Hammer - if you look at the Chart below and see my Blue Arrow, this is pointing to the Inverted Hammer which was bashed out on Tuesday 4th October and the Price Action has all been happening below it ever since. For things to get really Bullish here again the Intraday High here at 18607 needs to be taken out. 17798 is now very important Support in the immediate term - if this fails, then expect more downside.
DAX (German)
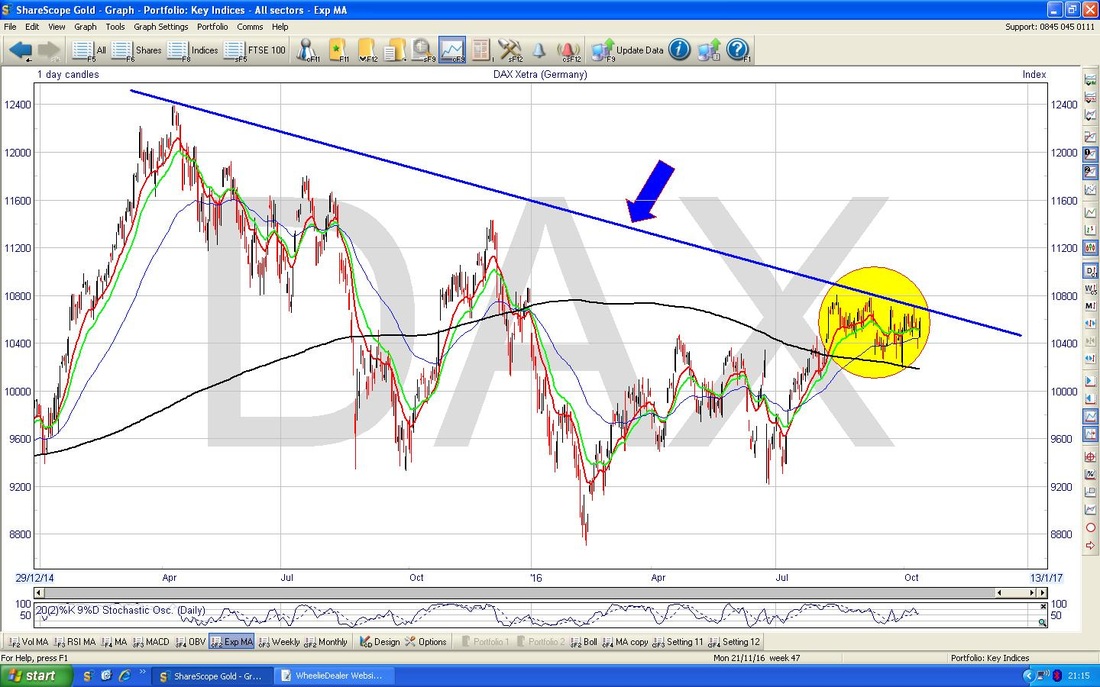
I won’t dwell on this but there is something key to watch - the Chart below has the Daily Candles on the DAX going back about nearly 2 years. Note my Blue Line (marked with the Blue Arrow) which is showing Resistance and the Price needs to get over it - I guess this means we need to see the Price over about 10800 to be really confident it has Broken Out. My Yellow Circle is highlighting how all the recent Price Action has taken place in a bit of a Sideways Range but the Blue Line is reining things in.
S&P500
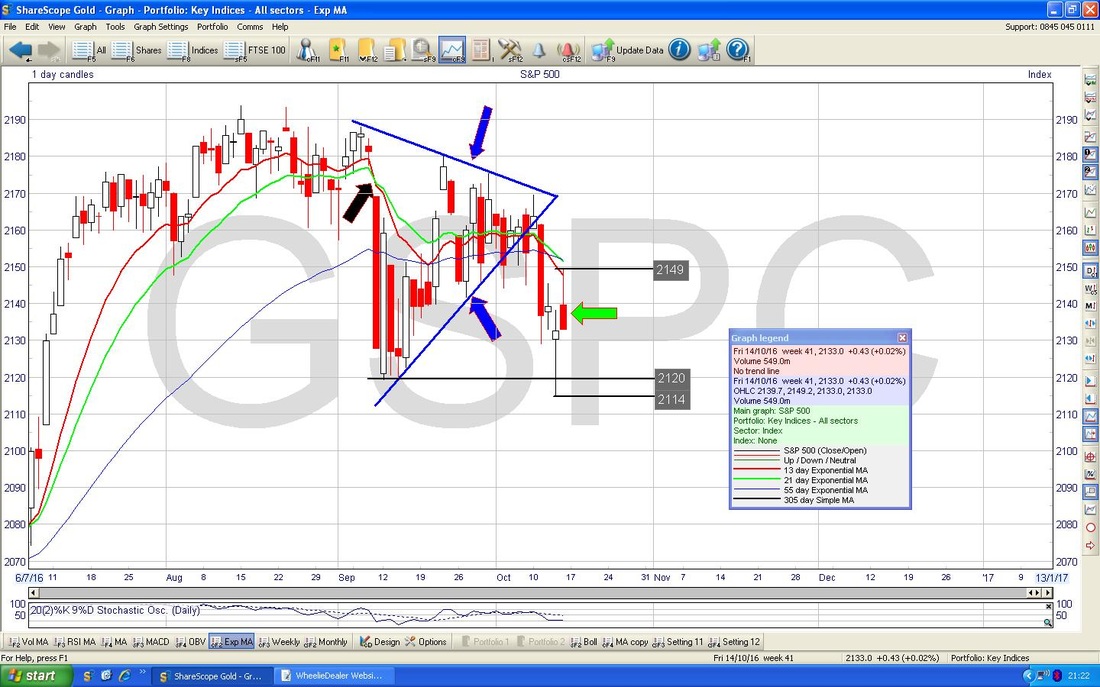
The Chart below has the Daily Candles going back around 3 months. First thing to notice is how the Price fell out of the Bottom of the Blue Lines Triangle which I have been bleating on about for weeks. This is not a positive development - but with a Pervert or a Crook about to get in the White House, I guess it is no big shock. My Green Arrow is pointing to the Candle generated yesterday (Friday 14th October) - note how it failed to hold the Intraday Highs - this is not a great sign. To the upside, 2149 is clearly a barrier and on the downside, Support is at 2120 then 2114 - the latter must hold. Note my Black Arrow is still pointing to the 13/21 Day EMA ‘Death Cross’ that was performed a while back - the Price is still below both these EMAs and the Red 13 Day EMA is still under the Green 21 Day EMA.
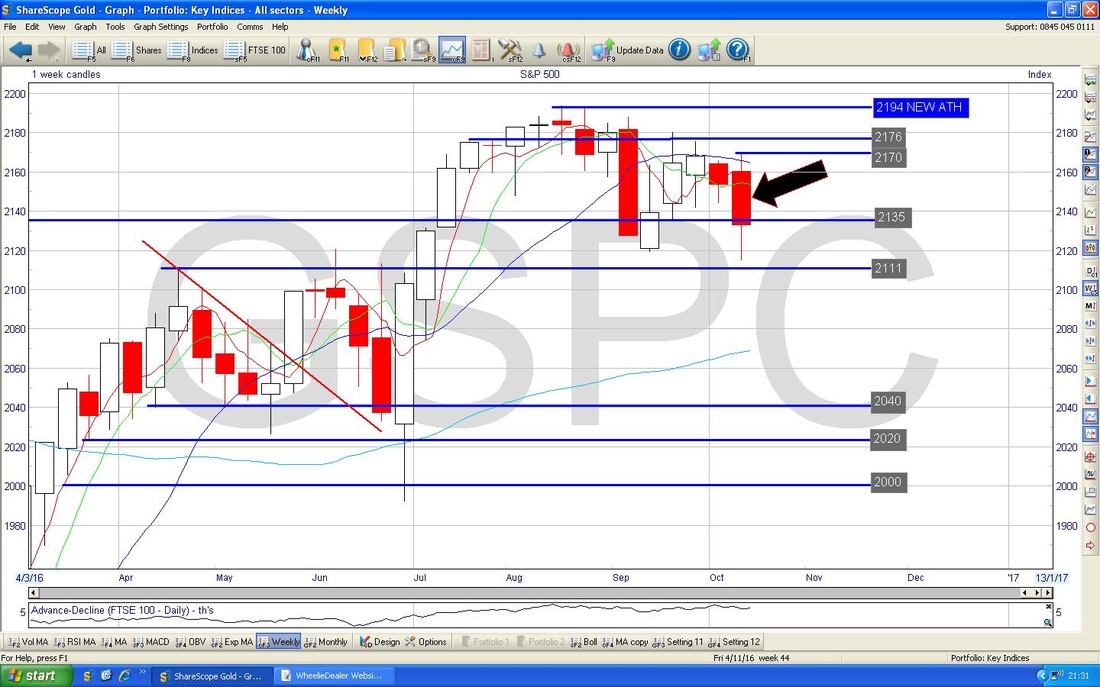
The Chart below has the S&P500 Weeklies - the Candle from last week, marked with my Black Arrow, put in a decent turnaround during the Week from its low point but we still ended up with a sizeable Down Candle and it doesn’t look great.
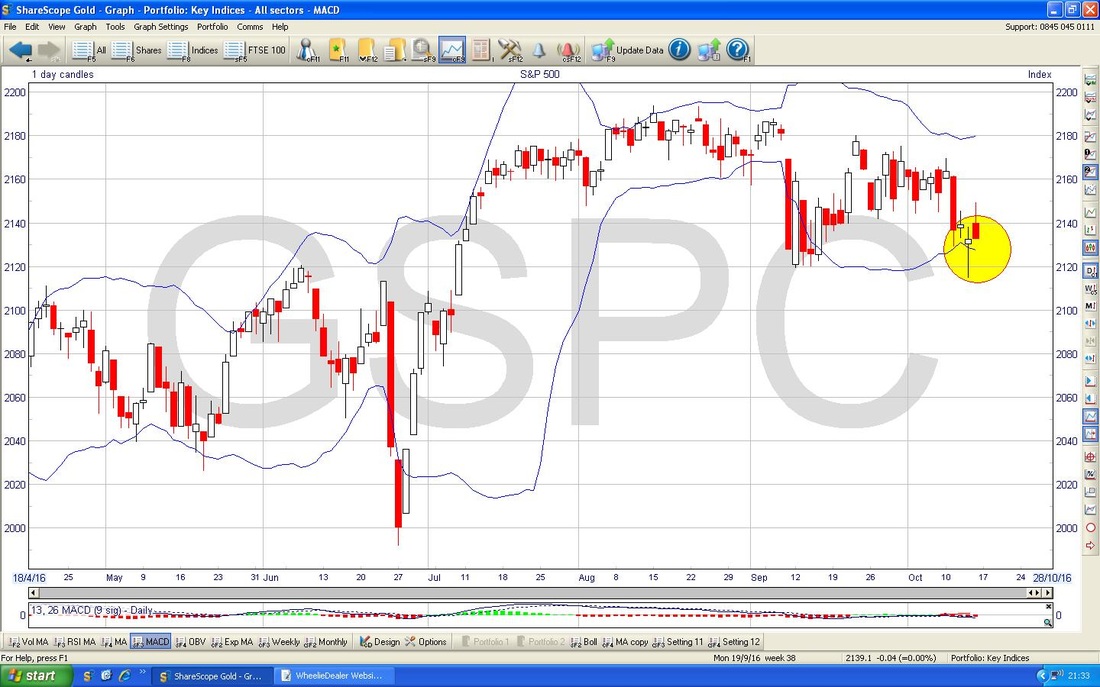
The Chart below has the Daily Candles with the Blue Lines marking the Bollinger Bands around it. My Yellow Circle is highlighting how the Price fell down to the Bottom BB and then reversed up with a lovely Reversal Hammer/Dragonfly kind of Candle on Thursday - it needs to move up now from the Bottom BB but it can of course ‘hug’ the BB and keep falling.
Nasdaq 100
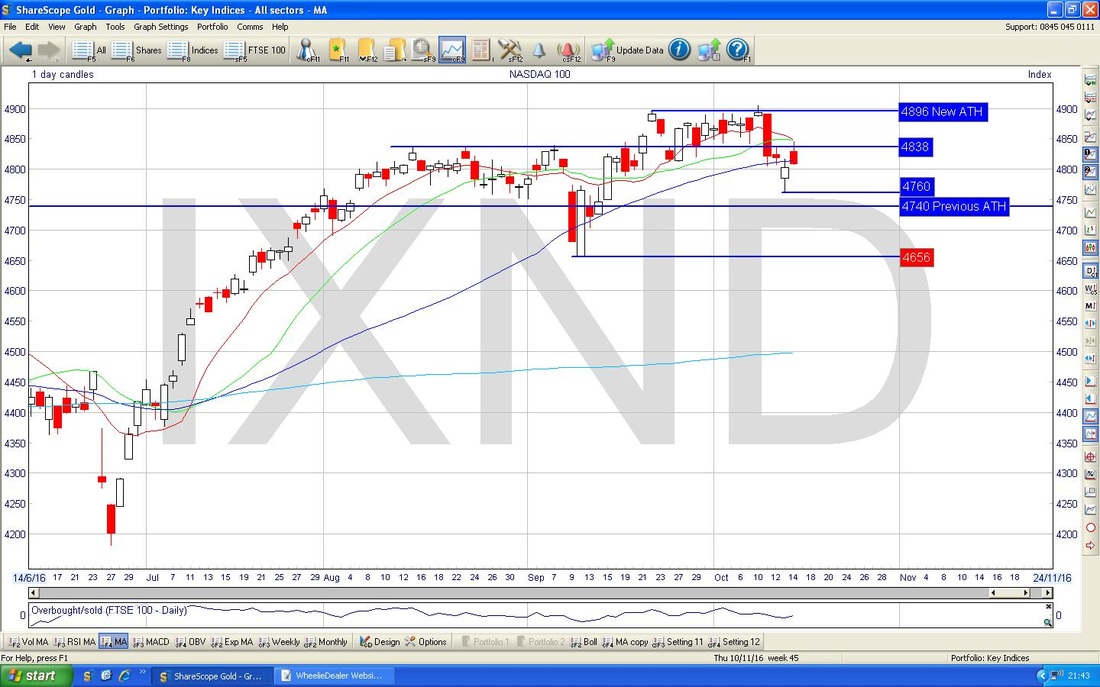
I have a Short on this Index so it is very interesting to me. The chart in recent Days has been largely similar to the S&P500 although over a longer timeframe it has been much stronger - this strength is not ideal for my Short but I am expecting the Nasdaq to fall back into line with the S&P500 as we get nearer the US Pres Election on November 8th (we might also see more focus on the likelihood of a Rate Rise in December). Important things here are Support at 4760 and ultimately at 4656 - if the latter fails, then expect ugliness.
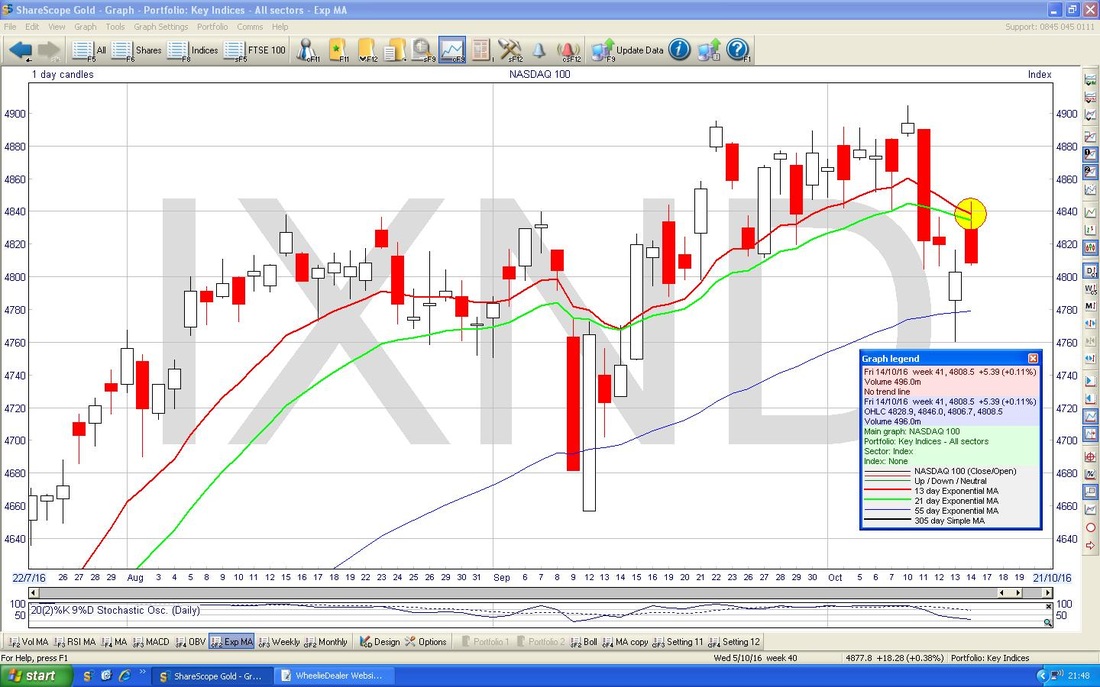
Something to watch here - my Yellow Circle is showing where the Red 13 Day EMA is getting very near crossing the Green 21 Day EMA - if this happens we get a ‘Death Cross’ (like on the S&P500 some time back) and this could mean weeks of falls on the Nasdaq.
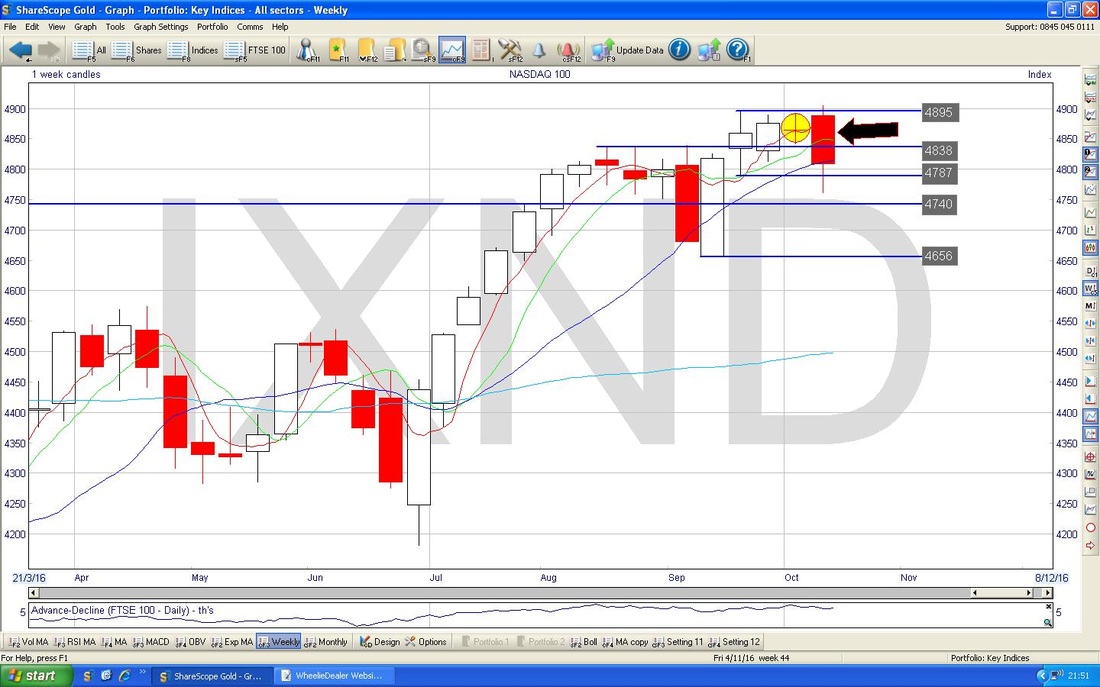
The chart below has the Weekly Candles for Nasdaq 100 - my Black Arrow is pointing to a pretty much Red Down Candle from last week (although it did manage to Close up off the Lows) and note how this has swung down off the lovely example of a Doji Candle from the Previous Week (marked by my Yellow Circle). It looks very possible we are getting a direction change here and heading lower.
Quid / Buck
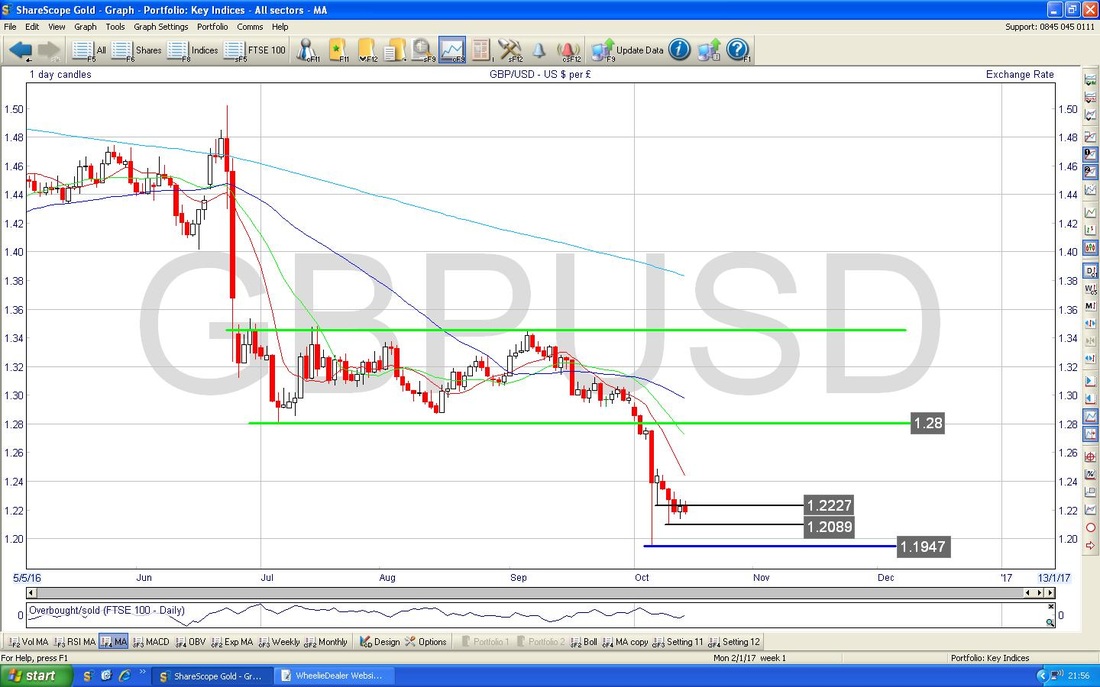
The Chart below has the Daily Candles for the £/$ - this is really all about Support and Resistance and at the moment the next important Support is at 1.2089 and if this fails then expect a test of 1.1947. However, my suspicion is that all this Selling is way overdone (this is often the case when Everybody and his Woofer are talking about something and it is splashed all over the News and Politicians have suddenly become Currency Trading Experts - everyone things the Pound will drop so this most likely means it will rise !!). I have a Blog Outline in my mind about this subject of how things overshoot when everyone is talking about them - maybe it will appear in coming months !!
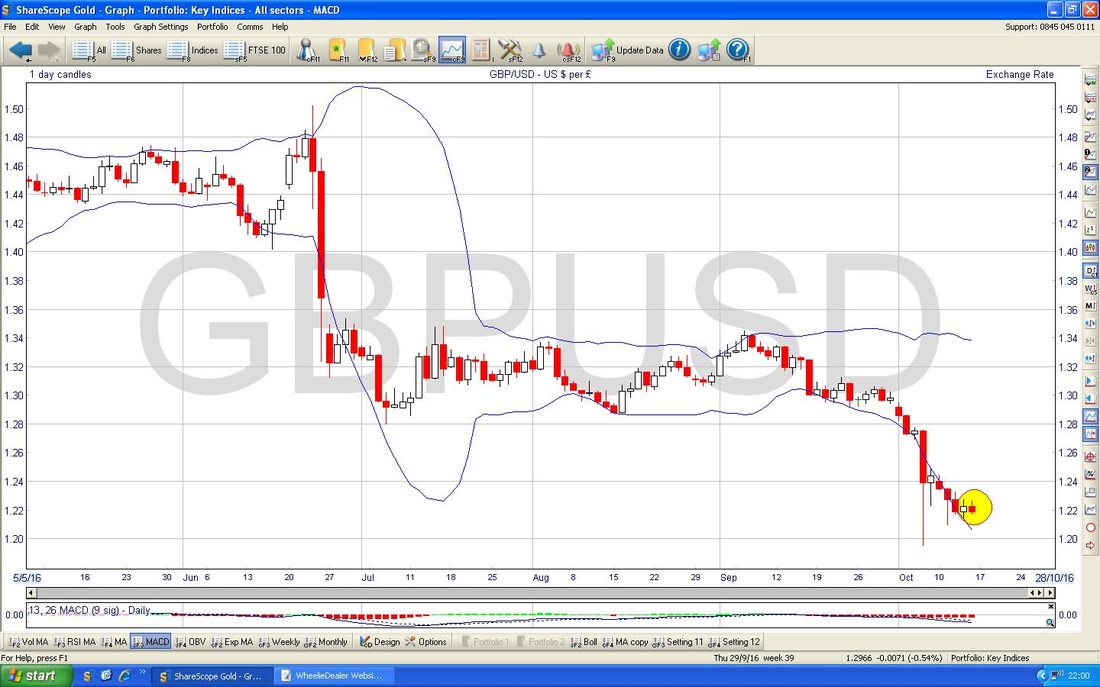
The screen below has the Daily Candles for £/$ with the Blue Bollinger Bands around them - my Yellow Circle is highlighting how the Price Action of the last 2 days has all been back inside the Bands - this suggests at least Sideways now or maybe the Quid will rise.
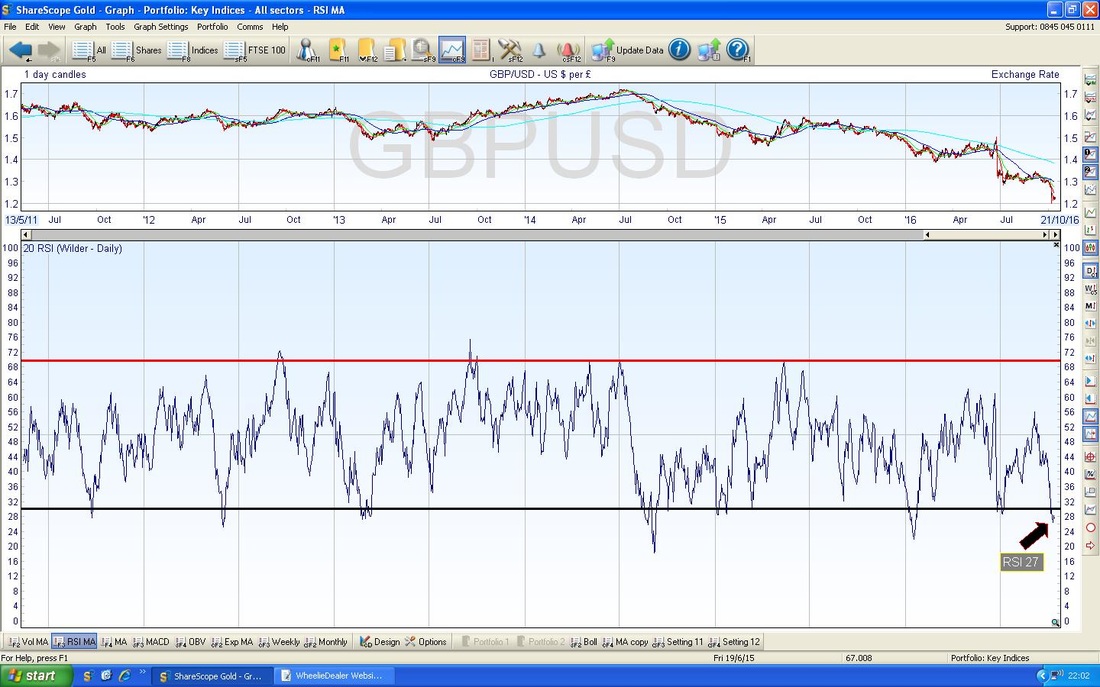
In the bottom window below we have the RSI for £/$ - note how with a reading of RSI 27 this is extremely low and it is pretty obvious a Bounce is very likely from such an Oversold level.
With how things have moved recently, it seems likely that any strength in the Pound might cause the FTSE100 to drop.
Brent Oil (Spot)
Due to time constraints I won’t do much detail here but I am showing below a ‘Big Picture’ view of the Weekly Candles - this actually tells us a lot and sometimes it is better to use Larger Timeframes to really figure out what is going on. Daily stuff often is too ‘noisy’ and not enough ‘signal’. First thing to note is my Black Line (marked with the Black Arrow) at about $54. This looks like pretty strong Resistance and the Bulls need to get Brent Oil over this level. Next look at my Green Line (marked with Green Arrow) - this is an Upwards Sloping Line and should act as Support - there is a bit of a Triangle going on here and Bulls will be hoping it pops to the Upside and over $54. My Yellow Circle is highlighting an ‘Inverted Hammer’ type Candle from Last Week - this suggests we will see a pullback in coming days. Note my Green Circle shows where a similar Inverted Hammer was created. Longer Term, $70 looks a very Strong Resistance Level - I have marked this with my Red Line and Red Arrow. Now look at my Blue Line (marked with the Blue Arrow) - now stop looking at it because it doesn’t tell us a great deal. Got ya !!
Gold (Spot)
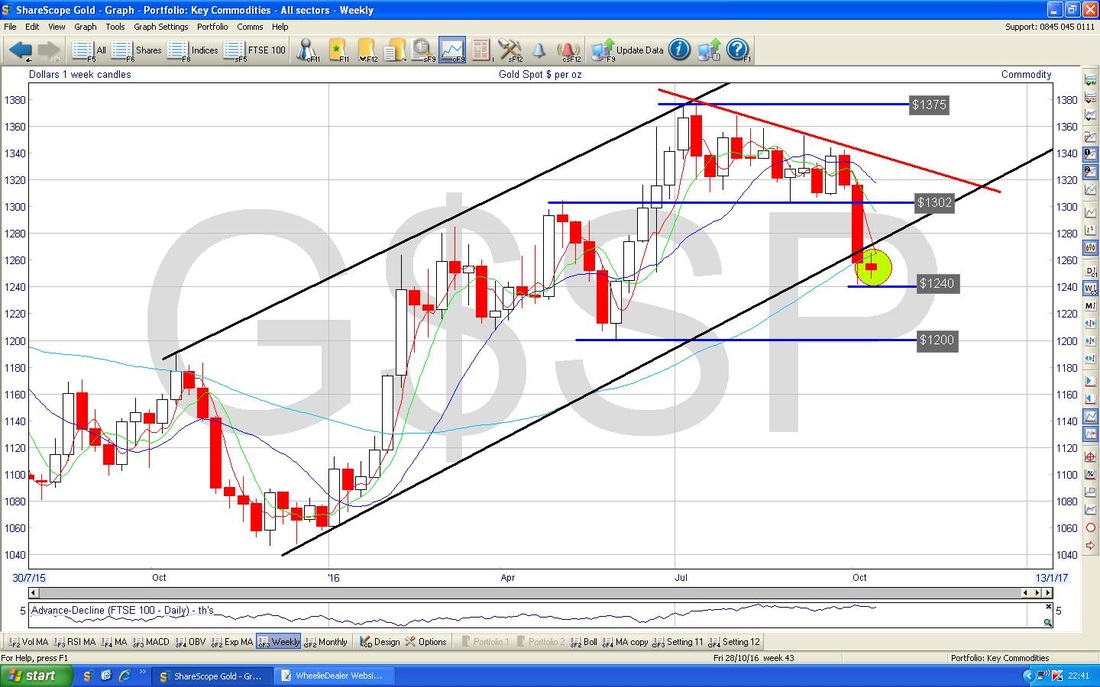
The Chart below has the Weekly Candles for Gold (Spot) going back about 1.5 years. Note the Black Parallel Lines which are showing an Uptrend Channel and how we are just outside the bottom Black Line but also we are pretty much on the 200 Day Moving Average which is the Faint Blue Wiggly Line. Support at $1240 is important and it must hold, and my Green Circle is pointing out the Candle from Last Week which was a pretty sweet ‘Spinning Top’ sort of Doji which suggests that after the recent falls, we might see a move Up or perhaps some Sideways action in coming weeks. OK, that’s it for this week - good luck all !! Cheers, WD.
3 Comments
Father ted
16/10/2016 10:36:35 am
Very good WD. Most of charts are beyond me but the currency chart was pretty clear even to me.
Reply
WheelieDealer
17/10/2016 11:35:04 pm
Hi Father ted, Thanks for the feedback - as you know I try to keep the Charts simple - partly so people can understand them but also because I just don't think complexity adds anything useful when trying to read what the Charts are telling us.
Reply
25/1/2023 04:38:30 pm
Investing online has been a main source of income, that's why knowledge plays a very important role in humanity, you don't need to over work yourself for money.All you need is the right information, and you could build your own wealth from the comfort of your home!Binary trading is dependent on timely signals, assets or controlled strategies which when mastered increases chance of winning up to 90%-100% with trading. It’s possible to earn $10,000 to $20,000 trading weekly-monthly in cryptocurrency(bitcoin) investment,just get in contact with Mr Bernie Doran my broker. I had almost given up on everything and even getting my lost funds back, till i met with him, with his help and guidance now i have my lost funds back to my bank account, gained more profit and I can now trade successfully with his profitable strategies and software!! Reach out to him through Gmail : [email protected] ,Telegram: bernie_fx or WhatsApp +1(424)285-0682 for inquires
Reply
Leave a Reply. |
'Educational' WheelieBlogsWelcome to my Educational Blog Page - I have another 'Stocks & Markets' Blog Page which you can access via a Button on the top of the Homepage. Archives
May 2024
Categories
All
Please see the Full Range of Book Ideas in Wheelie's Bookshop.
|


