

|
educational blogs |
|
Where did the last 3 months disappear to? OK, the Markets have dragged a bit for many of us and been quite tedious, but I find it shocking we are already a quarter of the way through the year. April tends to be a really strong month - according to the UK Stockmarket Almanac 2016, it is the 2nd strongest month historically, with only December beating it. On average, April is up for 71% of Years with an average gain of 1.8% - however, this is often a ‘last hurrah’ for Winter, and May is the 10th best month (i.e., the 3rd Worst).
Normally April sees rises week on week, but I wonder if this year the Brexit Vote will shorten any such rises - we are less than 3 months away now and it is inconceivable that this will not cause considerable uncertainty. For the coming week, we are up on average for 65% of years, with an average gain of 0.6%.
FTSE100
The ShareScope Screenshot below has the FTSE100 Daily Candles for about the last 8 months. In many ways we have not really changed much from last week - which is good for me as I am a bit short of time tonight with the MotoGP being so late (instead of fighting the Argentineans for a Sheep Island, maybe we should get them to change their Clocks !!), so no need to show loads of Charts (oh, the race was a belter by the way - you can usually catch it on ITV4 around 8pm on Monday Night). First off note my Black Arrow pointing to the 200 Day Moving Average Line which is still falling - this denotes we are still in a Downtrend, despite the strong Rally over the last few months. My sort of Pinky Arrow is pointing to the 50 Day Moving Average - it is great that this is curling upwards but obviously it can turn back down fairly quickly - as you can see back in late December 2015. We need the 50 Day MA to cross the 200 Day MA and then we will have a ‘Golden Cross’ which would be a nicely Bullish sign. My Red Arrow is pointing to a Red Downtrend Line which has now pretty convincingly been broken - this is a Bullish development. 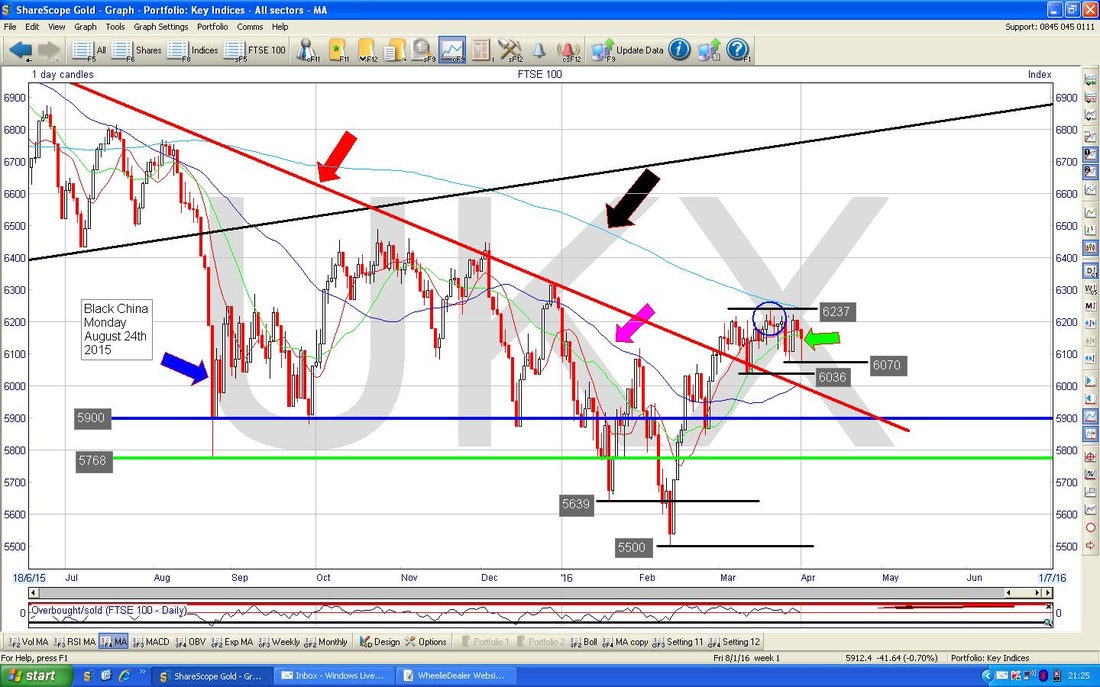
On the Chart below, I have zoomed in to most of 2016 - the main thing here is that we seem to perhaps be stuck in a tight Range now between about 6036 and 6237 - note how the 200 Day Moving Average is near the top of this Range and could be representing Resistance.
At some point in time we will pop out of this tight Range - if it breaks out of the Top, then we will most likely go higher; and if it breaks out of the Bottom, then we will likely go lower. So these are the Key Levels to watch. Note the recent Lows are at about 6070 - this is now a Support Level. My Green Arrow is pointing to a Hammer Candle we got on Friday - but in this context of just going sideways, it doesn’t tell us much. Hammers tend to be most predictive at the bottom of a long Downmove and they can do similar to mark a Reversal at the Top of a strong Upmove. 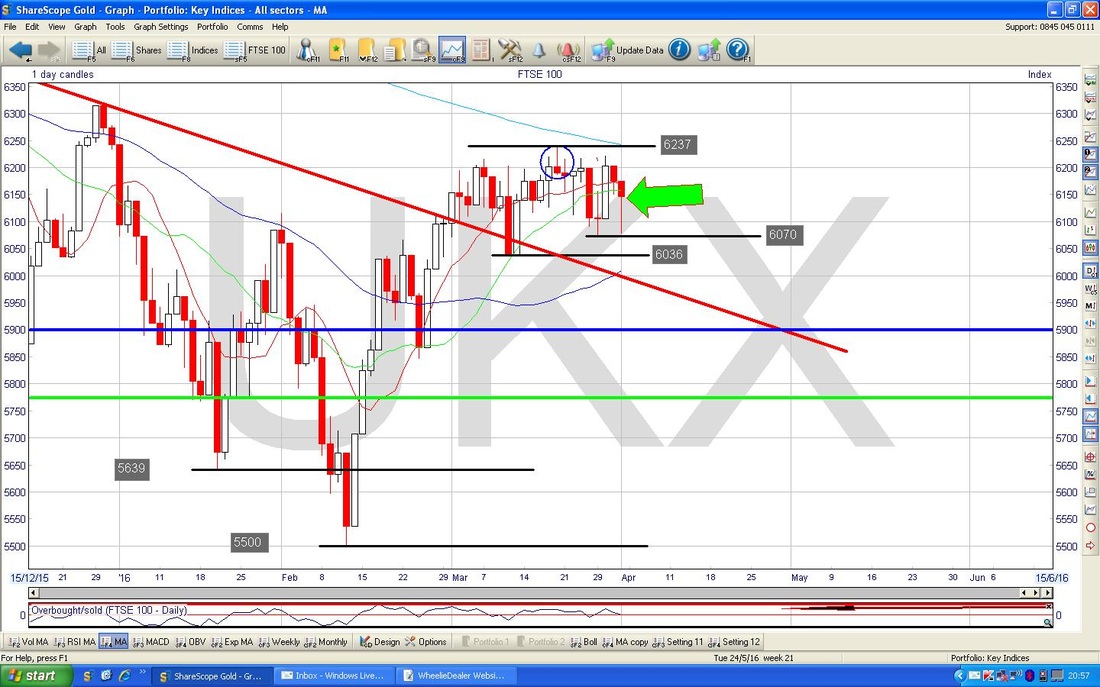
Simon Thompson’s All-Share Bear Market
Near the start of the year I did a Blog of the Indexes and put in a bit about an Article I had read from Simon Thompson in the Investors Chronicle. I won’t go into the details now (because I can’t remember them !!) but the crux of the matter was that we need the FTSE All-Share Index to stay above 3186 by the end of March 2016 to avoid a Bear Market - we have achieved this as you can see on the Chart below. It doesn’t mean we are safe, but things look brighter by Simon’s criteria (note, this is the ‘official’ “20% drop from the High” description of a Bear Market - I am not overly in agreement with this description as I have mentioned in the past. 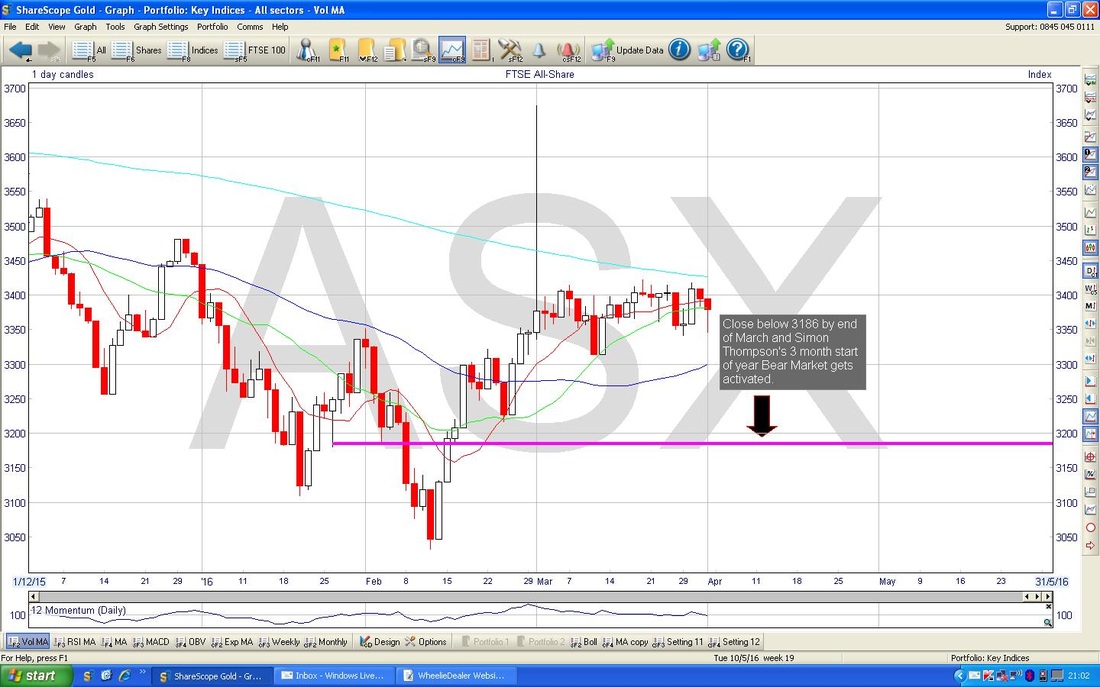
S&P500
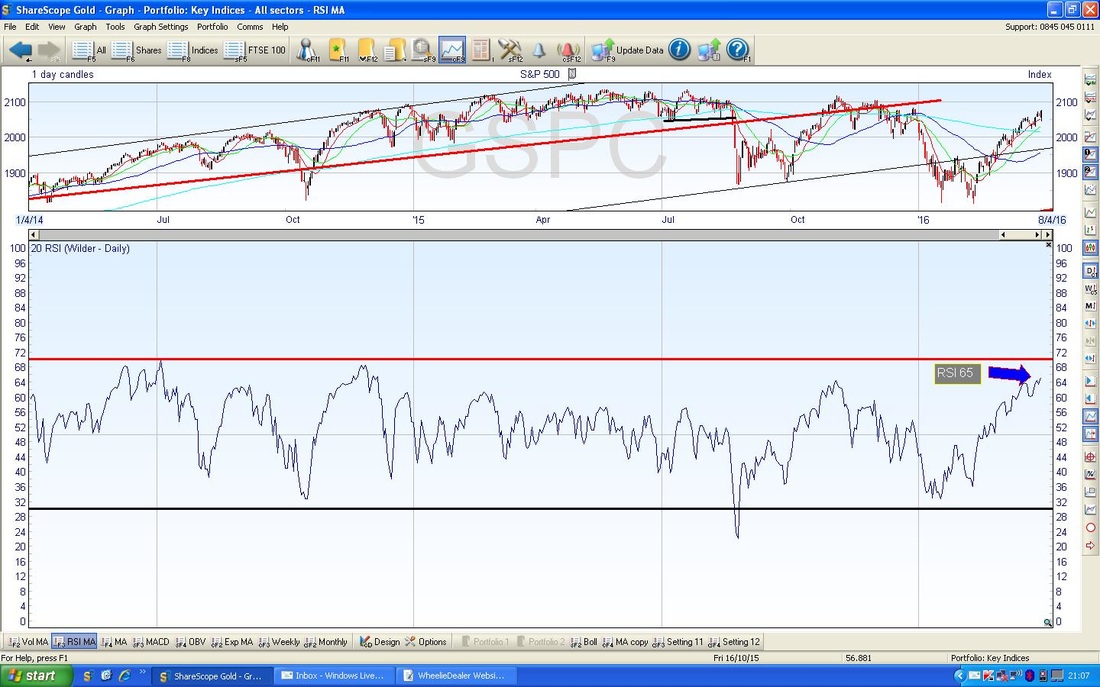
The Chart below has the S&P500 (the main US Index in my view) Daily Candles going back about 8 months. My Green Arrow points to the 200 Day Moving Average which is sort of starting to level out - which is a good sign, but of course we need it pointing Upwards for a Bull Market. My Red Arrow is pointing to the 50 Day Moving Average - this has turned up nicely, but as with the FTSE100, we need it to cross the 200 Day Moving Average. Note at the end of 2015 we had such a ‘Golden Cross’ but it was not sustained and we very soon after had a ‘Dead Cross’. I think last week I pointed out the Pink Line marked with my Pink Arrow - a major Bullish development this week is that the Price has broken out of this Downtrend Line - this is good. My Black Arrow is pointing to a strong Up Candle which we got on Friday - this is Bullish but the challenge now is that there is massive Resistance up above the current Price, from 2080 up to the All Time High at 2135. 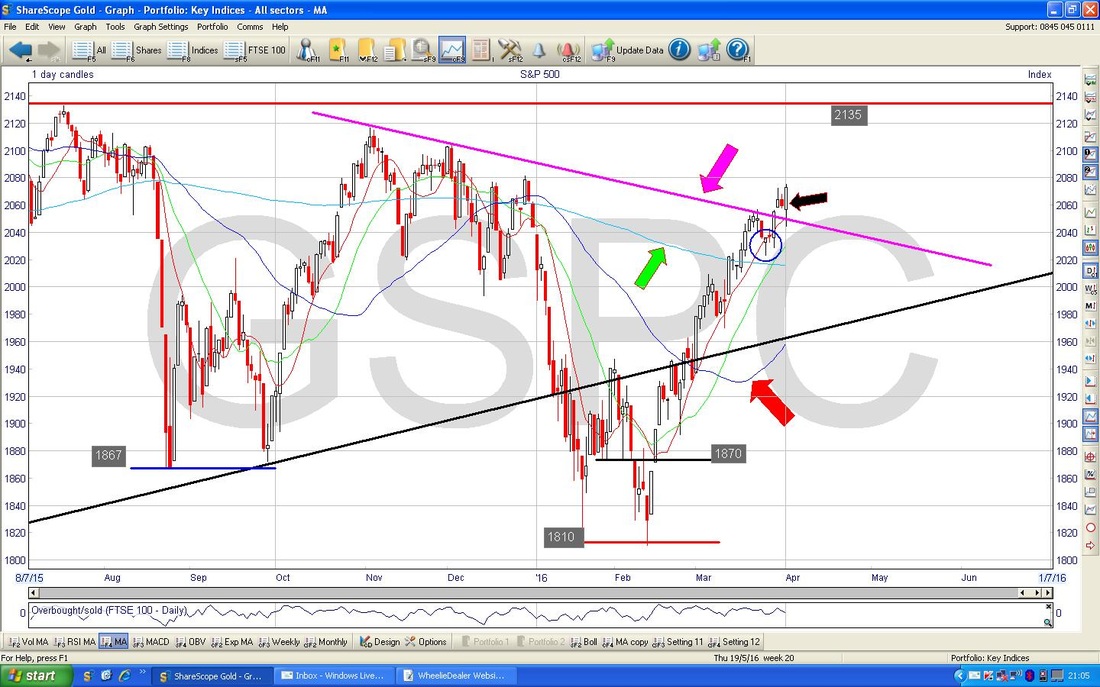
In the bottom window below we have the Relative Strength Index (RSI) for the S&P500. We have a current reading around RSI 65 which is a pretty extended level by the standards of what the S&P500 usually does - so I suspect the upside is limited now and maybe we can move up a bit through April, before “Sell in May and go away…….” as usual (or “get your arse out of Stocks cos the UK is about to destroy the EU” [hopefully]..)
Brent Oil
My Blue Arrow is pointing to the falling 200 Day Moving Average - so Brent Oil is clearly still in a Major Downtrend. My Black Arrow is pointing to the 50 Day Moving Average which is rising nicely - but as usual, we need a ‘Golden Cross’. My Green Arrow is pointing to a Big Red Down Candle from Friday - this is obviously not a great sign for Bulls, but note how the Price is still within my Shorter Term Uptrend Channel marked with the 2 Blue Lines. It is important that the lower Blue Line holds - this will indicate the direction in coming days. Note Support not far below from the 50 Day MA at about $37 and $36 looks another good Line of Support. Clearly $42.5 is still the Major Resistance that needs to be broken over. 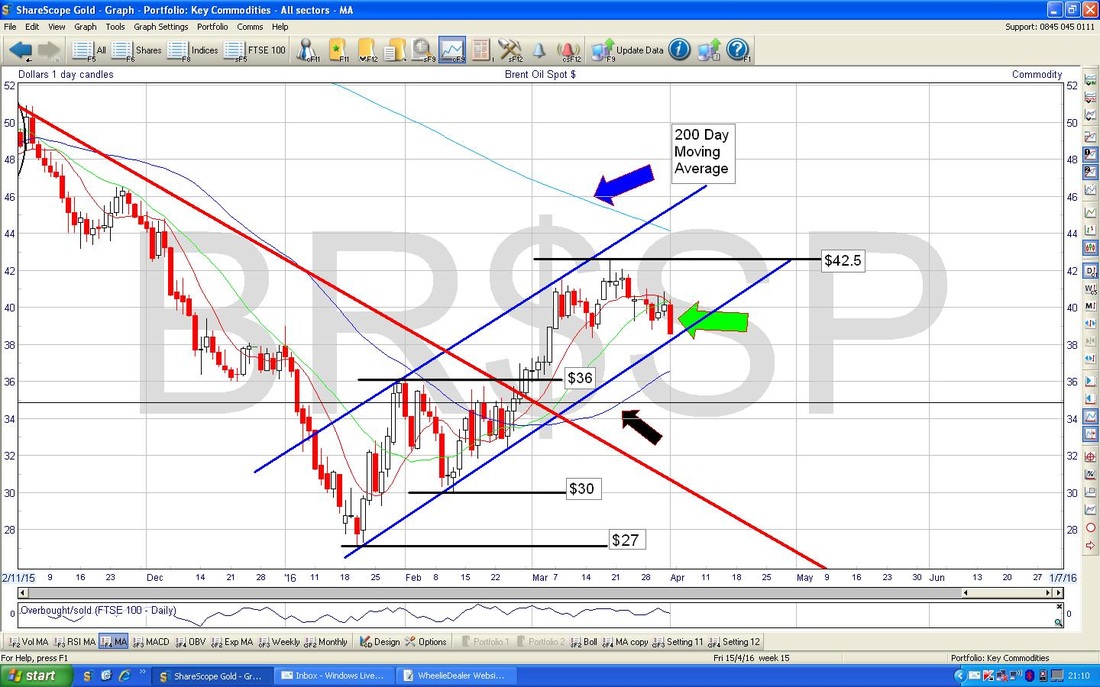
Gold
The Chart below is a bit busy !! Note the Big Red Down Candle from Friday which I have marked with my Red Arrow - this is not too good. The key here is that the recent Low at $1207 holds - if this breaks downwards, then Gold is going lower in the short term. My 3 Red Circles are suggesting a possible ‘Head & Shoulders’ pattern which would be Bearish if it follows usual Technical Analysis Rules (you need to be imaginative - my smaller circle is supposed to mark the Head). Note the Price is now sat on the 50 Day Moving Average which I have marked with my Blue Arrow - it might find Support here. 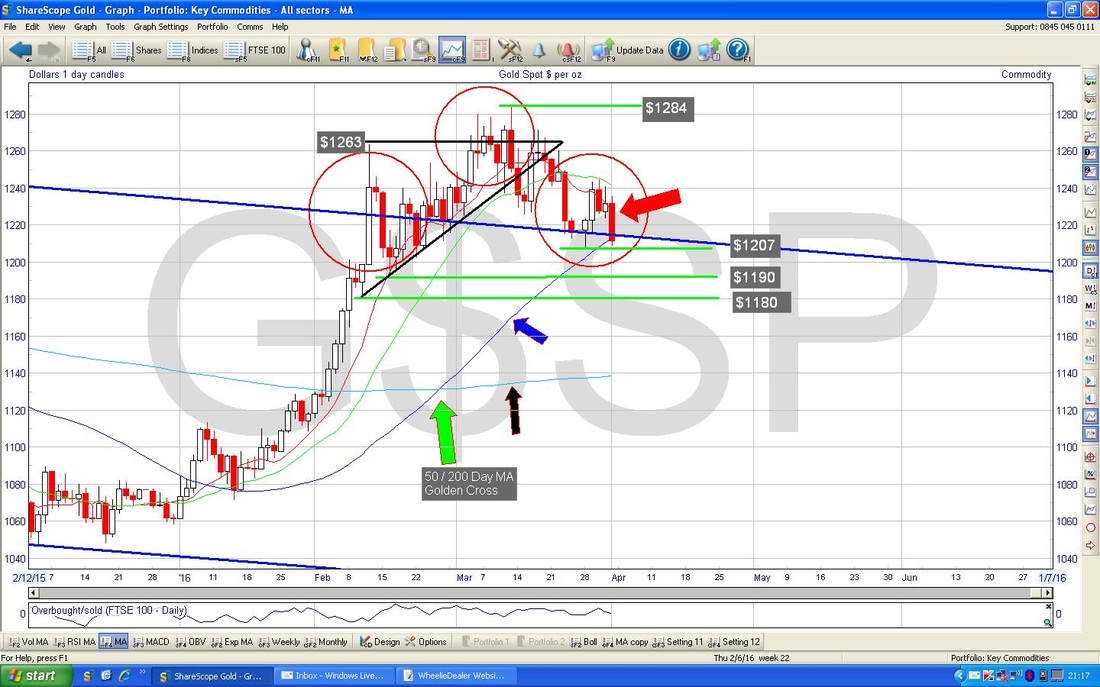
Finally……..
Right, that’s it, the US Indexes look pretty good to me so I would guess the European Indexes can go up with it. However, Brent Oil is less clear, so maybe the FTSE100 will be dragged back by this - there has been a close correlation for much of the last few months. April is normally a good month but chances are that the Brexit Vote will become a factor soon - I am sticking by my cautious Strategy and expect my Short Hedges to be of use soon. Good luck for the coming week, WD
2 Comments
Ed
4/4/2016 02:57:03 pm
Only about 11 weeks to Brexit vote so should see a bit of volatility on opinion poll results over the next few months. Worth having a buy list ready for any market weakness. June is normally a poor month for the markets anyway.
WheelieDealer
5/4/2016 09:05:40 pm
Hi Ed, 11 weeks seems like a long time but I bet that will fly by and soon we will be in full Brexit Campaign mode - can you imagine the tedious TV news coverage this will get ?!! Leave a Reply. |
'Educational' WheelieBlogsWelcome to my Educational Blog Page - I have another 'Stocks & Markets' Blog Page which you can access via a Button on the top of the Homepage. Archives
January 2021
Categories
All
Please see the Full Range of Book Ideas in Wheelie's Bookshop.
|
