|
I am quite pushed for time this Weekend as I took the day off yesterday and tried to take my elderly Mum to Buscot Park near Lechlade (on The Thames, near Swindon) with my Brother but despite checking with the Internet during the week, the blessed place was closed and by sheer luck whilst in an extremely bad mood at the prospect of having to go to Lechlade itself (which can be a bit ‘tacky’ and immensely busy when the Sun is out) I noticed a sign by ‘The Trout’ PUB which mentioned something called ‘Kilmcott Manor’ and it turned out to be a divinely peaceful little place which was the Summer Retreat of William Morris - which of course got me thinking of Walker Greenbank WGB although with my quick whizz around the ground floor of the House there was little evidence of Wallpaper. Maybe he didn’t want to be reminded of work when he was at home !!
First off some housekeeping type stuff - firstly can I point Readers in the general direction of the Homepage where I have put pretty much all the details I know so far about ‘Wheelie’s Summer Bash’ on Saturday 23rd September 2017 and everyone is invited.
Nextly (is that a word?), I want to point Readers to a response I put to a Comment under the Diversified Oil & Gas DGOC Blog I did a while back - in essence it says that DGOC looks extremely undervalued after the Reverse Takeover and re-listing of the Shares. If you click on the Blog Category ‘Stock Buy Rationale’ and scroll down a little you should be able to find it.
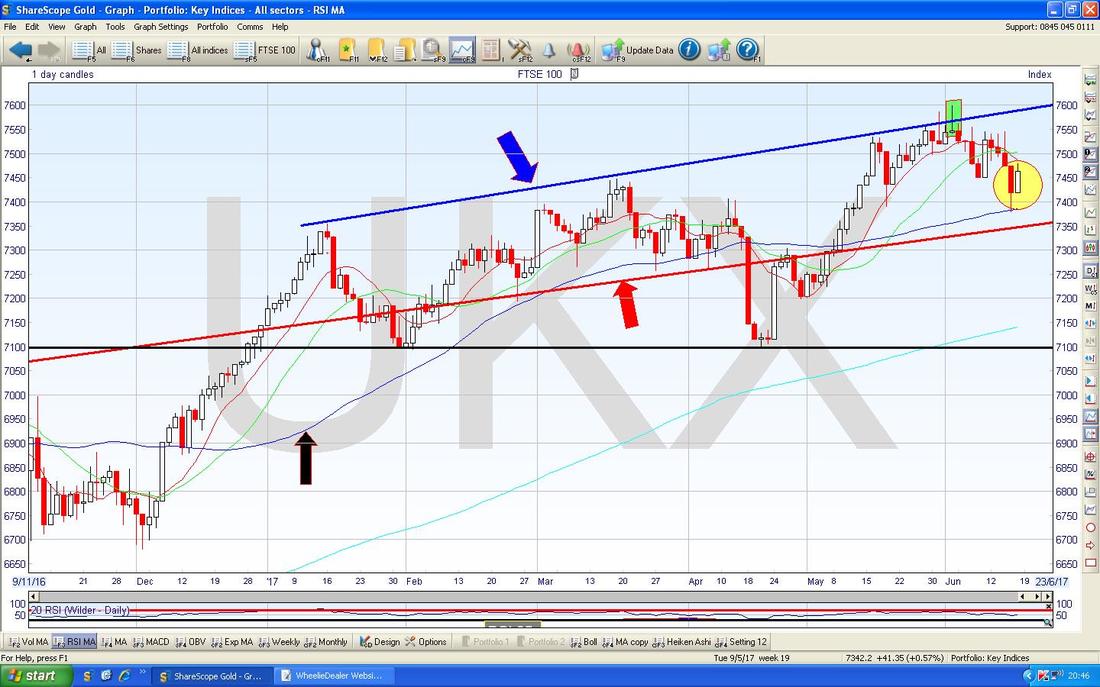
Thirdly I want to just mention that I have written a Blog Draft around a Presentation from Somero Enterprises SOM that appeared on the piworld.co.uk website - because this is obviously timely information, I intend to issue this Blog tomorrow Night (assuming no interruptions !!) but in the meantime you can listen/watch the Presentation here - I recommend you do - it is just under 1 hour: http://www.piworld.co.uk/2017/06/14/somero-som-invester-presentation-june-2017/ You can also find it on Youtube if you use ‘Search’ of some variety. Monthly Trends I made an observation on Tweets the other day that the Month of June has so far lived up to its reputation of being a bit difficult - and this follows May which also did its best to uphold its own reputation for poor delivery. On a slightly more positive note, July tends to be a better month and is usually the 4th Best Month of the Year and then August is sort of OK and is the 7th Best Month. So we might be OK if we can get June out of the way, but after these better Months, we then get September which is THE WORST MONTH - so it is clear that Summer / Autumn are usually a choppy and uncertain time where not much progress tends to be made for the Markets in general. The Queen’s Speech Anyway, in the immediate Week Ahead we can pretty much forget the Monthly trends anyway - what matters now is the Queen’s Speech to Parliament on Wednesday and, more importantly, the Vote that follows it because if the Tories are defeated, then it is very possible that The Queen might invite Labour to try to form a Minority Government and of course this brings us nearer and nearer to a Corbyn Government with a proper Majority which would be catastrophic for Markets and I suspect it could herald some pretty sinister consequences that should have anyone with a level head rather concerned. In theory the Tories should be able to get the Queen’s Speech Vote through because the DUP (Democratic Unionist Party) utterly detest Corbyn because of his Support for the IRA and they will vote with the Tories whether there is a ‘Confidence and Supply’ Agreement in place or not. But of course the numbers are very close and even if the Tories can get past this hurdle, then future Votes will face lots of problems. Note the Tories have put in a provision to push the next Queen’s Speech out for 2 years - they claim this is because of Brexit and because it avoids having to cut short certain bits of Legislation as normally happens when a Queen’s Speech is due - but of course we all know it is simply because it avoids them having to face the potential disaster of failing another Queen’s Speech Vote in a year’s time. So the focus will be on Wednesday and I guess Shares (and the Pound) might come under pressure before the Vote and if the Vote passes, then expect a strong Relief Rally (I will certainly be very relieved !!). If the Vote fails, then I think we could see massive Falls in Stocks and the Pound - it could cause a lot of concern in the Markets. At best the prospect of a Corbyn Government will hurt Stocks because Profits will be impacted by higher Taxes and reduced Investment - of course this will hurt ordinary People’s Pensions but needless to say you won’t get Corbyn and co being honest about this. At worst, we will have people in Power who see no problem with using Violence to achieve Political aims and have no respect for Property Rights or the Rule of Law - it is beyond terrifying and anyone who has a basic understanding of Revolutions and the Socialist/Communist Governments that ensue, will understand how such People are totally against Democracy and they have an appalling record of Summary Executions and suchlike. I find it very depressing how Corbyn and his chums have fooled ‘The Young’ into falling for this nonsense - It is classic stuff from the Marxist Revolutionary playbook. People are rightly wary of the Far Right but the same care needs to be taken when considering the Far Left - they are just different sides of the same Coin which ends in Totalitarianism and Destruction. We need to be very careful now. Until the Vote is out of the way, I am not tempted to buy anything and add to my Long Exposure - the Risks are way too high for my liking. Let’s get charting………. FTSE100 As always, the Charts I shove in here are from the truly magnificent ShareScope software that I use every night as my ‘Workbench’ - I could not function without it. The Chart below has the FTSE100 Daily Candles going back about 8 Months nearly - first off note how the Price went down to the Darker Wiggly Blue Line which is the 50 Day Moving Average (I have pointed at it with my Black Arrow) and found Support here - it would be good if this Line continues to act as Support. Note how the Price Action is all above the Red Line (with the Red Arrow) which is the Bottom Line of that Long Term Uptrend Channel that I continually go on about from the 2009 Lows - this is a good thing. My Yellow Circle is capturing a 2 Day Candle Pattern which is a ‘Bullish Harami’ - yes, it is that good old ‘Preggers Lady viewed from the Side’ one - this implies we should see the FTSE100 rise although of course Wednesday’s Vote in Parliament might impact on this. However, note we do seem to be in an Uptrend Channel which has the Red Line at the Bottom of it and the Blue Line (with the Blue Arrow) as the Top Line.
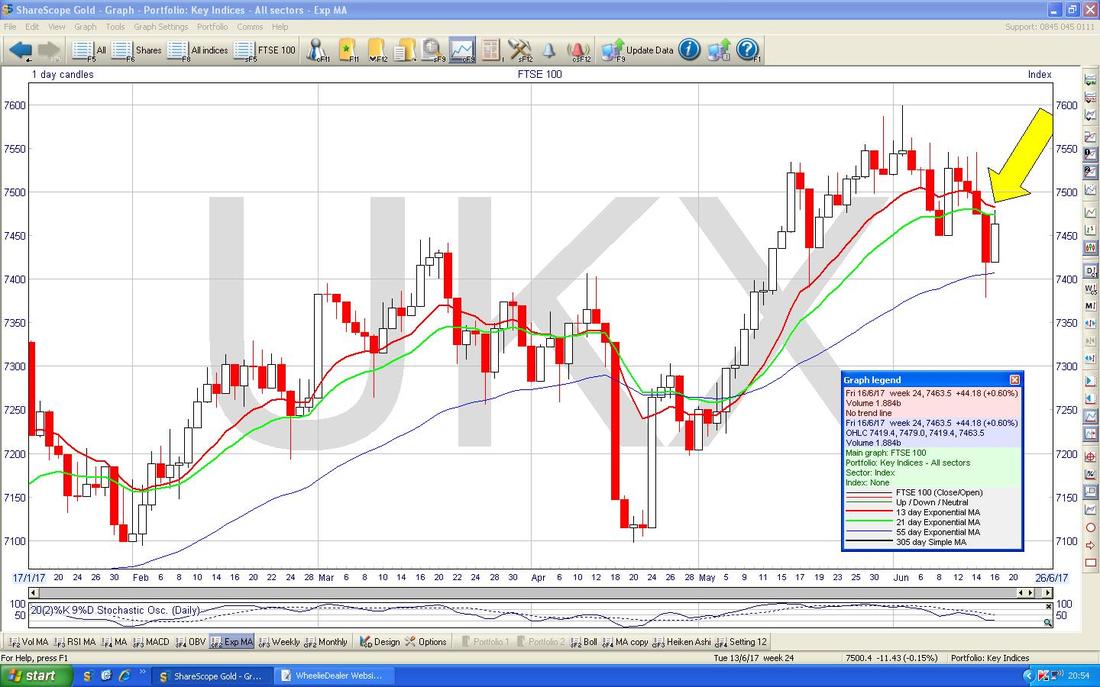
The Chart below has something we need to watch out for which if it happens would be quite negative. My Yellow Arrow is pointing to where we are quite near to a Bearish ‘Death Cross’ between the Red Line which is the 13 Day Exponential Moving Average and the Green Line which is the 21 Day EMA - if these Cross, it usually means the FTSE100 will drop for a few Weeks.
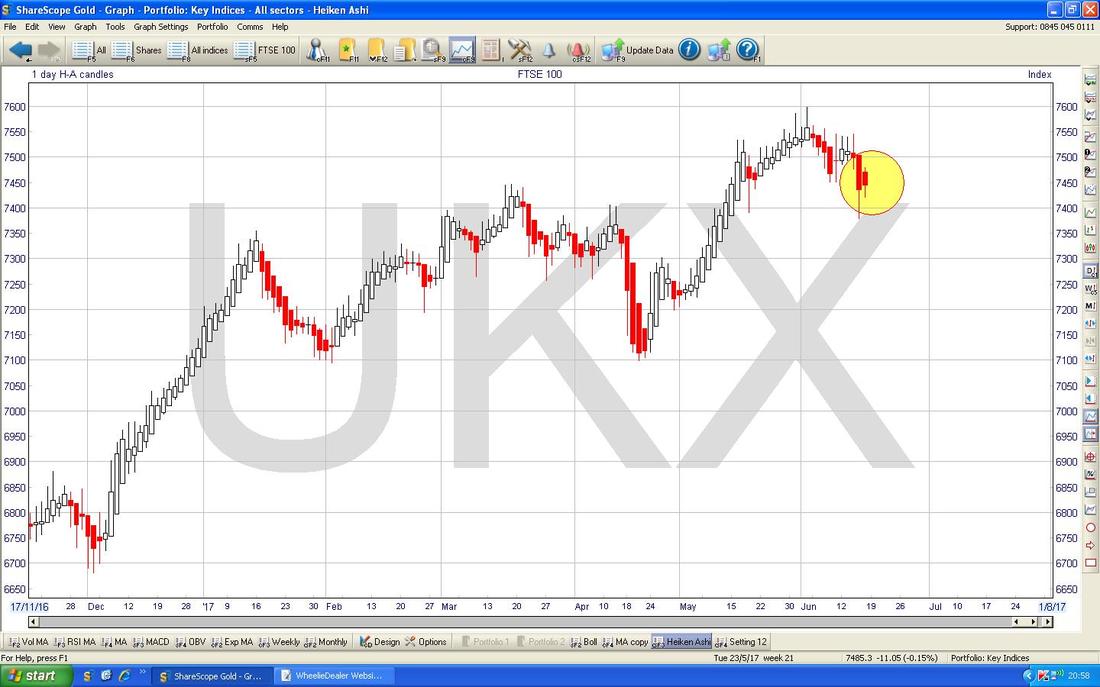
The Chart below has the Daily Heiken Ashi Candles for the FTSE100 - my Yellow Circle is showing where the Candles are Red and Big and Bearish still - it needs to be appreciated that HA Candles are a bit ‘slower’ than Normal Candles so it is quite possible that the Bullish Harami from the earlier Chart holds sway and the FTSE100 can rise off of it.
FTSE250
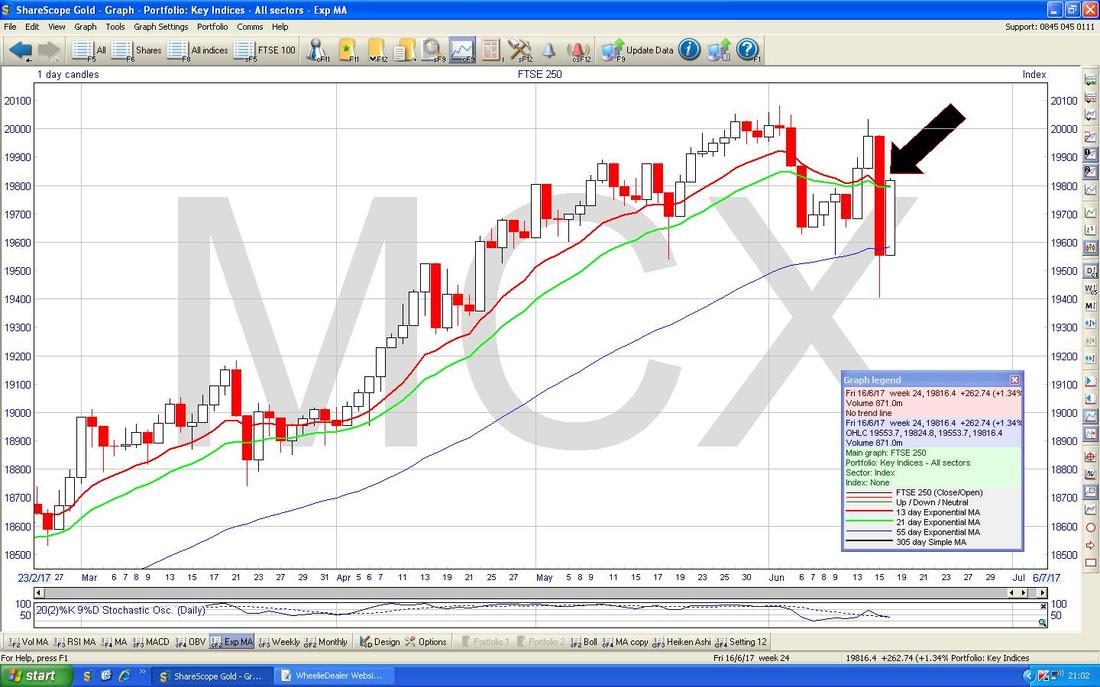
Despite how the FTSE100 tends to get thrown around by the Pound, the FTSE250 is quite similar at the moment - with most of the action happening around the 50 Day Moving Average. However, as with the FTSE100, but looking a little worse, my Black Arrow on the Chart below points to where we are very near a ‘Death Cross’ between the 13 Day and 21 Day EMAs.
FTSE AIM All-Share
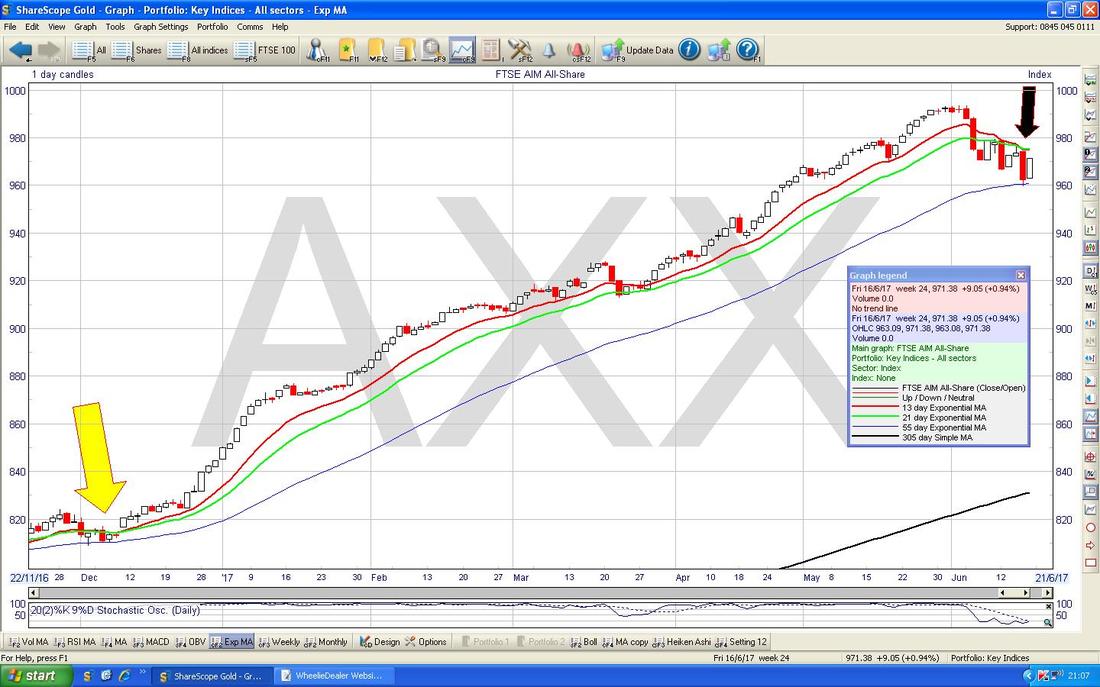
This is mostly similar to the FTSE100 and FTSE250 but on the Chart below note where my Black Arrow is that we got a 13/21 Day EMA ‘Death Cross’ which is not a good sign. Note however, that back where my Yellow Arrow is, we got a similar ‘Death Cross’ but the AIM All-Share managed to turn up again very soon - hopefully it can do that again this time !!
Pound Vs US Dollar
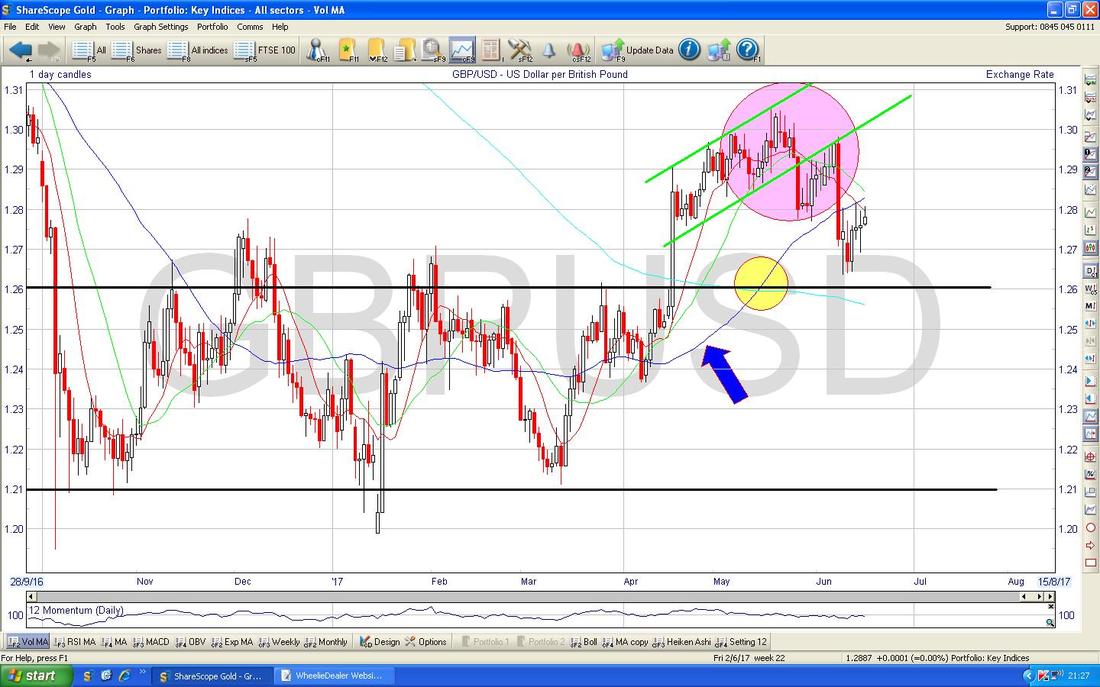
Obviously with the Vote on Wednesday this thing could whizz around like crazy both before and after. The key thing that stands out to me on the Chart below is how there seems to be good Support below at around 1.2650 and lower, and up above my Big Pink Circle his highlighting how there is a huge amount of Resistance that will be difficult for the Pound to wade through - and the ultimate Cap in the Short Term will probably be up around 1.3050. My Yellow Circle shows the Bullish ‘Golden Cross’ between the 50 Day Moving Average and the 200 Day Moving Average which occurred about 3 or 4 Weeks ago - this is a positive thing for the Pound. Note the 50 Day Moving Average which I have pointed at with my Blue Arrow could be Resistance just above at around 1.2850.
DAX30 (Germany)
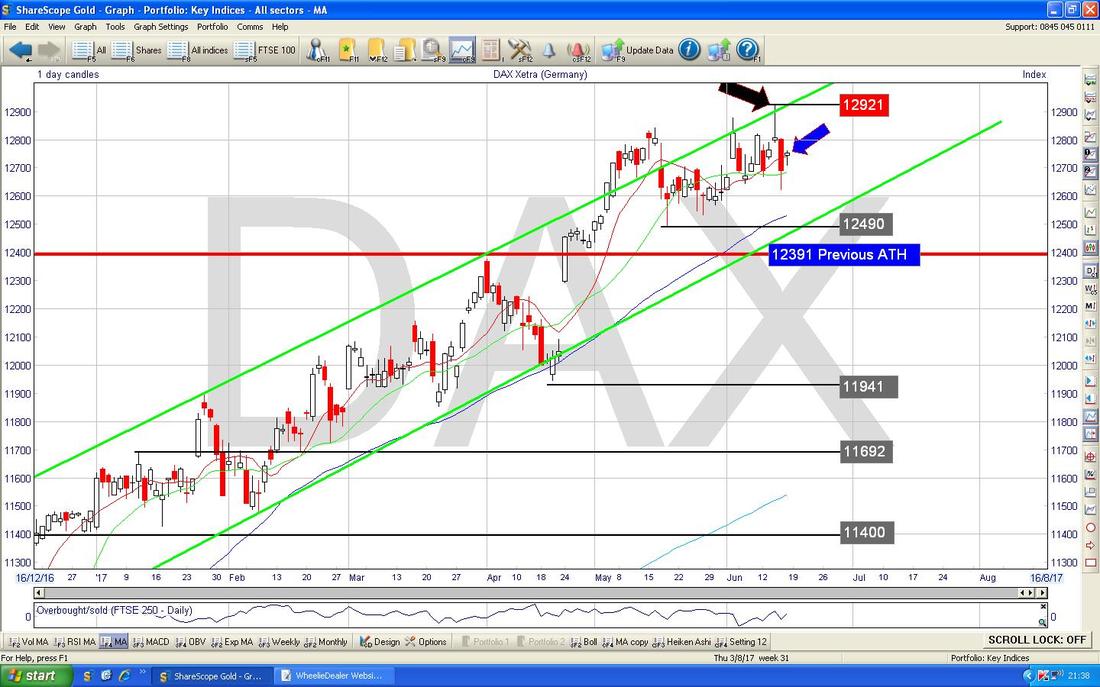
The key thing on the Chart below is the ‘Inverted Hammer’ which was bashed out on Wednesday 14th June - I had actually been poised to put a Long Position on here during the Day but as with all Inverted Hammers, it could not hold the Intraday High and the All Time High Breakout that it made, and when I saw the Inverted Hammer on Wednesday Night I decided not to put a Long Trade on. This Candle is now dominating the Chart and the New All Time High at 12921 is the Key Resistance to get over now. If this can happen cleanly and with a nice Bullish Up Candle - I will probably put on a Long Trade. My Blue Arrow is pointing to a Small Doji Candle which was created on Friday - note how this Doji is within the confines of the Red Down Candle from Thursday and this is what is known as an ‘Inside Day’. As it stands it means nothing of use, however, the Candle we get tomorrow (Monday) will determine what a 3-Day Pattern means - will it be a ‘3 Inside Up’ or a ‘3 Inside Down’?
Dow Jones Industrials (US)
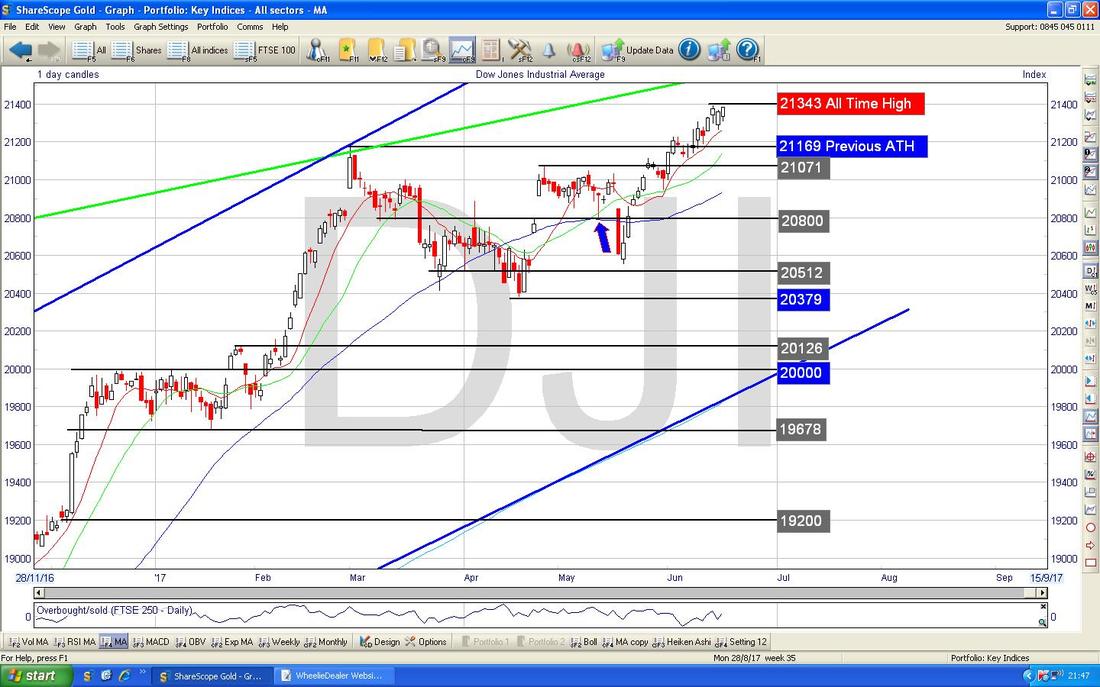
This still looks really bullish with the Index pretty much at All Time Highs - however, the S&P500 and Nasdaq Composite look less eager.
S&P500 (US)
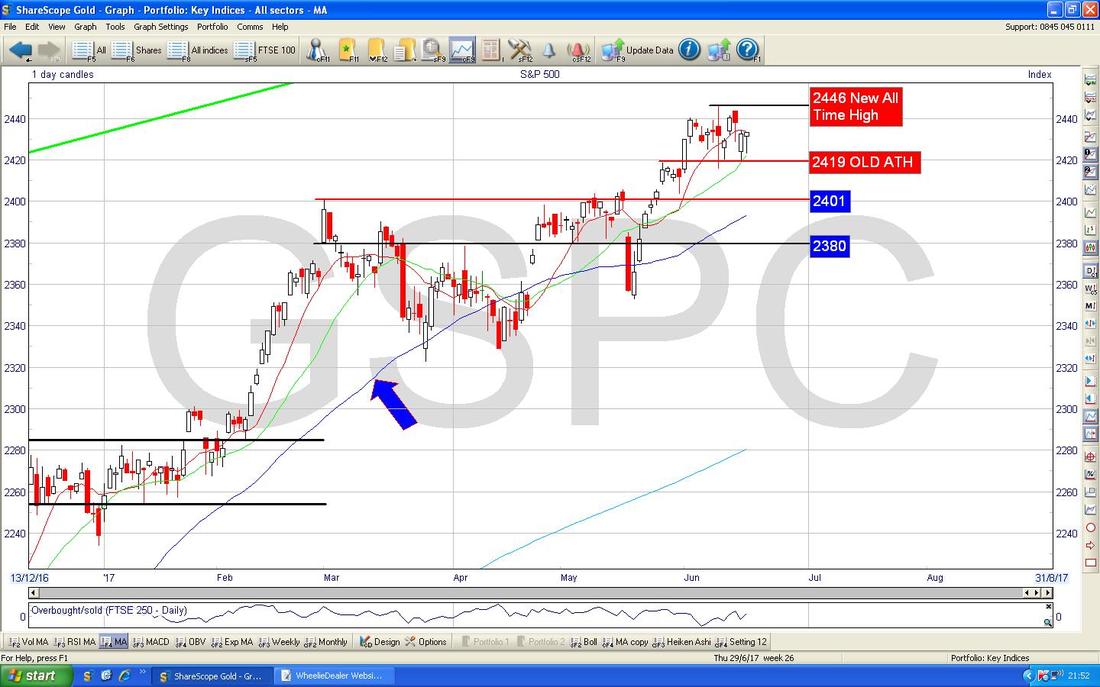
Actually, as you can see on the Chart below, the S&P500 looks pretty Bullish as well as the DOW - it is not quite so strong looking but nonetheless it is very near the All Time High. There is good Support at 2420 in the very Short term and just below at 2400 and 2380.
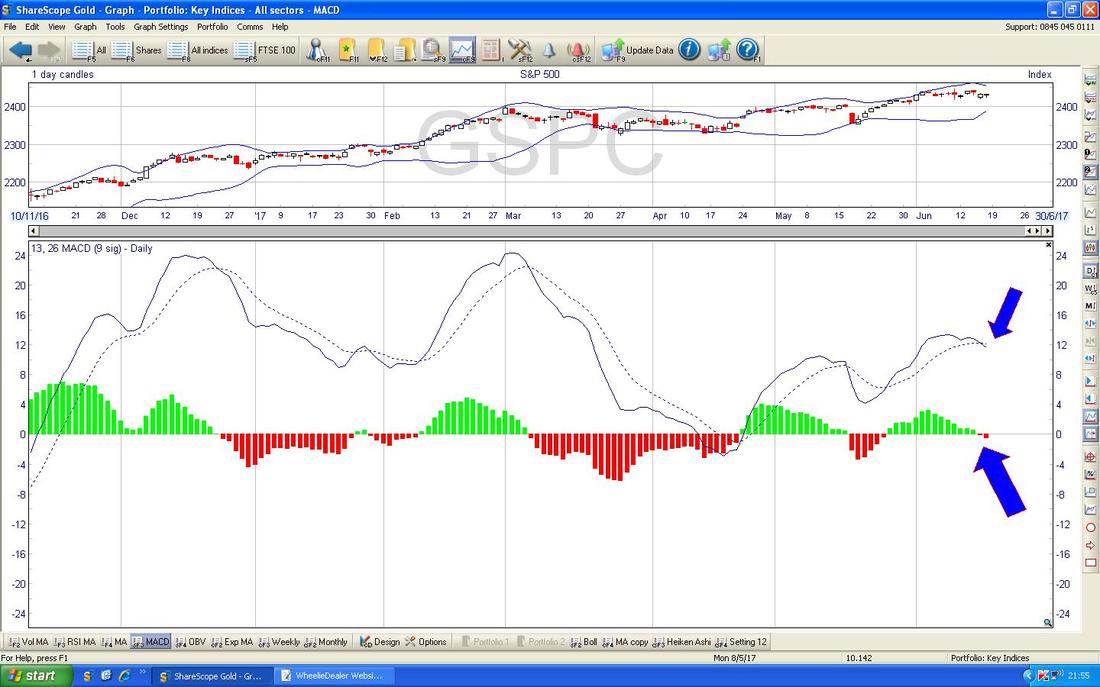
In the bottom Window on the ScreenShot below we have the MACD (Moving Average Convergence Divergence) for the S&P500 Daily. My Blue Arrows are pointing to where it has done a Bearish MACD Cross in both the Signal Lines and Histogram Bars formats (these are just different ways of showing exactly the same thing).
Nasdaq Composite (US Tech)
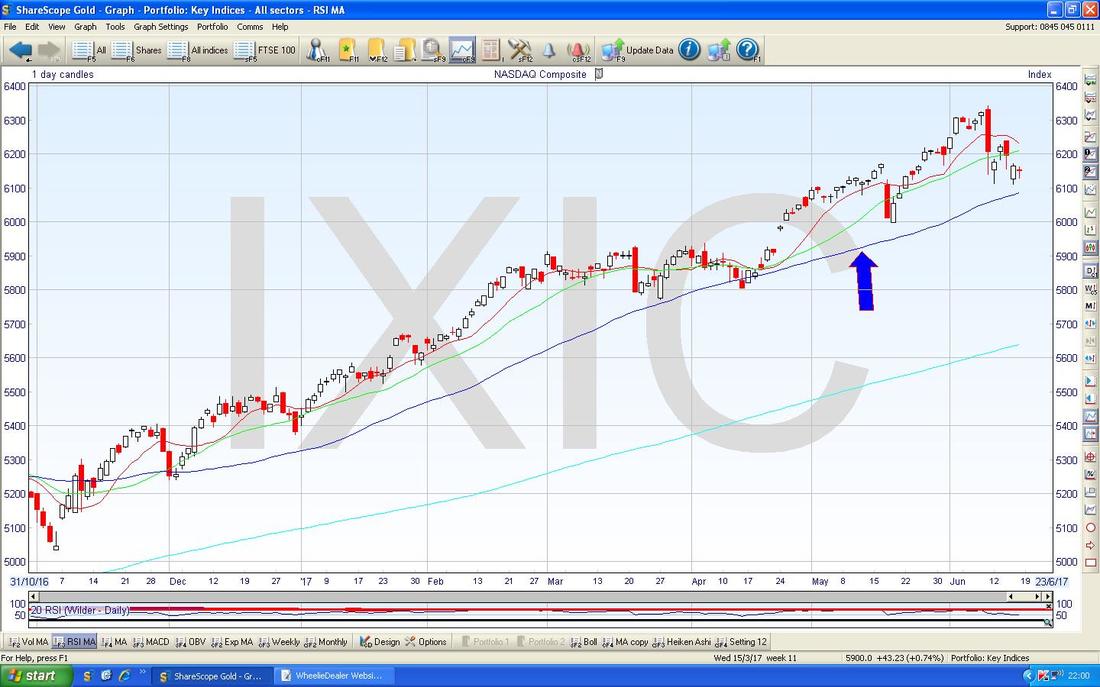
The Chart below shows how the 50 Day Moving Average (marked with my Blue Arrow) has acted as Support for many Months - it is important that this continues to be the case.
Brent Oil (Spot)
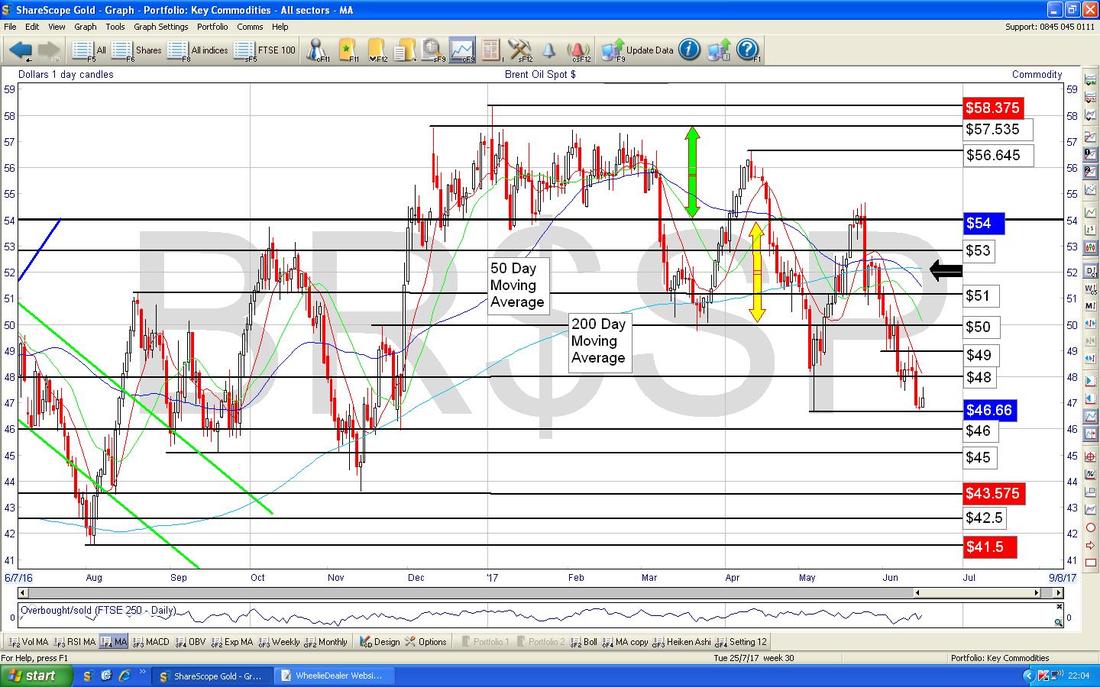
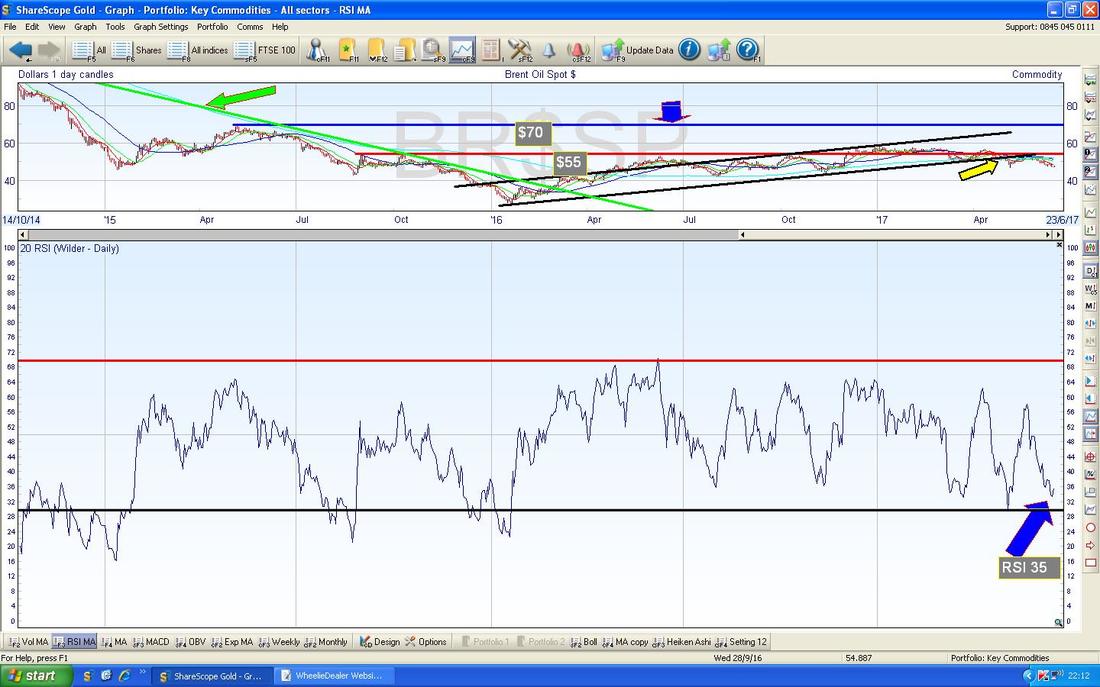
Oil has been really weak for ages now and the 50/200 Day MA ‘Death Cross’ recently (marked with my Black Arrow) is a dominant negative feature. After such a sustained move down you would expect some sort of bounce - but up above there is a lot of Resistance particularly at the $50 area. On the way down, there is Support immediately at just over $46 and then at $45, $43.575 and $41.5.
In the bottom Window on the Screen below we have the RSI (Relative Strength Index) for Brent Oil (Spot) Daily - on a reading of RSI 35 it is pretty low.
Gold (Spot)
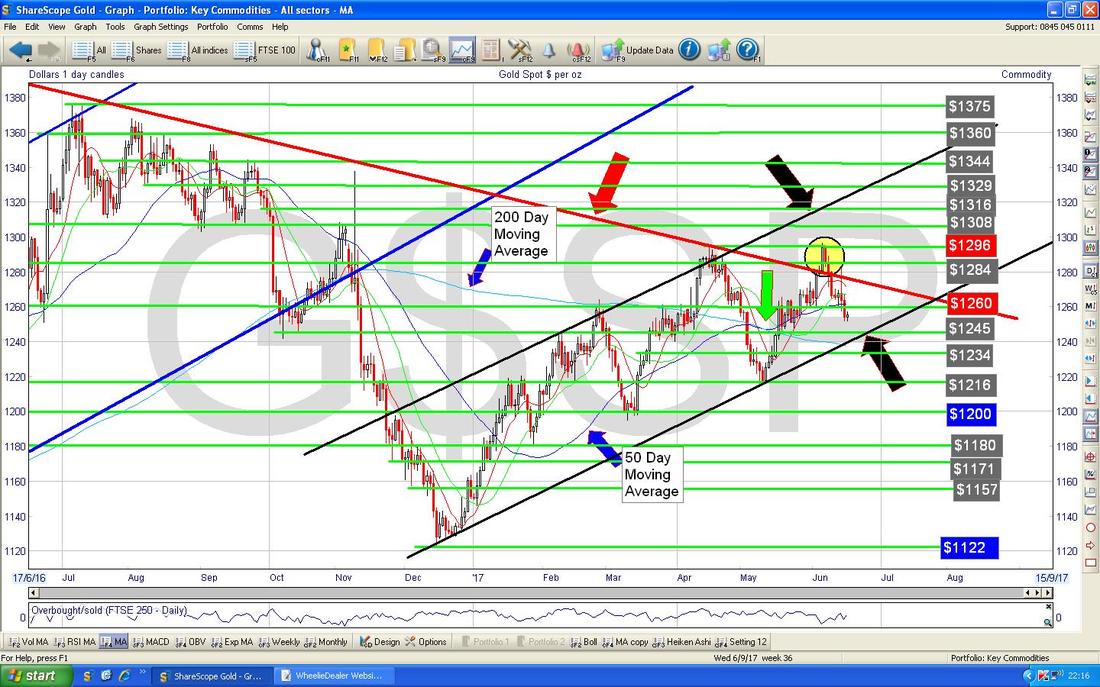
As per my recent Updates, the key thing here is that Long Term Red Downtrend Line which is shown on the Chart below with my Red Arrow. Where my Yellow Circle is, Gold (Spot) broke-out of that line but this was a ‘False Breakout’ and it fell back inside - which is not so good. However, for the Gold Bugs there is still some hope - firstly the Bullish ‘Golden Cross’ between the 50 and 200 Day Moving Averages (as marked by my Green Arrow) and then by the Black Lines (marked with the Black Arrows) which seem to form a decent Uptrend Channel - if this can hold, then it will take the Gold Price up over the Red Downtrend Line in time. OK, that’s it, go and brush up on your ‘History of Marxist Revolutions’……. Cheers, WD.
0 Comments
Leave a Reply. |
'Educational' WheelieBlogsWelcome to my Educational Blog Page - I have another 'Stocks & Markets' Blog Page which you can access via a Button on the top of the Homepage. Archives
May 2024
Categories
All
Please see the Full Range of Book Ideas in Wheelie's Bookshop.
|


