

|
educational blogs |
|
THIS IS NOT A TIP. I AM NOT A TIPSTER. PLEASE DO YOUR OWN RESEARCH. PLEASE READ THE DISCLAIMER ON THE HOME PAGE OF MY WEBSITES.
On Friday 27th March I picked up some more Utilitywise UTW to add to my Collection, at about 206p. I also did a Long Spreadbet at 213.28p this morning after writing a draft of this Blog and realising how undervalued it appears to be. This is a quick dig into the reasons why I like UTW and the timing issues around the buys.
Company Overview
As I understand it, UTW is an Energy and Water Consultancy which in effect offers Outsourcing of these Utility Functions for Businesses, with a focus on SMEs (Small & Medium Sized Enterprises). They provide the following Services among others which are covered further down:
This is driven mainly from a Phone based approach using a fairly Hard Sell from what I can tell !! The Business has been in existence since 2006 and started with 4 staff and now has over 860, offering Services in UK, France, Germany and Republic of Ireland. The European stuff is fairly recent and is in its initial stages, but appears to be going ok. Much of the growth has been organic, but they have also done 3 sizeable ’bolt-on’ Acquisitions in recent years. Due to the nature of how they sign up New Business, they tend to have good visibility of earnings going forward - this arises because lots of Contracts get signed up but don’t actually go ‘Live’ on their System. In previous years, this has been as much as half of Full Year revenues. For time reasons, I have copied the text underneath from the Company’s recent Trading Update: “Utilitywise is a leading independent utility cost management consultancy based in North Tyneside. The Group has established trading relationships with a number of major UK energy suppliers and provides services to its customers designed to assist them in achieving better value out of their energy contracts, reduced energy consumption and lower carbon footprint. Businesses large and small rely on Utilitywise for their energy management needs. Clients range in size from single site SME's to multinationals with thousands of sites and cover the whole of the UK. In total, Utilitywise has over 22,000 customers and manages an overall energy consumption of approaching 20 terra watt hours per annum.” From their Website: “Utilitywise is one of the UK’s leading business energy and water consultancies. We help businesses get the most value from their energy and water contracts, reduce their energy and water consumption, and lower their carbon footprint. Thousands of businesses of all sizes rely on us for their energy and water management needs, whether at one site or across the UK. We have access to prices from major gas and electricity suppliers in the UK, allowing us to find an energy price for your business and removing the hassle of dealing with your energy account. We also work to reduce your energy consumption with a range of products and services that can identify where, when and how you are using energy and water and identify what can be done to lower it. Our products include:
Utilitywise is passionate about helping businesses of all sizes reduce their energy and water consumption and lower their carbon footprint. Even if you have already entered into an energy contract we can still help you reduce your consumption.” The complete Range of Products and Services can be found on the Company’s Website here: http://www.utilitywise.com/products-services-2/ It is my understanding that UTW effectively ‘passes through’ Energy and Water Charges - so they do not have the Risk of any Price Fixing or Price Changes from the Utility Providers. They negotiate Rates on behalf of the Businesses they serve, but the risk of Price Changes lies with the Supplier with Fixed Term Contracts. The Company is AIM listed and the NOMAD is finnCap Ltd, 60 New Broad Street, London, EC2M 1JJ. The current Market Capitalisation is about £160m. Latest Trading Update The Trading Update on 13th February 2015 was taken very badly by the Market. The essence of the disappointment was that the Company focussed its Resources on renewing Contracts with Existing Customers as the fall in Energy Prices enabled UTW to help their Customers by taking advantage and locking in these Lower Prices. This Short Term change of Strategy had not been flagged to the Market before and the worry was that they would fail to meet their Growth Numbers for New Customers and particularly the ’Backlog’ of New Contracts to go on the System - however, the Directors clearly stated that they would meet expectations. To me, it seems like a panic over nothing, and it has enabled me to pick up a nice chunk of stock at a very good price. Note that Geoff Thompson, the CEO, was buying Stock that day. This is what he said in the Trading Update: "During the period we seized a unique opportunity to lock in significant future revenues, profits and cashflows whilst providing our customers with long term price security. Going forward, our efforts will revert to focusing on the acquisition of new customers in our highly fragmented target markets. We expect to report a significant increase in both revenue and profits for the full year in line with previous expectations." Directors I have pasted below the Key Directors from the Website. For the full list, please click this link: http://www.utilitywise.com/investor-relations/board-members-committees/
Director Shareholdings The List below was last updated: 09/10/14:
Note that Geoff Thompson bought 256,000 shares at 198.21p on 13th February after the Trading Update and was also buying in January. Significant shareholders (above 3%) The List below was last updated 09/10/14, however, please note that Neil Woodford now has a 21% holding - he was topping up AFTER the disappointing Trading Update:
Risks
Valuation From the ShareScope Screenshot I have stuck in below, you can see that for 2015 the Forecast EPS (Earnings per Share) is 18.15p. On my Buy Price of 206p, this gives a forward p/e multiple of 11.3 for this year. On Forecast EPS of 25.80p for 2016, on my Buy Price of 206p this gives a forward p/e of 8.0. I had a quick look at the Balance Sheet and the figures of £9.8m of Net Assets (this shows as a negative figure next to ‘Net Debt’ on the ShareScope Screenshot) and there is £15.8m of Cash on the Balance Sheet from 31st July 2014. It is a standard approach to strip the Cash out and calculate the p/e - this would give a p/e for 2016 of about 7.2. These are seriously Low p/e ratings for such growth as this Company is expected to deliver. To illustrate this more, between 2014 and 2015, the Expected Growth Rate is 47%. The Growth Rate between 2015 and 2016 is expected to be 42%. If I assume a Growth Rate of 40%, then based on the Forward p/e for this Coming Financial Year, 2015, of 11.3, then the PEG (Price Earnings Ratio divided by the Growth Rate) is 0.28 - this is insanely cheap and must be one of the lowest numbers you will find on the Market. Anything below 1.0 is generally regarded as Cheap……….. 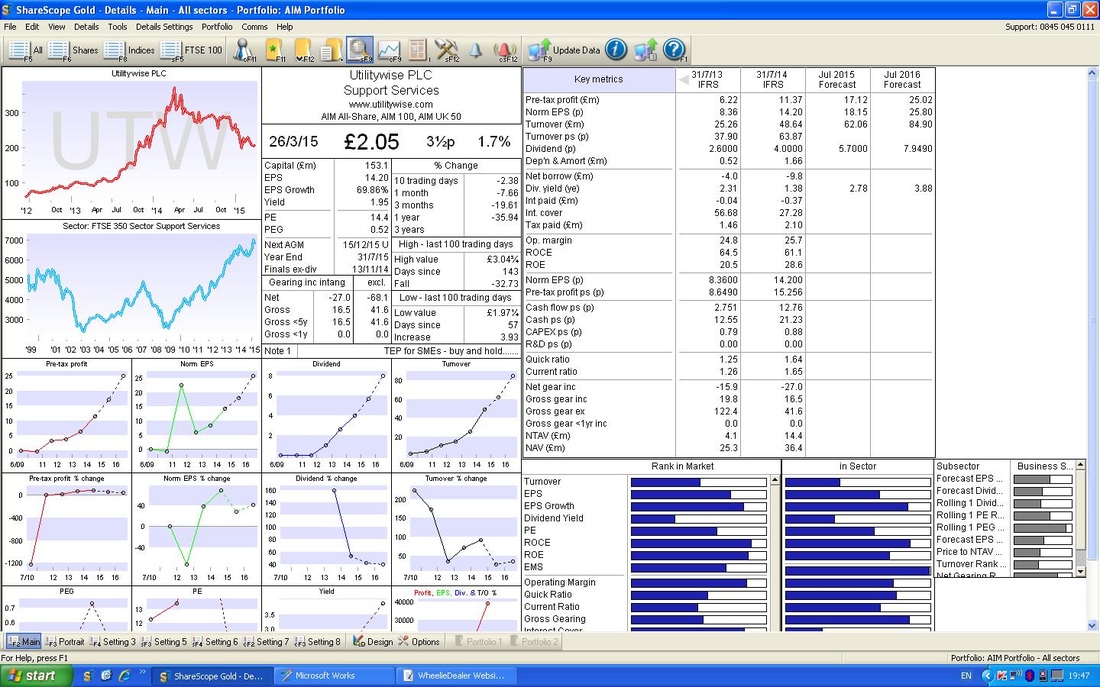
Not only is it cheap on usual Valuation methods, but I should also pick up a good Dividend. For this Year 2015, the Dividend is Forecast to be 5.7p. Based on my first Buy Price of 206p, that gives a Dividend Yield of 2.8%.
For 2016, the Forecast is 7.9490p (god knows how they get such an imprecise number !!), which gives a fairly juicy 3.9% Yield on my 206p Buy Price. Target I see no reason why a Stock like this could not hit a p/e of 18 going forward. On the basis of 25.80p of EPS for 2016, this would give a Target of about 465p. This would be 126% upside on my Buy Price of 206p. OK, let’s stretch it a bit. If the Company was to maintain such a high growth rate, it seems reasonable that the Stock could command a p/e of 22 - on this basis, the Target Price would be 565p. This is 175% up on my Buy Price of 206p. This is a strong Target and would be hard, but it is foreseeable without too much imagination in a few years. If we look at the PEG ratio - it is entirely feasible for the PEG to hit 1.0 - this is normal for a Growth Stock - often the PEG can be much higher. On this basis, the Target Price would be over 600p. It is not difficult to imagine a scenario in a few years where UTW is producing EPS of 40p. If you put that on a p/e multiple of 20, you get 800p. It sounds fanciful but I think it is possible - they have been going for 9 years and so far have not put a foot wrong. As a comparison, Smart Metering Systems (SMS) is on a p/e for this year of 27 and has a Dividend Yield of 0.71 at a Price of 355p. It also has a chunk of Debt. Energy Assets Group (EAG) is on a p/e of 17 for this year and has a Dividend Yield of ZERO. It also has a big chunk of Debt. UTW looks excellent Value considered up against these 2 similar businesses. However, life is never so simple, unfortunately. The Big Mammoth in the Cave Corner here is a Huge Point of Resistance on the Price Chart. This occurs at 370p which is the All Time High that was hit in about March 2014. I think this Level will act as a difficult Barrier for the Stock, and maybe I will TopChop my holdings if and when it gets up to that point. As a minimum, I will reassess the Valuation and stuff at this point and decide on appropriate action (I hope). It’s worth noting that at 370p the p/e would still only be 14 - not excessive by any means. Technicals As ever, I apply the same Technical Analysis (TA) Techniques and Indicators to everything I look at - be it a Stock, an Index, a Metal, a Pork Belly, a Currency, whatever. So regular Readers will be used to the sequence in which I go through these Charts. Please note, these Charts are all from the Thursday Night (26th March 2015) when I made the Decision to Buy on Friday morning - it is my regular approach to make all Trading Decisions outside of normal Market Hours - I find this cuts out a lot of the Emotion that can negatively bias decisions made in the hustle and bustle. This means that you are looking at the same Charts that confronted me when I made my Decision to Buy on Thursday Night. Firstly, on the Chart below, we look at the ‘Big Picture’ - with a fairly long Timescale going back just under 2 years - but this shows the key Technical Picture that is relevant here. You will see the lovely Uptrend from mid 2013 to early 2014 - which I have marked with Green Channel Lines - I actually caught a lot of this Uptrend with some of my First Buys and I managed to Topslice fairly soon after the peak. But I kept a chunk and have been patiently waiting for a chance to buy in again and build up my Holding again. 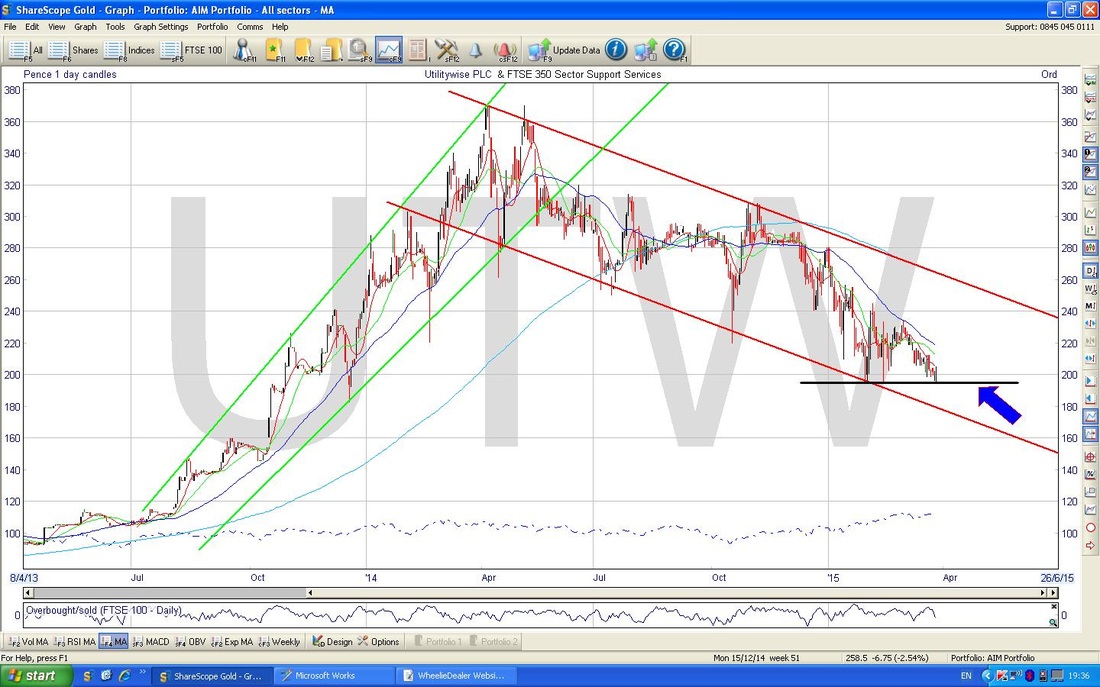
The next important feature here is the Downtrend that started in about April 2014 and continues to this day. I have marked the Downtrend Channel with the Red Lines. Note, these is a big Danger here to my Buy - Downtrends have a horrible habit of continuing much longer than they should do (Uptrends can do this also, which is great if you are in the Stock) - however, I have taken a chance here and arguably bought in a bit early - but this is because Results are due on the 21st April and I expect the Price to run up prior to these. In addition, the Stock is just plain cheap on a Valuation basis, as I have outlined above.
The next thing of importance here is marked by the Horizontal Black Line at about 200p ish which I have pointed out with the Blue Arrow. The key thing here (which you can see better on the next Chart) is that the Price has gone down to this level 4 times and moved up - it is building a good base of Support. On the Chart Below, you should see a Shorter Term set of Daily Candlesticks which clearly show the Support Level at 200p and the 4 touches. I have pointed to a sort of Hammer Candle with the Black Arrow - this is by no means a Textbook Example, but it suggests that after a lot of downwards movement there has been an Intraday Reversal where Bears were in Control for much of the Day but the Bulls took command and drove the Price up by the End of the Day. These kind of Reversals are a superb Indication that the Trend might be changing. Ideally, you would want a cleaner down move before the Hammer - a bit of Poetic Licence is needed. 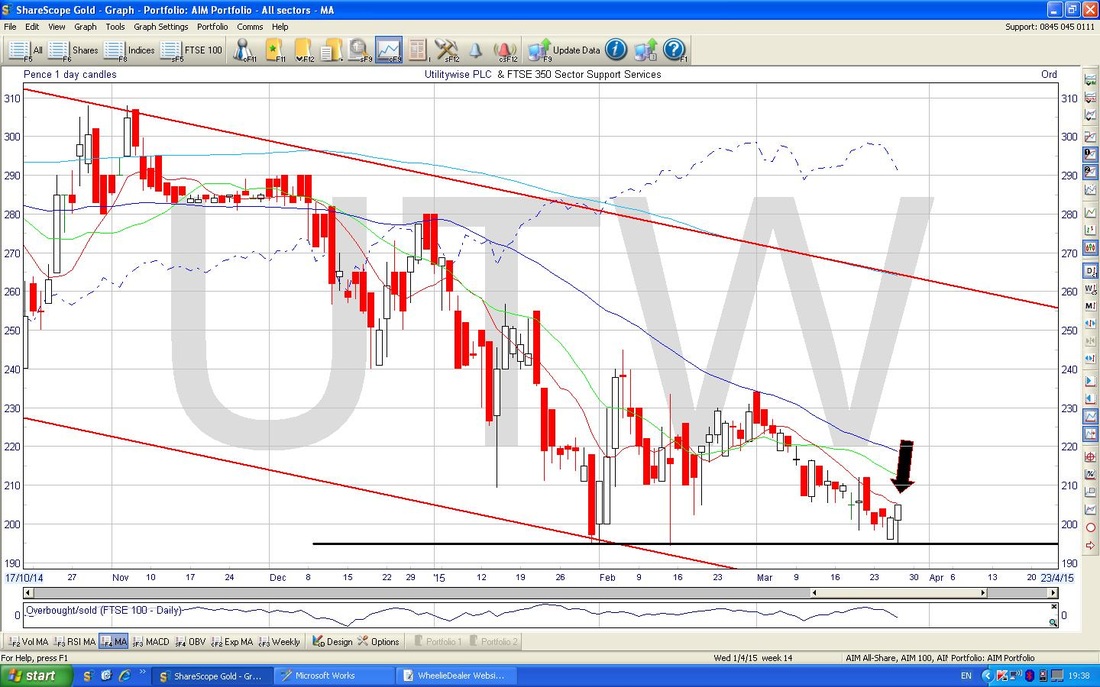
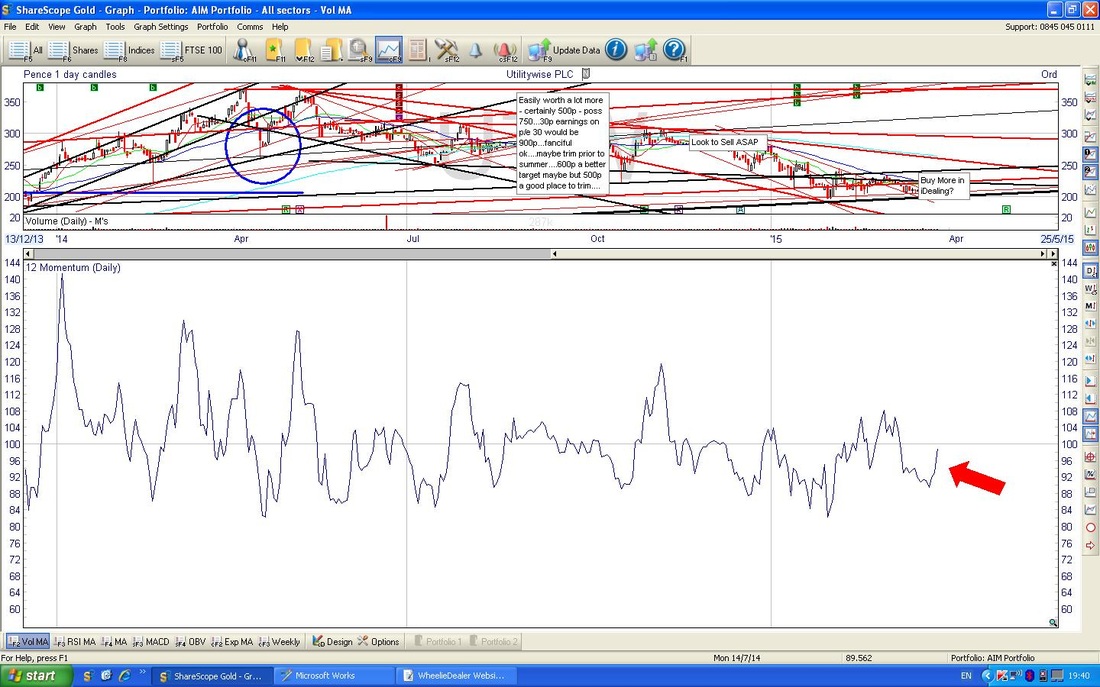
Ignore the cr*p in the Upper Window on the Chart below, but in the Bottom Window you can see the Momentum Indicator. The Red Arrow points to where the MI has turned up from a Low Level where it usually tends to reverse.
In the Upper Window below, I have marked a Triangle Pattern that has formed - the rule with any Triangle is that when the Price breaks out of one of the Lines, it tends to move more in that direction. So, in this case, I am hoping for the Price to break up through the Upper Line that I have marked with a Red Arrow, and not to break down through the Horizontal Line at the bottom, which I have marked with a Black Arrow. Proper Traders would wait for the Breakout, but as I mentioned above, as a Long Term Investor I am happy to get in early.
The Bottom Window shows the RSI (Relative Strength Index). The Green Arrow points to where the RSI has ‘flicked up’ - this is a good sign that the Price wants to rise. The Blue Arrow points to a Line which shows a ‘Bullish RSI Divergence’ - this is also a great sign that the Price is likely to move up. The Divergence arises because the RSI is sort of trending up although the Price Line is sort of Flat or Downwards - so these are Diverging. 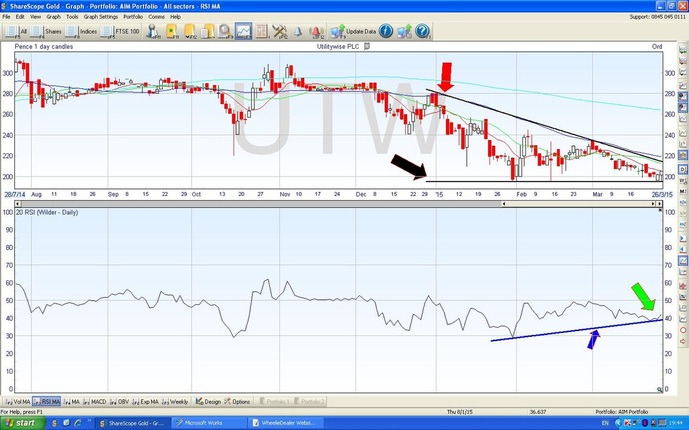
The Chart below shows the Bollinger Bands in the Upper Window. My Black Arrow points to where the Price Candles have started to move away from the Bottom Bollinger Band - it is a bit early to be sure at this stage really.
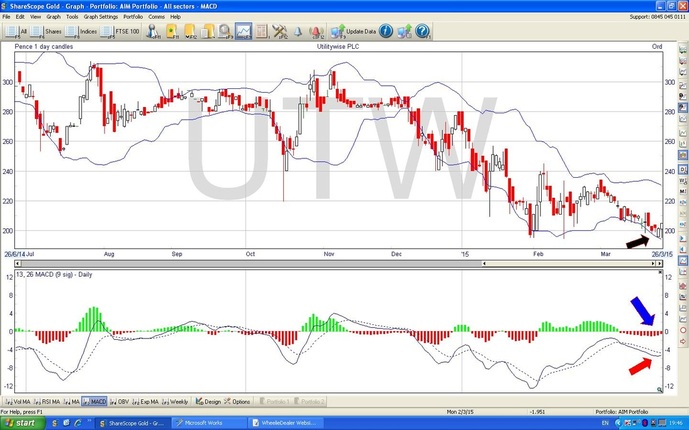
In the Bottom Window, you can see the MACD (Moving Average Convergence Divergence). The Blue Arrow shows where the Red Histograms are starting to curl up - if you look to the Left on the Chart, you will see how these Histograms tend to form ‘humps’ - with luck, it will soon turn Bullish (the Histograms will go green).
The Red Arrow shows where the Solid Blue MACD Line is about to cross the Dotted MACD ‘Signal’ Line - this is just a different representation of the Histograms - I like to use both as it is clearer. The Chart below shows the Weekly Candles. It is a bit early, but we were at Thursday so it was nearly a valid approach (just one day to go for the full week) - where I have put the Blue Arrow we have a lovely Hammer Candle forming - this is a superb and reliable Reversal Indicator which suggests the Price wants to move up. 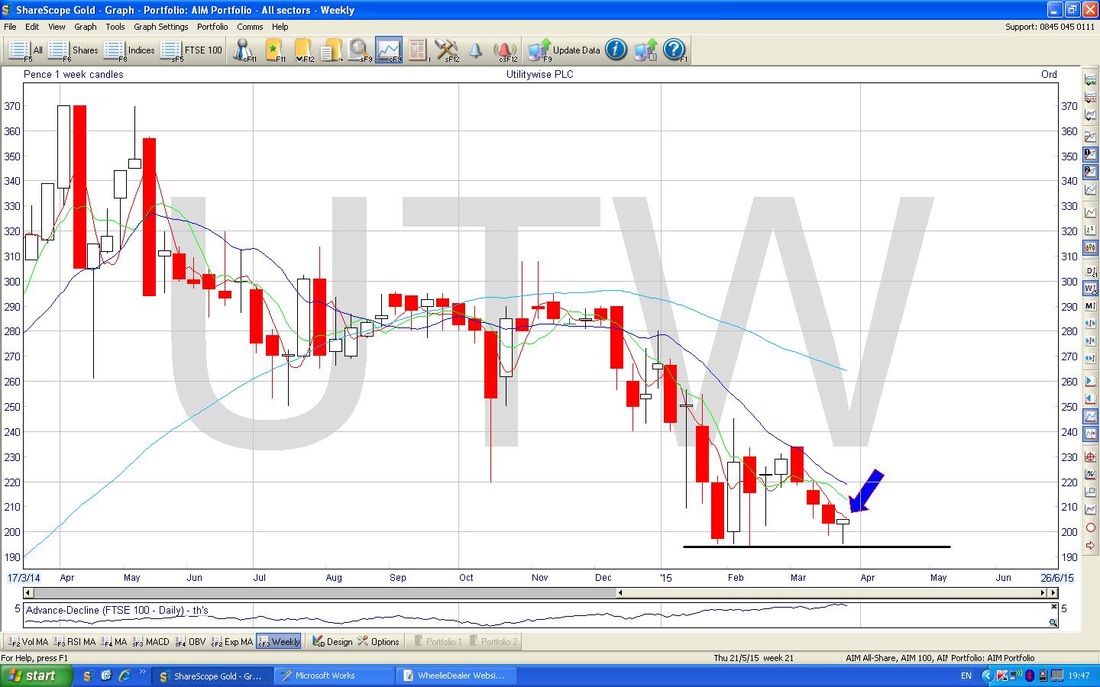
Conclusion
I have high hopes here on UTW - it looks extremely cheap and the Charts suggest that it has found a bottom. I expect to hold it for a Long Time and to receive some tasty and rising dividends on the way. The weakness since last April has been rather strange - I expect it got caught up in the general AIM and Small Cap stocks sell off and once a Stock gets into a Downtrend Channel, it can often overshoot - I suspect this has happened here. Some weak Holders who don’t really understand the Business might have jumped out with fears over a Labour Government and Price Controls on Energy - but this will only apply to Residential Customers. The points that really standout for me are as follows:
Better get my Lucky Bunny Foot out (can’t be all that lucky, as the Rabbit clearly didn’t do too well out of it). hyvää iltaa, wd
5 Comments
SmallCaps
30/3/2015 12:54:31 pm
Wheelie
WheelieD
31/3/2015 01:57:16 pm
Hi SmallCappy, thanks for the Inputs - very useful background info on the Business Models. Let's hope it goes nicely for us all.
Gaj
31/3/2015 12:14:22 am
Fantastic post, your blog has been added to my favs. I'm also a big investor in UTW and love the way you've broken down all your analysis.
WheelieD
31/3/2015 02:00:43 pm
Hi Gaj, thank you for the encouraging comments - great to know that some people find this useful. I tend to use this kind of structure for my Company blogs - if you click on 'Stock Buy Rationale' you should find some others. If you are on Twitter, then you might like to follow me @wheeliedealer as there is a lot of nonsense coming out from me there also. If you are not in the Twitterati, then the Feeds on the front page of my Websites gives you the same stuff.
MarkO
1/4/2015 07:43:37 am
I am a holder of this stock and it has done well for me so far but I think it is worth highlighting an additional risk I see with the business model. This stops me from going too wild. Leave a Reply. |
'Educational' WheelieBlogsWelcome to my Educational Blog Page - I have another 'Stocks & Markets' Blog Page which you can access via a Button on the top of the Homepage. Archives
May 2024
Categories
All
Please see the Full Range of Book Ideas in Wheelie's Bookshop.
|
