

|
educational blogs |
|
I am running late as usual - today I will blame the ridiculous amount of Bike Racing on TV and of course this had to be watched. As a result, I will mostly look at the Weekly and Monthly ‘Big Picture’ stuff but with the main focus probably shifting to the US Presidential Scrum it is most likely that this will be a dominating factor over the next couple of weeks. Funnily enough, the more detailed Daily Charts and short term Indicators are not really telling me much anyway - this has been the case for a couple of weeks now with things being very ‘neutral’.
As I understand it we are about 9 days from the Vote now - with the shock revelations on Friday night that Hillary Clinton is being investigated by the FBI again it seems highly likely that the already tight gap between the Candidates will close up and it is very possible that Trump can win. As I have mentioned many times, I think Clinton is the ‘Status Quo’ Candidate and the Markets would like this more than a Trump victory - we got a view of this with how the US Stockmarkets fell sharply after the News on Friday night and the US Dollar fell along side this. As I have mentioned elsewhere, I am very sceptical about the Polls mainly because they are based on absurdly low Sample Sizes - I suspect this is the real reason that Polls have failed to accurately predict Results in pretty much every Major Election that has been held in recent years.
Later this week we have the US Non-Farm Payroll Numbers on Friday and I read somewhere that the Expectation is for around 200k Jobs to have been created - perhaps if a number comes in which is massively lower than this then the pencilled-in Rate Hike for December by the Fed might get binned. Otherwise the Rate Hike looks pretty much nailed-on and I suspect this will be an additional pressure on Stockmarkets in coming Weeks - more negatives just when the markets are looking very fully valued.
We are in a weird situation now where because of the UK Clock Change the US Markets now open at 1.30pm our time rather than 2.30pm - but this only lasts for a week I think. November Market According to the UK Stockmarket Almanac 2016, since 1984 the FTSE100 has been up for 58% of years with an Average Return of 0.7% - which makes it the 6th Best Month. However, since 2006 the trend has softened - with the Market only rising for 3 times in the last 9 years. The Almanac makes an important point that November marks the start of the best 6 month period for Markets - so this is a time to be looking to increase Exposures. The last 7 days of November tend to be quite strong. There is a lot of sense to the Seasonal Effect of being heavily invested over Winter but less so over Summer, however, for myself, with the US Election in the immediate Crosshairs, I would suggest it might be better to wait a bit before piling in. The Coming Week For next Week (w/c 31st October 2016), the FTSE100 tends to be Up for 61% of Years with an Average Return of 0.7% according to the Almanac. S&P500 Most of the fun will probably be concentrated around the US for the next couple of Weeks so I will start with how the US Indexes are shaping up. As usual I am using the excellent ShareScope Software for all the Charts and just doing Screen Scrapes. If you click on the Charts they should grow much bigger and be easier to see on your Screen. The Chart below shows the Weekly Candles for the S&P500 going back about 8 Months. First off my Black Arrow is pointing to how the Darker Blue Wiggly Line which is the 50 Day Moving Average is pointing downwards. Next, my Green Arrow is pointing to a Big Red Down Candle which was generated Last Week and is a ‘Bearish Engulfing’ because it ‘Engulfs’ the Small White Doji Candle from the Week prior to this. Obviously such a Nasty Candle is not good going forwards. There are some important Support Levels to watch here - firstly 2120 which was the Low point Last Week and next up it is around 2111 which was previously Resistance from back in the Spring of 2016 - this Resistance should act as Support now - it will be interesting to see if it can with the Headwinds from the Presidential Punch-up blowing hard. I would say that 2111 Level is very important - if it fails then we could go a lot lower. Up above on the Resistance side of things, the key challenge now is to get back over the 50 Day Moving Average - achieving this would be a good start on getting some upwards momentum. My Yellow Splodge is indicating 2 sort of ‘Narrow Body Dojis’ which turned out to be a ‘Pivot Point’ from which the Index has turned down - this is a great demonstration of the power of Candles to predict moves (if you are interested in learning more about Candles, then get yourself a copy of ‘Candlesticks for Dumbos’ from Wheelie’s Bookshop - it is a superb book in my view and pretty easy to understand.) 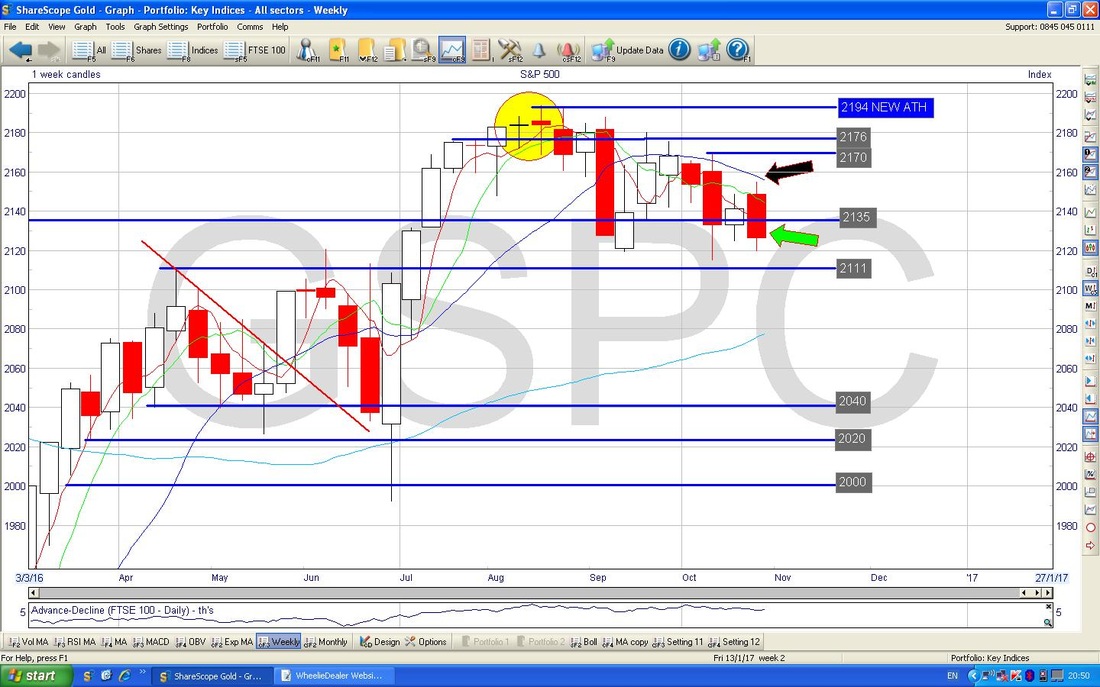
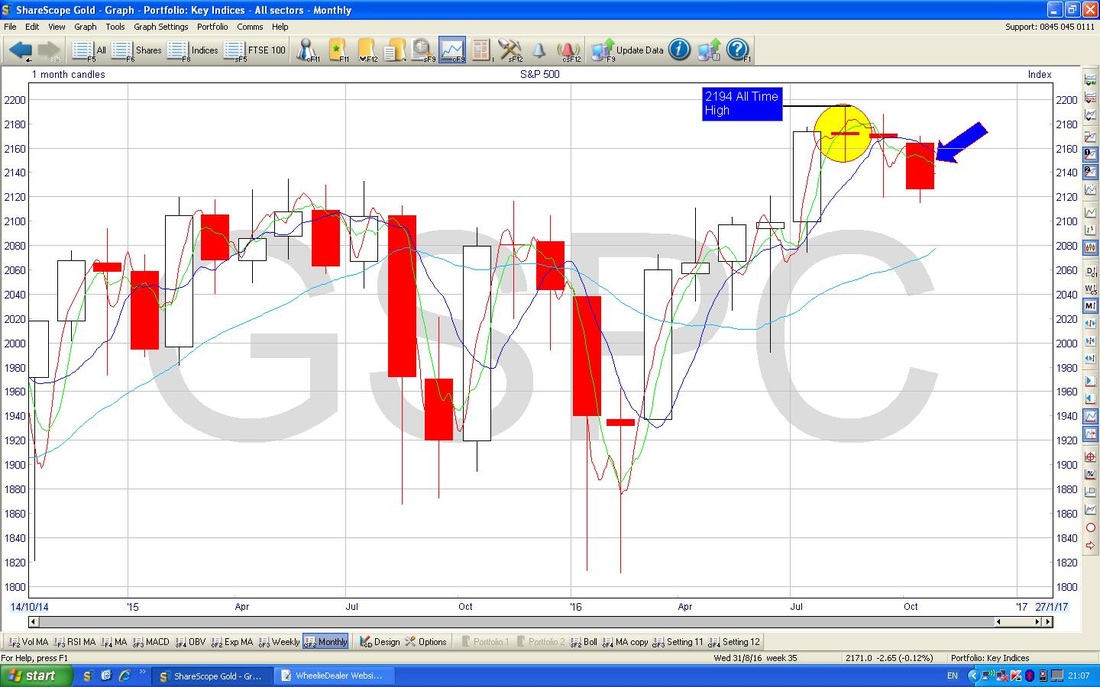
The Chart below has the Monthly Candles for the S&P500 going back slightly over 2016 so far. My Blue Arrow is pointing to a Big Ugly Down Candle which has so far been created for October - unless we have a miraculously Strong day tomorrow (Monday 31st October) then this looks a pretty poor set-up going forward. My Yellow Circle is highlighting the ‘Narrow Body Doji’ which was created for August and, as it should do, it accurately predicted a turn down in September and October. We now need a Reversal Candle of some sort over November if we are to make headway for the rest of the year (we will need to see perhaps a Hammer Candle or an Up Candle which would form a ‘Bullish Harami’ 2-month pattern with the one from October).
Nasdaq 100
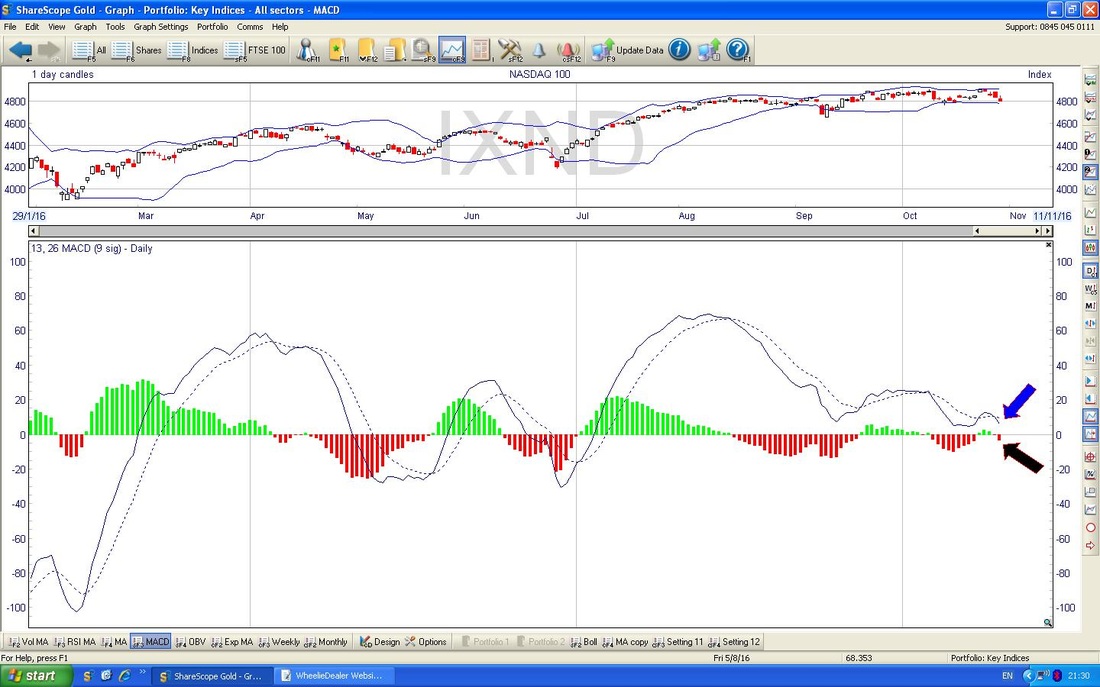
This is a US Tech Index - it is not the Nasdaq Composite Index - it is just the top 100 Tech Companies in the US by Market Capitalisation - I choose to follow it because this is the only Index igIndex enable me to Spreadbet on. In practice its moves are pretty similar to the Nasdaq Comp. I currently have a Short Position on this Index. The Chart below has the Weekly Candles for the Nasdaq 100 going back about 8 Months. My Black Arrow is pointing to another Ugly Red Down Candle - this suggests more falls ahead until we get some sort of Reversal Candle. When you think about it, this was quite a crazy Week just gone - at one point we made a New All Time High at 4912 but then we fell away. Support at around 4800 is important now and then at 4760. There is then Support around 4700 and then 4656. To the Upside, the Index needs to get over that All Time High at 4912. 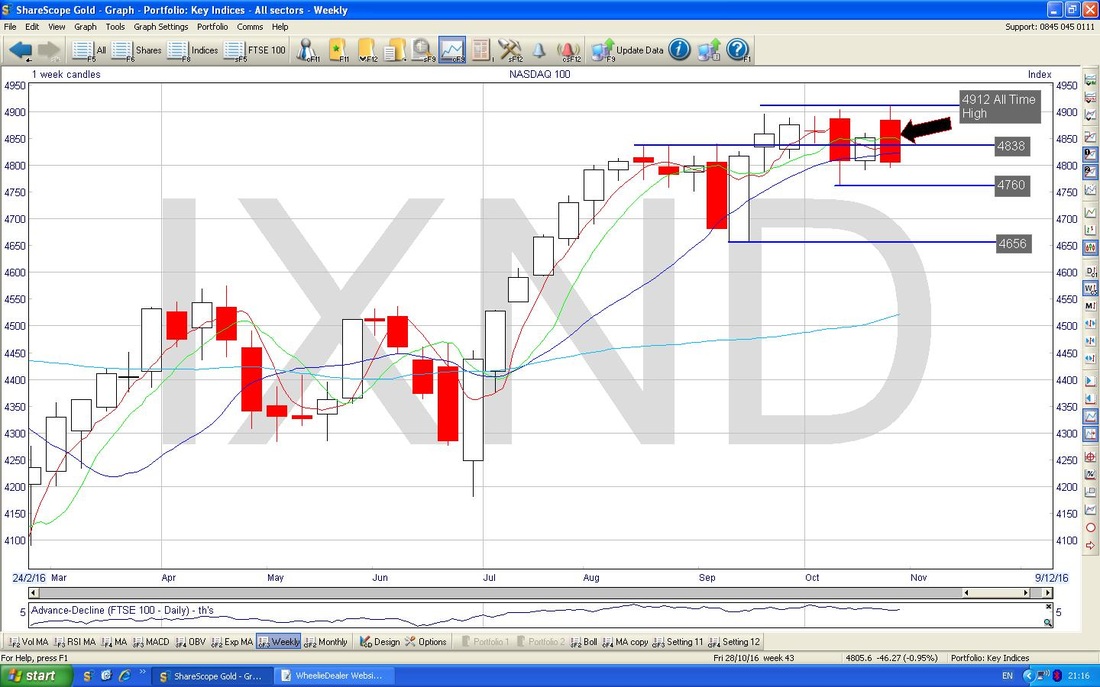
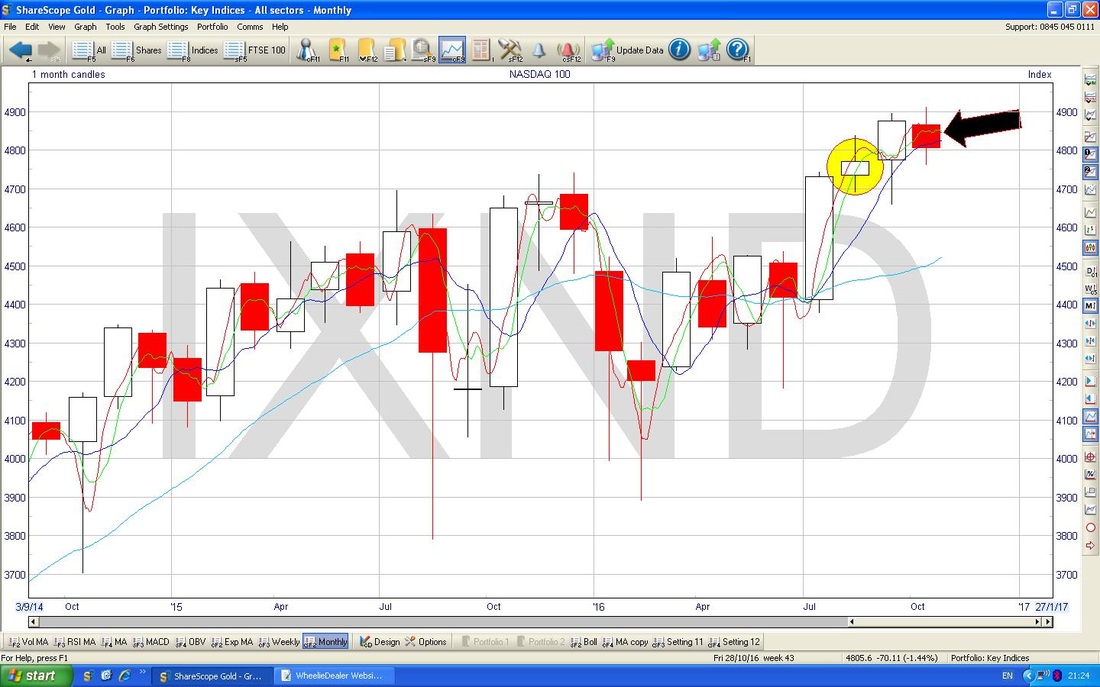
The Chart below has the Monthly Candles for the Nasdaq 100. First off notice the ‘Spinning Top’ Doji which was produced for August which is caught in my Yellow Circle. This was the first warning that the Uptrend was perhaps waning. My Black Arrow then shows the Candle for October - of course, if we have a stunning day to the Upside tomorrow, then this Candle might be negated - we shall see. If the Candle stays pretty much as it is, then we will get what I call a ‘Cotton Reel Doji’ - this could well be a Reversal Signal telling us that we could see some Down Months ahead. Fundamentally that would not surprise me - even if we avoid the disaster of a Trump Victory, we still end up with a terrible US President (who could well be drummed out of Office if the FBI Investigation goes against her) and we have the likely Rate Rise in December.
In the bottom window on the Chart below, we have the MACD (Moving Average Convergence Divergence) for the Nasdaq 100 Daily. My Blue and Black Arrows are pointing to the same thing which is a Bearish MACD Cross from Friday - the Black Arrow is showing it in Histogram Hump form whereas the Blue Arrow is using Signal Lines. Personally I find the Humps easier to read.
FTSE100
The FTSE100 has been a funny Bug*er lately as it seems to be largely driven by the £/$ rate and the Oil Price - this has made it pretty bad at following the usual Technical Analysis ‘Rules’ which is very unusual. Anyway, the Chart below has the Weekly Candles for the FTSE100 going back about a Year or so. My Yellow Circle is highlighting the Doji Candle which was created last week and this is the third Doji of a similar ilk in 3 weeks. This is really a story of Support and Resistance now - on the Support side it needs to stay above firstly 6898, then 6800 and just above 6700. On the Resistance side of things, if firstly needs to crack the High Point of last week which was 7067 and then it needs to charge on and take out the New All Time High at 7130. If you look at how the Price Candles are up near the Top of my Parallel Blue Lines which are marking some sort of Uptrend Channel, then it is quite possible that the Price moves Sideways from here or perhaps drops down - we shall see. 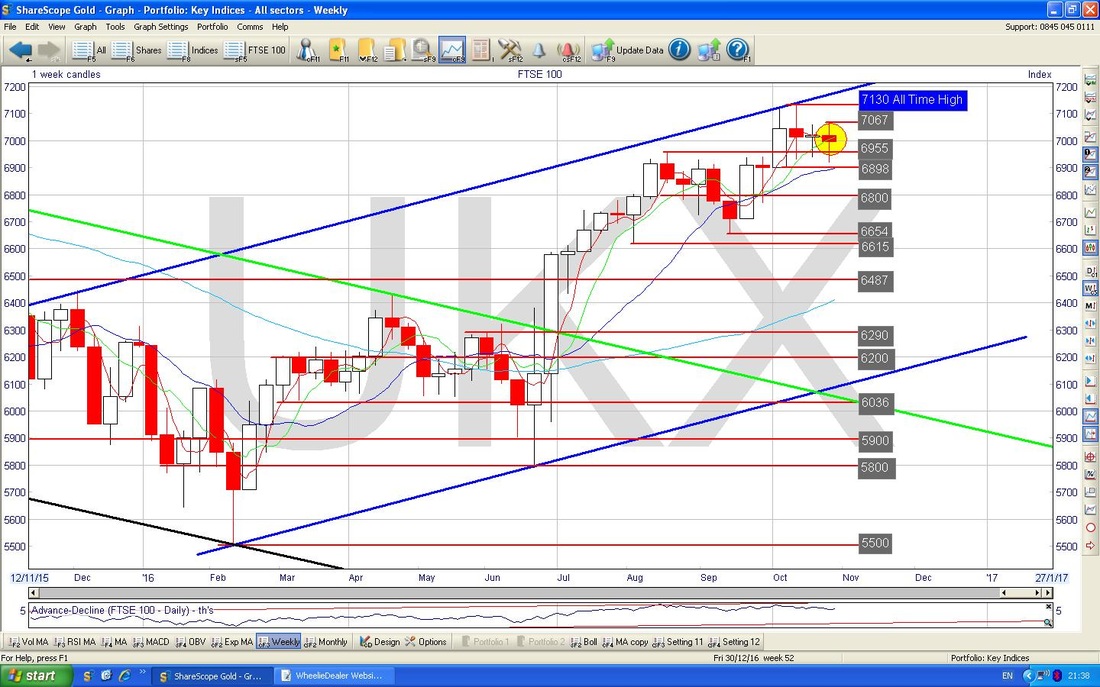
The Screen below has the Monthly Candles for the FTSE100 and my Yellow Circle is highlighting the ‘Inverted Hammer’ Candle which was created for October - unless of course we have a crazy day tomorrow. In the context of the run up over many many Months, this Inverted Hammer suggests a turning point and we could reverse downwards in coming Months.
My Blue Arrow is pointing to the ‘Wick’ or ‘Tail’ of the Inverted Hammer and combined with the White ‘Body’ of the Candle you should be able to imagine an Upside Down Hammer…….. 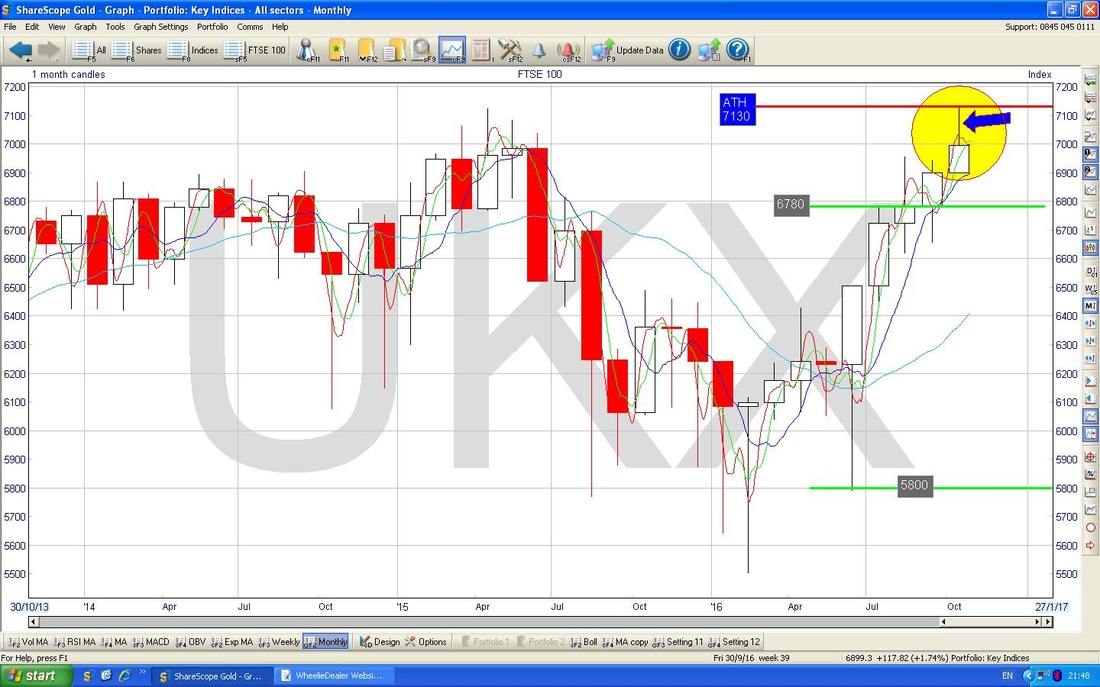
Pound vs. Dollar
The Chart below shows the £/$ going back a few months but with particular focus on the period since the big drop in early October. At the moment we seem to be going sideways with a Floor around 1.2083 and a Ceiling around 1.2333 - I have marked these with the Blue Text Boxes. My concern which I have mentioned a few times is that the Price could be forming a ‘Ledge’ where the Price has fallen dramatically and then gone Sideways to form the Ledge before it then falls a lot again - the only way we can avoid this is either by moving up above the 1.2333 Resistance Level pretty soon or by just going Sideways for an extended period of time and not actually dropping more - this perhaps might be possible. When you consider how far the £ has dropped (it has fallen around 30% since mid 2014) and also how a Trump Victory might weaken the $, perhaps we can avoid another leg down for the £. The Long Term Support level is around 1.05 which comes from back in 1985 I think. 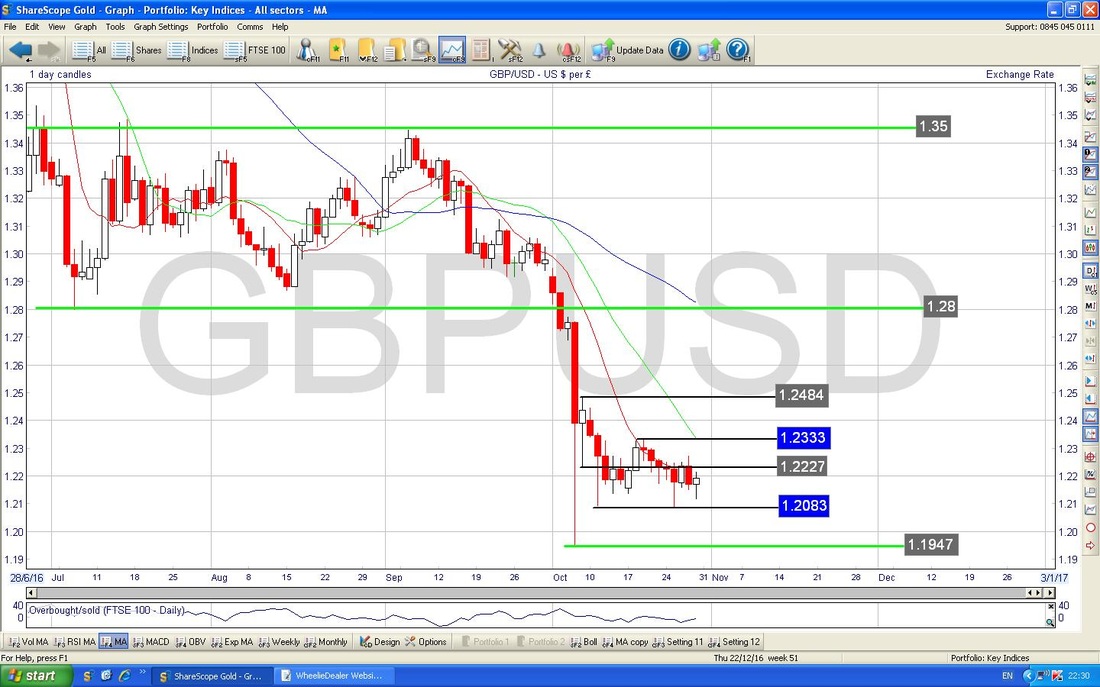
Brent Crude Oil (Spot)
The Chart below shows the Weekly Candles for Brent Crude Oil going back about 1.5 years. Note firstly the very clear Triangle Pattern which is formed between my Black Horizontal Line (marked with my Black Arrow) and the Green Upwards Sloping Line (marked with my Green Arrow) and it looks most likely that the Price will pop out of the Top as it is being squeezed by the Bottom Green Line. $54 is the Critical Resistance Line to get over and Support from the Green Line around $48 must hold. If we convincingly fall out of the Triangle below the Green Line, then that would suggest more falls down to maybe the low $40s. My Blue Arrow is pointing to a Big Red Down Candle which was created last week following the 2 Dojis in my Yellow Circle which are looking like they were Pivot Points for it to turn down from after the run up. 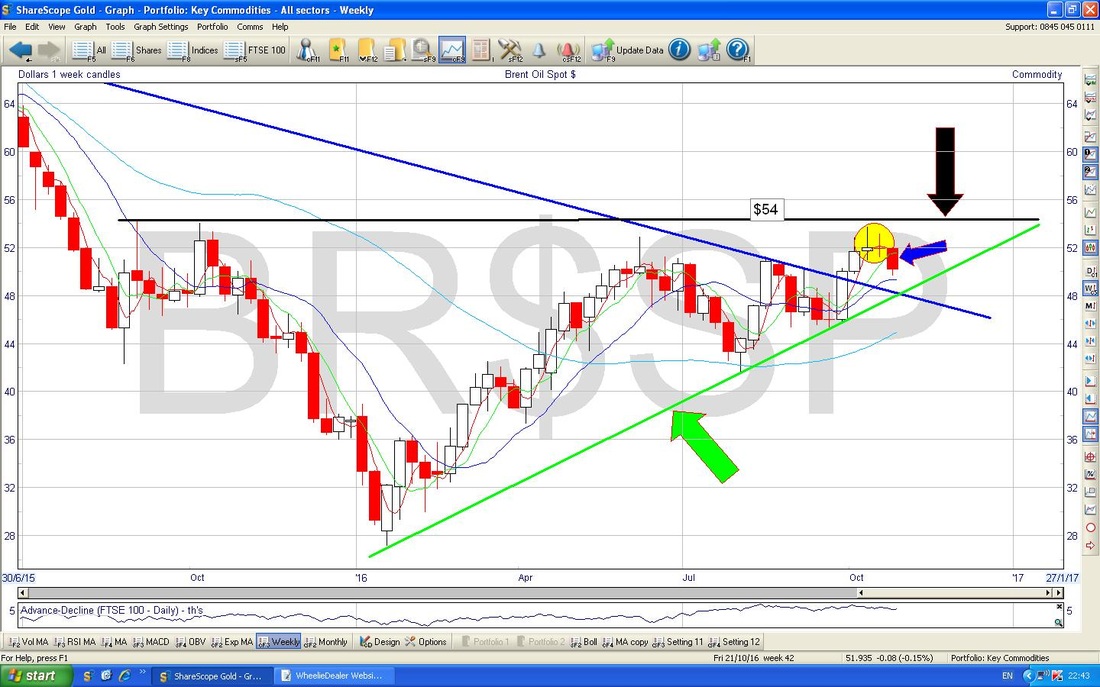
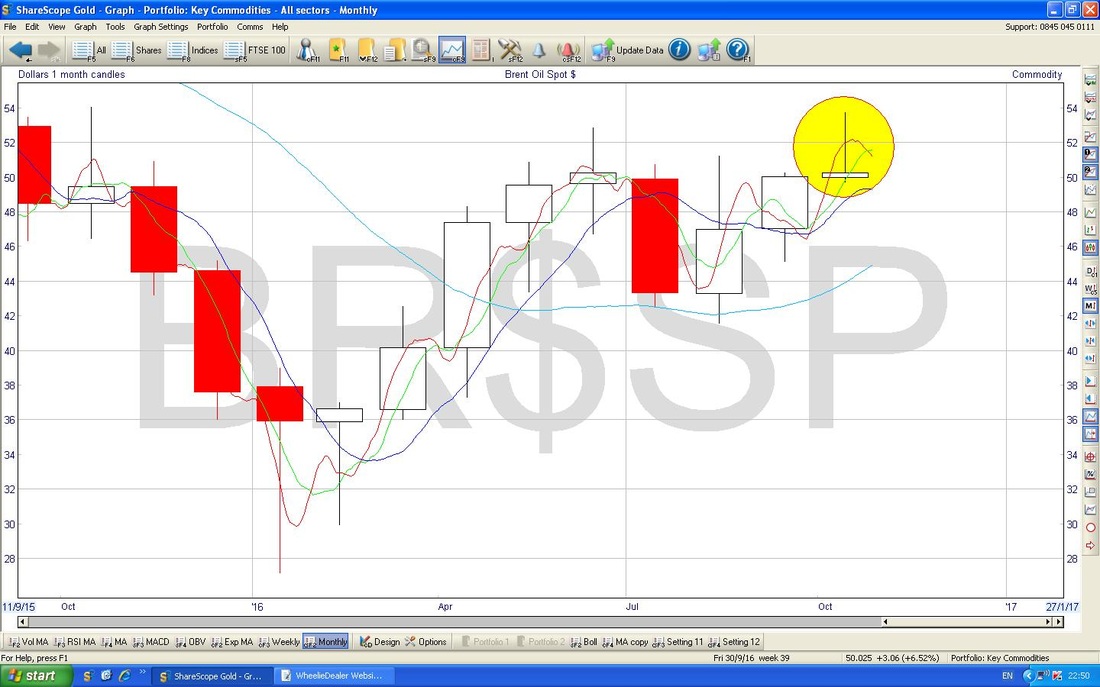
The Chart below has the Monthly Candles for Brent Oil going back just over about a year. My Yellow Circle is highlighting an Inverted Hammer Candle which has formed over October - unless something happens tomorrow, this suggests a Turning Point and we could see some Down Months going forwards now.
Gold (Spot)
The Screen below has the Gold Weekly Candles going back about 1.5 years. Note the Blue Arrow which is pointing to the Faint Blue 200 Day Moving Average Line and look at how the Price is hovering around this Line. On the flipside, look at my Black Arrow which is pointing to the Darker Blue Wavy Line which is the 50 Day Moving Average - note how it has turned down and is heading rapidly towards the 200 Day MA Line - if they cross over then we could have a ‘Death Cross’ which is obviously rather terminal. My Green Arrow is pointing to a small Doji Candle which was created Last Week - this shows a lack of direction and neither Bulls nor Bears being in control. In this context, I think we really need to focus on Support and Resistance to get a view of where things are going - firstly Support from $1240 and Resistance at $1277 - if Gold gets over this Resistance then expect it to go higher, and if the Support at $1240 fails then it will probably go lower. That’s it for this edition, good luck to all next week and keep your wig on and get your story straight just in case the FBI come knocking on your door !! Cheers, WD. 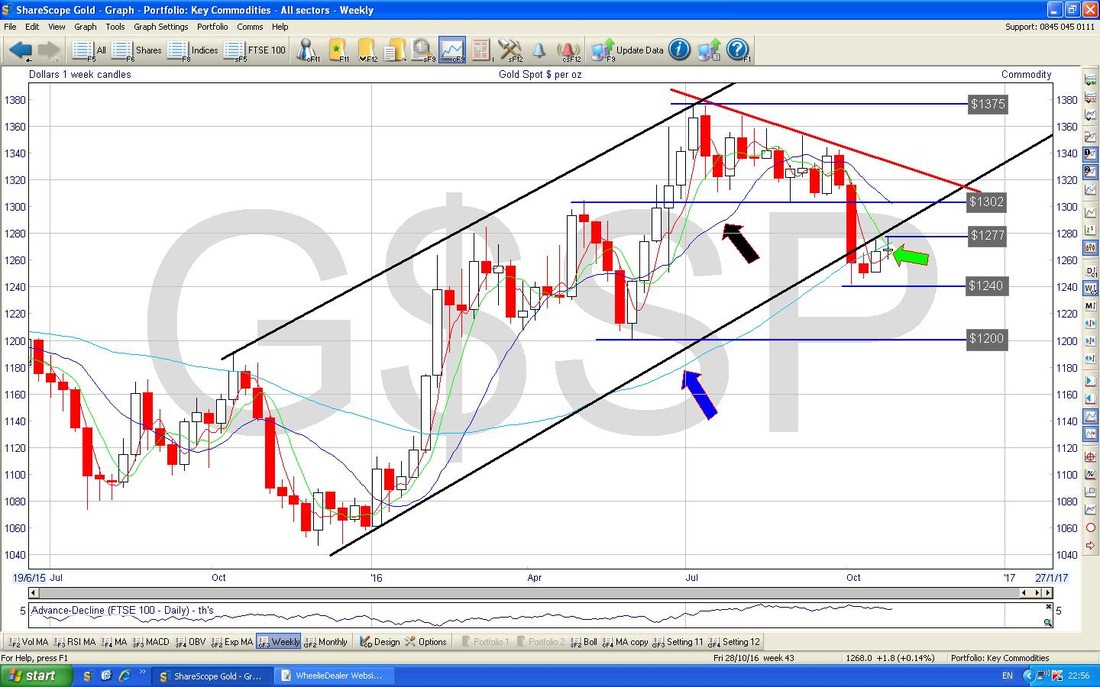
0 Comments
Leave a Reply. |
'Educational' WheelieBlogsWelcome to my Educational Blog Page - I have another 'Stocks & Markets' Blog Page which you can access via a Button on the top of the Homepage. Archives
May 2024
Categories
All
Please see the Full Range of Book Ideas in Wheelie's Bookshop.
|
