

|
educational blogs |
Those Who the Market seeks to Destroy it first drives Insane - Weekend Charts with TEP and DVO24/6/2018
As usual I am not sure how much time I can spend on this tonight as there is a round of the World Superbikes from Laguna Seca (with the infamous ’Corkscrew’) in the USA on Eurosport at about 9.30pm and tomorrow I am off to Duxford Aerodrome to meet up with a few people and I will be doing a fairly early start tomorrow (for me !!) and I don’t want too late a bedtime tonight !!
If you are reading this in time to join us at Duxford, near Cambridge, then feel free to come along and there are more details on my Homepage - I should get there about 12.30pm but of course you can turn up whenever you like and I will head straight to the Canteen bit for ‘refreshments’. Last Week The Title for this Blog comes from the crazy Market we had last week - it really was all over the place with no clear direction and it looks like we are into the Summer Soggy period and this could continue quite some time and of course the World Cup probably is distracting people and we then have Wimbledon not far away.
With all the chopping about my Portfolio was down 0.5% over the Week and I guess I am quite relaxed about this - it could easily have been far worse. There’s a lot to be said for setting a Portfolio up so that it is fairly resilient when Markets are lacking any clear direction but to also be ready for when things pick up and Markets are more friendly. With this in mind I can’t see my Strategy of ‘not doing much’ really changing and I am keen to lower my Long Exposure on Spreadbets and my bias is towards selling a few things off - I am not panicking by any means but it just seems prudent to be cautious. I am not really buying much and am very happy to build on my Cash as I will explore more in the next sections of this Blog.
The Move to Cash I am seeing more and more people moving to larger Cash Positions and this includes some very capable and experienced Investors - in fact, several have Cash Positions as high as 85%. I am not convinced this is the right stance although I do feel cautious and think that we are due some sort of Sharp, Painful, Panicky, Correction because they normally come around maybe at least once a Year and we have not really had one since the Trump Election. OK, 2018 started off very weakly but it was not by any means a heavy panicky Sell-off - it was all rather orderly and Market Participants had plenty of time to think slowly about things and to position accordingly etc. It is very normal that we get an Autumn Sell-off and indeed the Weakest Month of the Year is usually September and October is notorious for containing many of the largest one-Day Drops in Stockmarket History. This makes the Autumn a particularly jumpy and nervous time for Markets and it doesn’t take much to spook them although what often happens I find is that the Markets move first (i.e. they get some Big Falls) and then the ‘Narrative’ comes along behind it to explain the ‘Reason’ which of course is trotted out by all the ‘Experts’ on CNBC and Doomberg etc. when the simple truth is no one really knows what is going on and much of the Selling is caused by other People Selling (‘Selling begets Selling’) and the nervousness of Buyers keeps them away so there is a lack of ‘Buying Pressure’ until the Bears are exhausted and it has dropped so much that the Bargain Hunters start flooding in. Stoplosses getting triggered probably explains a lot of the falls. This is famous last words and all that but the Summer tends not to get big Sell-offs although we do get a lot of Chop, Chop, Chop and silly frustrating Market moves and individual Stocks can be nuts. The best approach is to get out in the Sunshine and just ignore it all and then to pay a lot more attention when we start getting into August and Autumn is looming. On the more positive side of things, once Autumn is out of the way it is the usual pattern for the Winter Months to be the best of the Year. The big move to Cash confuses me a bit. Many People seem to be predicting the ‘End of the World’ but I see no evidence to back this up. If anything, as I write this things seem a bit better from a Stockmarket viewpoint than they did a Week ago - with the big change being around Brexit. The big development last Week was that the Tory Rebels just totally rolled over and let Theresa May tickle their bellys - unbelievable after all the fuss and drama that ‘Remain Rebel in Chief’ Dominic Grieve even voted against his own Amendment !! From what I am picking up it looks like his Tory Constituency Party and others lent on him. There is no doubt that we will have skirmishes along the way but it seems likely now that the remaining Bills that the Government needs to get through on Brexit will have an easier ride - in fact, the Majority voting with the Government was much higher than expected (something like 16 Votes I think). It has always been my view that Brexit if it is undertaken in a slow and undramatic way will do very little damage to the UK Economy or to the Stockmarkets as it is all about giving Businesses time to adjust to the changes. What is problematic is if there is a sudden Crash Exit from the EU and what I mean by this is a ‘No Deal’ Scenario where it all comes as a Shock and the Markets panic. However, a No Deal that arrives slowly and is clearly well understood in advance would have relatively small impact and again it is all about the Speed and Suddenness of any Change. Anyway, I think a ‘No Deal’ is extremely unlikely. There is one over-riding simple reason for this and that is because the Common Consensus is that a ‘No Deal’ will be bad for the UK Economy (and the EU Economy) and the Tory Party will do anything it can to avoid such a scenario because if they were to take the UK out of the EU with No Deal and cause a Recession then that would be electorally a disaster and it would remove one of their strongest Electoral claims of being the only Party that can be trusted on the Economy. The bottom line is that Politicians only really care about getting Elected again - they don’t care about Constituents or anything else - it is a Job and they like prancing around and they want this ‘Lifestyle’ to continue. This means that T May will pretty much give in to whatever the EU wants as long as it fits within her ‘Red Lines’ which of course are well known by all Parties and the EU have already said many times that there will be a Free Trade Agreement. T May’s biggest challenge is that if she gives too much away then her Brexiteer faction will force a Leadership Contest - but after last Week I think this risk has reduced and it seems likely that T May will see the Government through to the Date we officially leave the EU and then there will be a Handover to a new Leader who will have time to establish (him or her) self and be ready to fight Corbyn for the next Election. This is probably why the likes of Sajid Javed, Gavin Williams, Boris, Jeremy Hunt, etc. are all making lots of noise and positioning themselves to be the next Leader. So the way I see it is that one of the Big Risks that surrounds the Markets on a Macro-level is reducing and the Shock, Panic, ‘No Deal’ Brexit is really a very low Risk - perhaps less than 10%. The Irish Border is clearly a major Political Issue but like with all these things some Fudge will be mixed up in Brussels and it will get sorted. The other Big Issue kicking around is all this Trump Tariff stuff but I just don’t see it as that big a deal. I heard somewhere that some ‘experts’ had worked out what has been announced so far would impact US GDP by 0.2% which is simply less than the level of a Forecasting Error and it is miniscule. Politicians rant and rave but the simple fact is that most bits of the World are massively Protectionist (especially the EU and China) and Trump is highly likely to get his way. It is just a sideshow in my view. Perhaps a bigger risk is Economic Slowdown in general but despite some slowing we don’t even seem to be going into a Recession in the UK - and we have our own specific problems. The US seems to be pretty strong still as does Asia but the EU seems to be stuttering a bit - but as yet I don’t see much to worry about. With regards to the UK, I noticed somewhere that Foreign Direct Investment has really fallen off this year and I suspect that is all down to Brexit but once the picture becomes clearer I would expect this FDI to come flooding back in - that could be a nice boost to the UK in a few months time. That’s the other strange thing about all these People moving into Cash. If you look at Markets in general they all look very Bullish to me - there are no signs as yet that the Major Uptrends are weakening and if anything I would argue that in recent Weeks they have got stronger. We will look at some Charts in a bit and you can see what I am getting at. The other argument is that “Valuations are High” but I think you could have said this at pretty much any point over the last few Years and if anything I am seeing more Stocks that look good value now than I was a year ago. US Tech is clearly very highly valued but from my experience high valuations do not cause a collapse in Markets - what does that is an Economic Shock and I am struggling to see where this will come from (although of course by their Nature such ‘Shocks’ are impossible or difficult to see anyway !!). We have the US Mid-Term Elections in November and perhaps this will cause problems for Trump but his Core Support is solid as granite and his Approval Ratings seem to bounce around depending on the Day of the Week (or the Tweet he sent in the morning) !! There is a risk that if Trump does badly in the Mid-Terms then Market participants might fret that he will not get a Second Term and this would mean his Economic Reforms (which the Market loves) would get over-turned. Having said that, the Democrats have 2 huge weaknesses in having no Policies (Identity Politics is not a Policy) and no Leader. So, with all that in mind I am just going to keep plodding along and not doing much as has been my stance for pretty much all of 2018. I am watching the Charts closely and if I see the need to Hedge via the S&P500 then I will do so but as yet I am leaving things as they are. Blog Slate Last Week I finally got around to finishing the Primary Health Properties PHP Buy Rationale Blogs and Part 2 you should be able to find under this Blog on the Blog Page. I also wrote a Book Review of ‘A Man on the Moon’ by Andrew Chaiken which has nothing to do with Stocks (a nice change !!) and you can find it near the top of the ‘Non-Finance’ Books page. Some time ago the wonderful Aston Girl (@reb40) generously gave me a copy of Robbie Burn’s recent Book on Psychology - ‘Trade like a Shark’ and I had read through it twice and was pretty impressed but it was in my mind to read it a third time and to use a Highlighter Pen to flag up some key bits of text and then to type these into a Blog which I am sure Readers would find really useful. Of course it was a great plan but without the Highlighter Pen it had a bit of a flaw and whenever I went to Sainsburys or Tescos etc. I totally forgot to buy the Pen - but finally I got around to getting my mitts on one. Anyway, I then struggled to get the time to read the Book again but in the last few Days I managed to do it and because it was a third read I was able to get through the book very quickly and I have put Highlighter Ink all over it !! My plan now is to type the Text into a Draft Blog and hopefully this will be published in the next few Weeks - I don’t think it will take too long and I could do with more practice on my touch-typing. I am hugely impressed by this Book and I would argue that it is the best thing Robbie has yet written. What makes it different is that it is perhaps more useful for ‘experienced’ Investors/Traders whereas with the other Books they contains loads of the ‘Basics’ which suits Newbies perfectly but leaves little real meat if you have been around a bit already. I reckon ‘Trade like a Shark’ make me think a lot more and what stands out is how Robbie has written a ‘Psychology’ book but in fact there is little Jargon from this Field and it is really full of practical advice/ideas and he has put in loads of highly relevant examples from People who have emailed him over the years with their various Thoughts on Trading - both good and bad (mostly bad !!!). I find reading his books very inspirational and a bit like a Pep-Talk. If you can’t wait for my Review then just nip over to ‘Wheelie’s Bookshop’ and you can find a Copy there. On Friday Night I attacked the ‘Patience’ Blogs again and thought I had done really well after a bit of work but when I looked at my ‘Blog Plan’ that I had produced probably months ago, I was a bit downhearted to realise that there were loads of bits I have not included in the Draft yet. I need to work through this again and to weave the missing bits in - I am not sure how long that will take and ideally I will get the first of these Blogs out this Week but if I cannot manage that, then I will put something else out that I have already pretty much done in Draft form. Hop into the Time Machine I’d forgotten I had written these and when I looked through the ‘Blog Index List’ on the ‘Useful Links etc.’ page I noticed them and thought they would be a good choice this week: http://wheeliedealer.weebly.com/blog/jesse-livermores-trading-rules-how-do-they-relate-to-the-wd-approach-part-1-of-2 http://wheeliedealer.weebly.com/blog/jesse-livermore-trading-rules-how-do-they-relate-to-the-wd-approach-part-2-of-2 Let’s do some Charts……… Dow Jones Industrial Average (the DOW) As ever the Charts I will show are from the brilliant ShareScope Software that I subscribe to and if you click on them you should see more detail as they ought to grow bigger !! Earlier in this Blog I was blathering on about how the Markets were still in Major Uptrends and while this was the case I am not convinced there is much to worry about. To demonstrate this, we have the Chart of the DOW going back to 2009 and the Parallel Red Lines show a clear Uptrend Channel and my Black Line (Black Arrow) shows an Uptrend Line that Supports an accelerating Uptrend which has been in force since early 2016. As long as this Black Line holds as Support there is not much to worry about (this means it needs to stay above about 24000 ish) and even if that Support fails there is more Horizontal Support at about 23000 ish and then we have more Support from the Upper Red Line of the Long Term Uptrend Channel that I have marked with the Red Arrow. So it seems a bit early to be panicking. 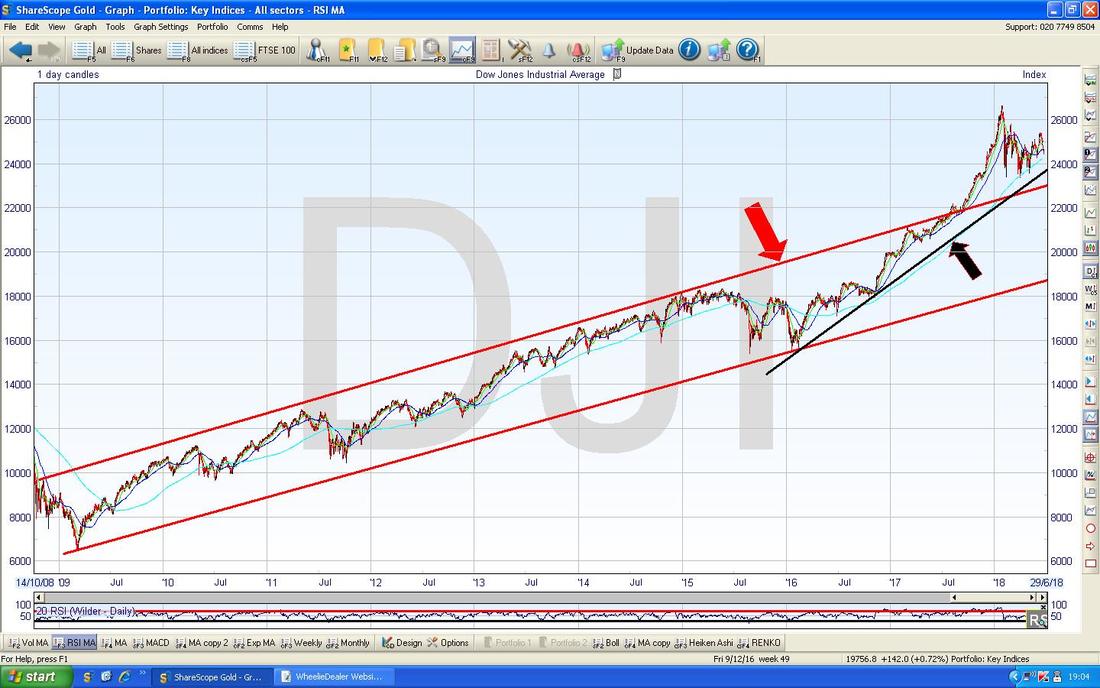
Right, you’ll need to concentrate on this one - go and stick the kettle on or something and take a few deep breaths……
On the Chart below we have the Daily Candlesticks for the DOW and I have zoomed in to show a familiar picture to what I have shown in my Blogs in recent Weeks. First off note the Green Downtrend Line which I have marked with the Green Arrow - this is the most problematic thing for the DOW and we need the Price to get over this Resistance Line to be more confident about a Bullish Scenario. Next look at my sort of Parallel Blue Lines on which I have pointed at the Bottom Line with my Blue Arrow. Note, what I have done here is a bit naughty and I have drawn in the Top Blue Line which I think is pretty valid in Technical Analysis terms (‘Analysis’?, don’t make me laugh Wheelie !!) as it has about 5 ‘Touch Points’ but on my Bottom Blue Line (the one with the Blue Arrow) I am totally cheating and have done a bit of ‘Line Fitting’ which is not how it is done. Anyway, the point I am trying to make is that we might have a bit of an Uptrend Channel going on here and how things play out in coming Days will tell us if I am right or not. My Big Yellow Box is trying to show how there is a lot of Support down below where we are now - this should help if we do get any Selling. Another big positive is the 200 Day Moving Average Line which is the Light Blue Wavy Line which my sort of Pinky Arrow is pointing at. This is clearly rising and that denotes a Long Term Uptrend (remember, with Charts, the more established Trends dominate over Shorter Term moves so this is very much a Bullish Chart). Up above the 200 Day MA we have the more Wiggly Blue Line which is the 50 Day MA - you should be able to see that this one is also rising which is another Bullish thing. My Green Circle is capturing 2 Candles from Thursday and Friday last Week and note how Friday gave us an ‘inside Day’ (the Candle from Friday was ‘inside’ the extent of the Candle from Thursday) and this means that we need a Third Candle to complete the Pattern and this will help give us Direction for the start of Next Week. If we get an Up Day tomorrow (Monday) then expect more Gains and if we get a Down Day then that Support is going to get tested !!! Of course, if my Blue Uptrend Channel turns out to be right then the Price is now on the Bottom Line and it could turn up from here. We shall see. 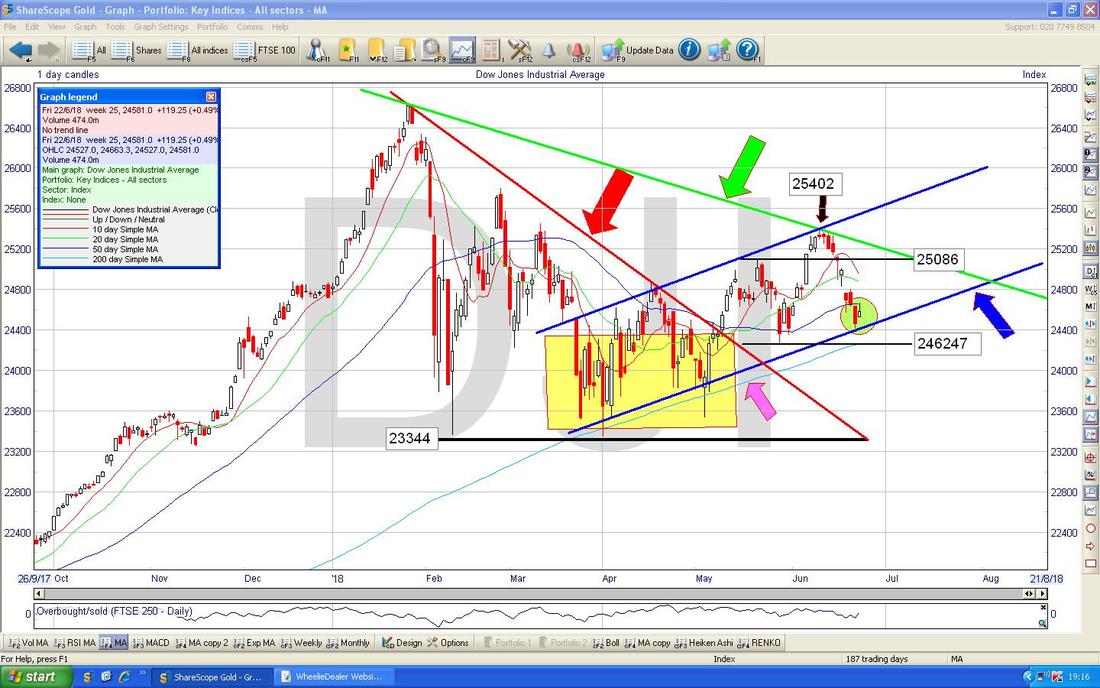
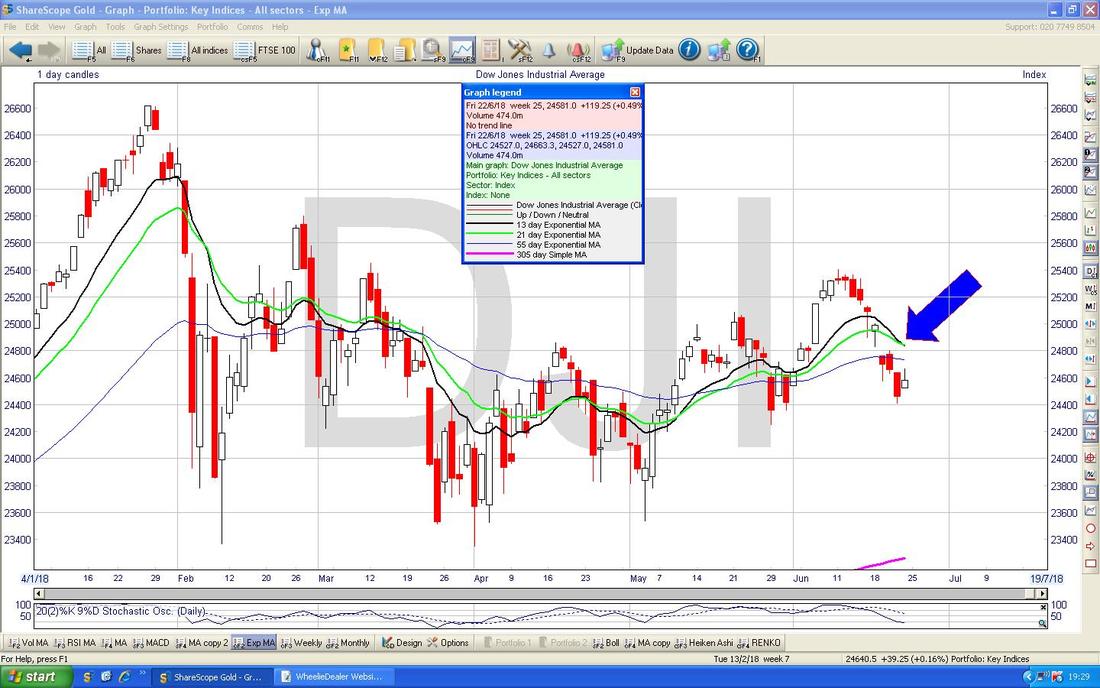
This next Chart is a bit more concerning in the Short Term. This Chart shows the Daily Price Candles for the DOW with the Black 13 Day EMA (Exponential Moving Average) Line and the Green 21 Day EMA Line. My Blue Arrow is pointing to where we seem to be getting a Bearish ‘Death Cross’ and if this happens it suggests we could get Weeks of falls ahead. However, I have looked closely at this and as yet it is bang on the Death Cross - it all depends on Monday - if we get an Up Day then we could just narrowly avoid this worrying development.
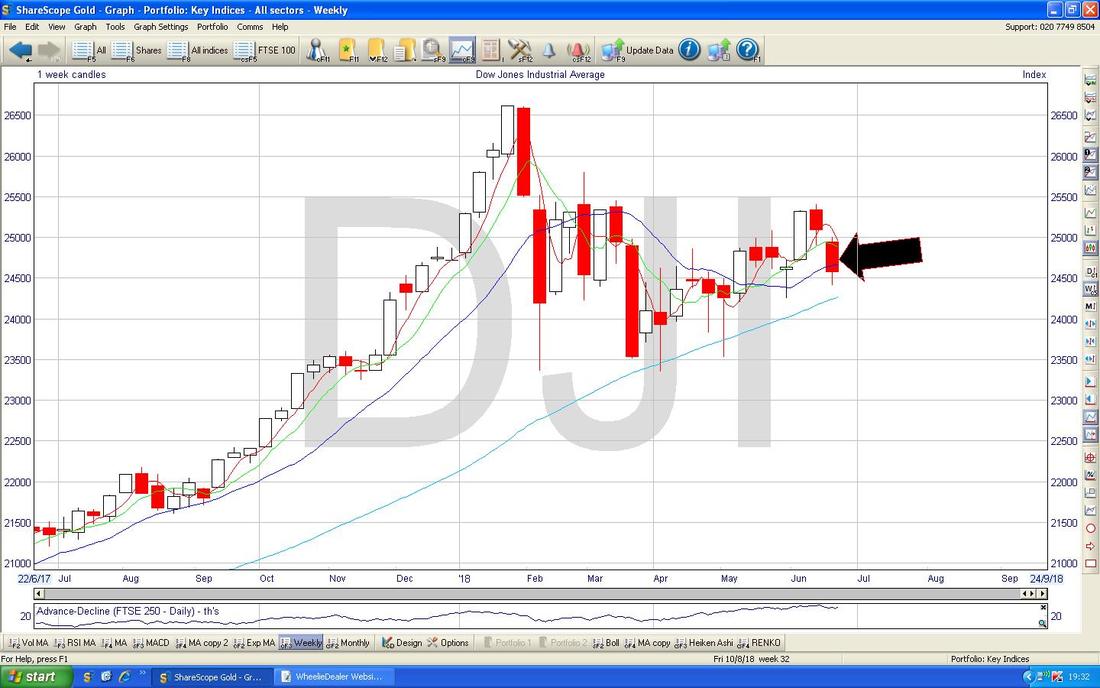
On the Chart below we have the Weekly Candles for the DOW - my Black Arrow is pointing to a Big Red Down Candle and this is looking Bearish.
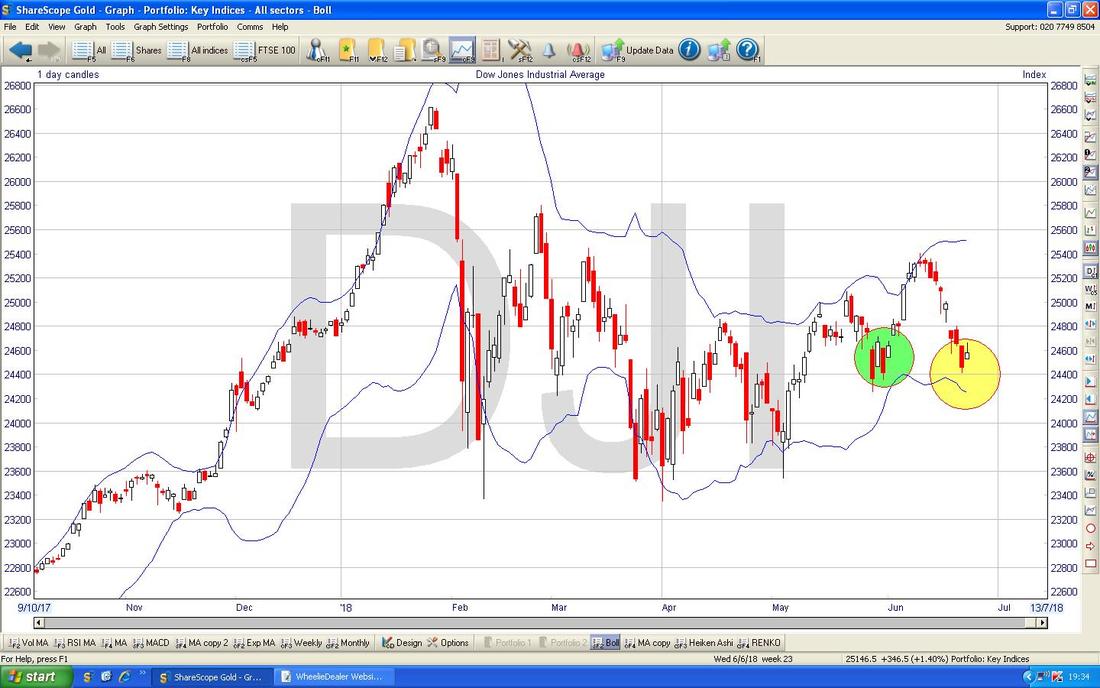
On the Chart below we have the DOW Daily Candles with the Blue Wiggly Bollinger Bands above and below. My Yellow Circle is trying to show how the Price is now a bit above the Bottom Bollinger Band and this suggests it might drop a little more before finding Support and turning up. However, if you look where my Green Circle is we recently had a situation where the Price turned up before hitting the Bottom Band - so anything is possible !!
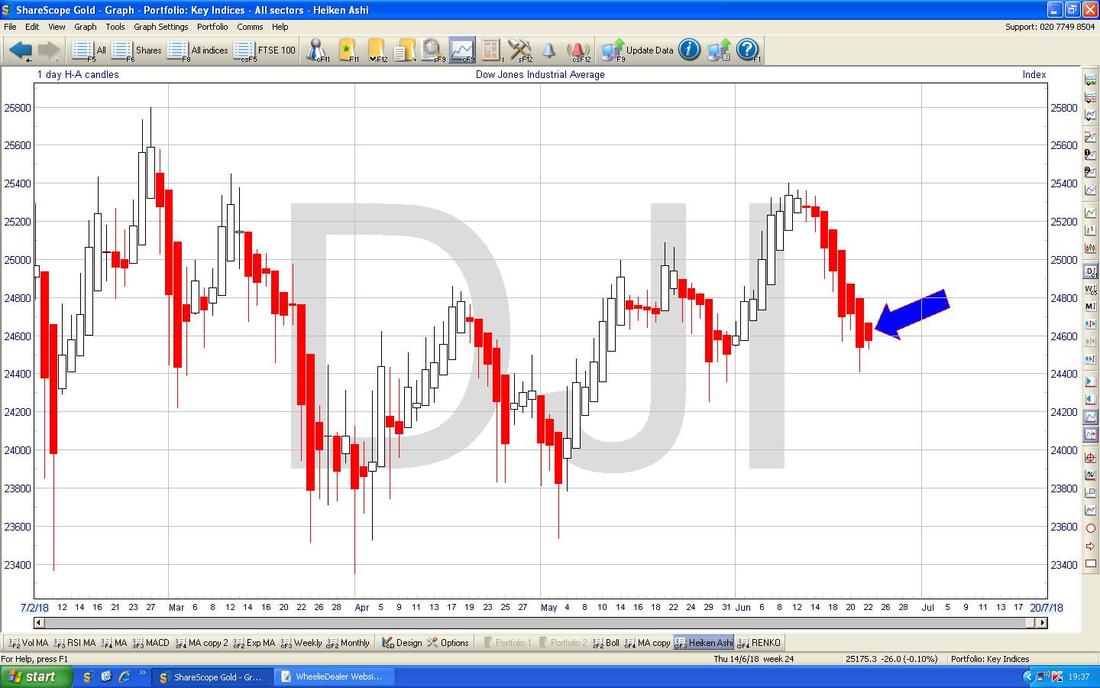
Next we have the Heiken Ashi Daily Candlesticks for the DOW and my Blue Arrow is pointing to where we got a Small Narrow Red HA Candle on Friday - this suggests that the force of the move Down which was shown as the 6 or so Big Red Candles before is weakening - so a Turn could be coming.
I won’t show the S&P500 because as usual it is quite similar to the DOW but if anything the DOW is a lot worse. I think the S&P500 benefits because it incorporates a lot more Tech than the DOW does and the Nasdaq has been a lot better than the DOW recently and this seems to be reflected in the S&P500 which I see as a mix of both.
Ha Ha, I lied !! Next we have the Daily Candles for the S&P500 and my Blue Arrow is pointing to how unlike the DOW we do not have a ‘Death Cross’ on the 13/21 Day EMAs yet. This is important for me because I might Short the S&P500 if we do get such a Bearish Cross. I do not like Shorting the DOW as it is only 30 huge Mega-cap Stocks and it is a bit naughty like the FTSE100 can be. As a general rule it always seems best to Trade the most liquid and wider Indexes. 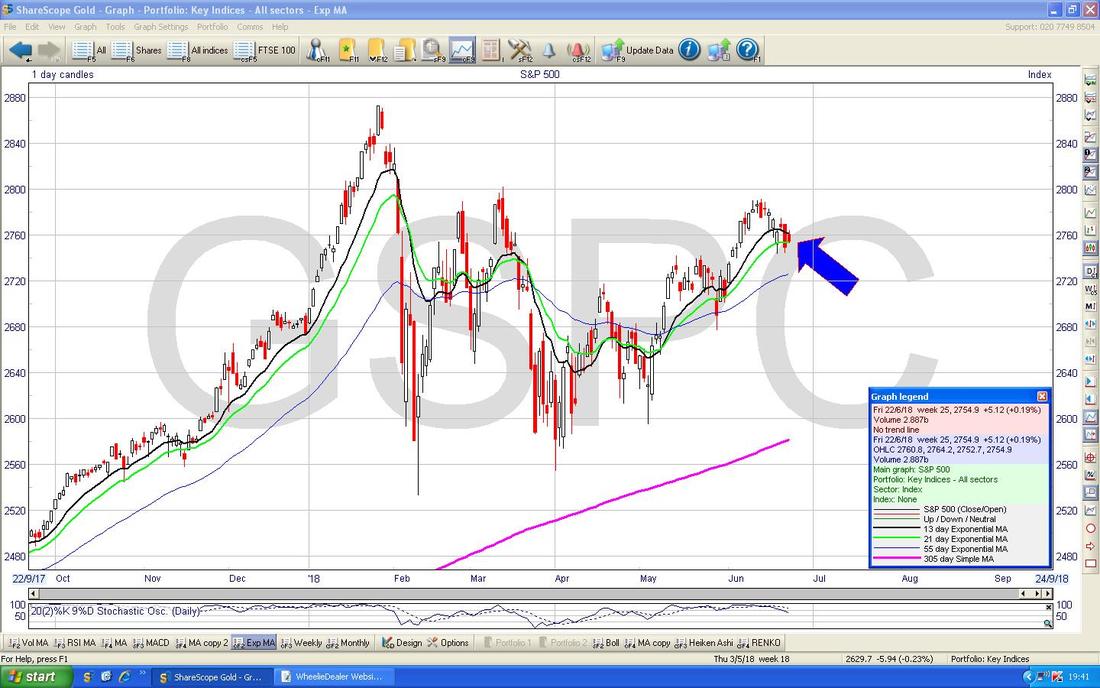
Nasdaq Composite
I won’t dwell on this as it is quite simple. The Nasdaq Comp made a New All Time High last Week up at about 7800 which is pointed at with my Black Arrow and my Green Arrow is pointing to how the 50 Day Moving Average has turned up. This is a very Bullish Chart. It might have a pullback in the Short Term but the Trend is up. There is Support at about 7600 in the very near term and if that fails there is a lot of Support in the region around 7400. 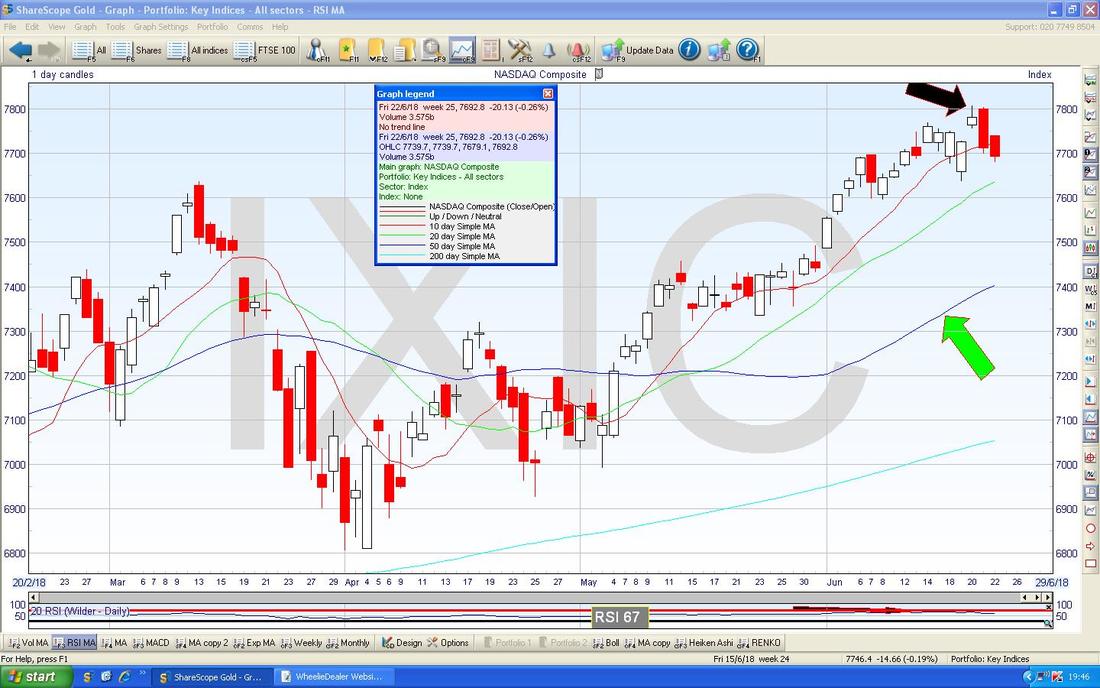
FTSE100
Next we have the FTSE100 Daily Candles and on the Chart below first off note the Green Downtrend Line (Green Arrow) like we had on the DOW. However, what I have done here is been a bit cheeky and drawn in a sort of Parallel Green Line down below but again I am line-fitting and suggesting a Downtrend Channel which might be entirely imaginary - we should find out soon enough if this is valid or not. Next look at my Yellow Circle - this shows a Bullish ‘Golden Cross’ between the 50 and 200 Day Moving Averages and this suggests plenty of Gains to come in the Weeks/Months ahead. My Red Arrow is pointing to a Big White Up Candle from Friday - this is Bullish and it could be that we are turning up again and Support is just below at 7548 and below that we have really important Support at 7500 (I have put this in the Blue Text Box). 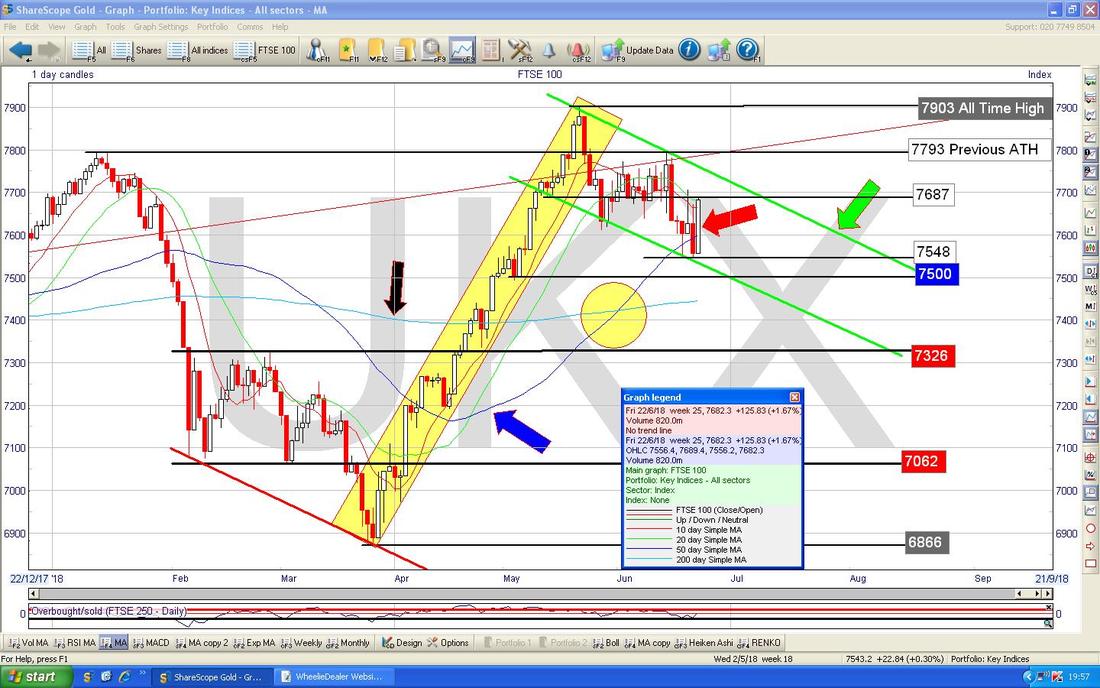
My Green Arrow on the Chart below shows a Bearish 13/21 Day EMA ‘Death Cross’ on the FTSE100 Daily. I find this a very reliable Indicator but sometimes it does do a Cross which quickly gets reversed - if it is going to be reversed then it needs to happen in the next few Days or it implies we could have Days and Weeks of falls ahead.
Remember the FTSE100 is a pig of an Index and gets affected a lot by moves in the Pound and for Oil and Commodities - I tend not to trade it these days. 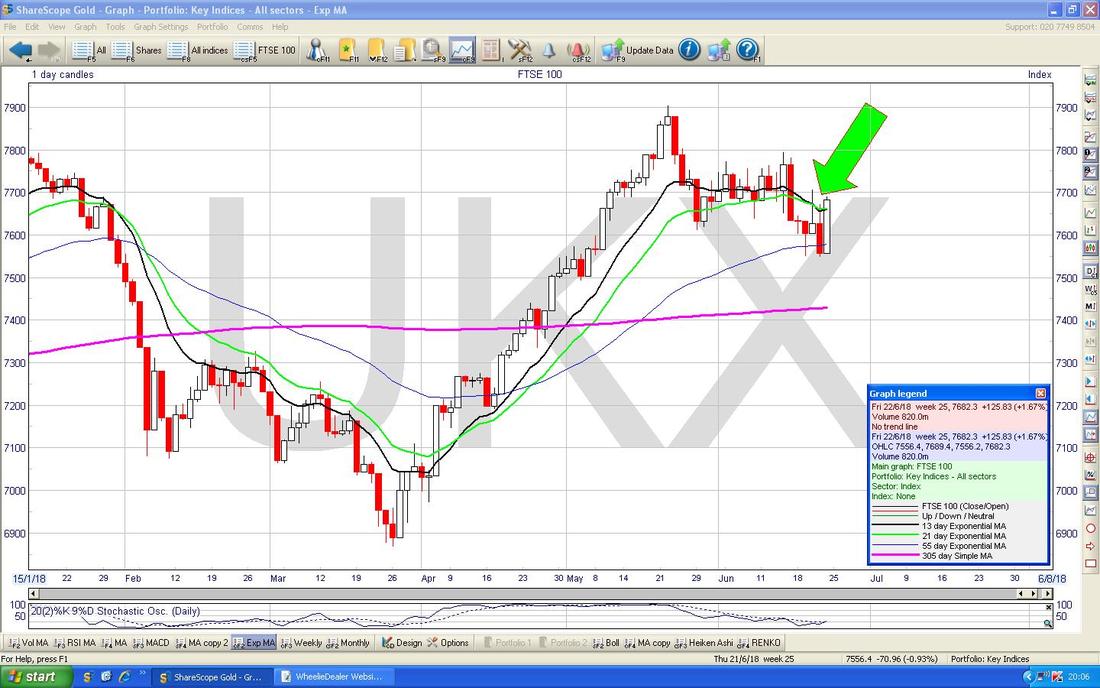
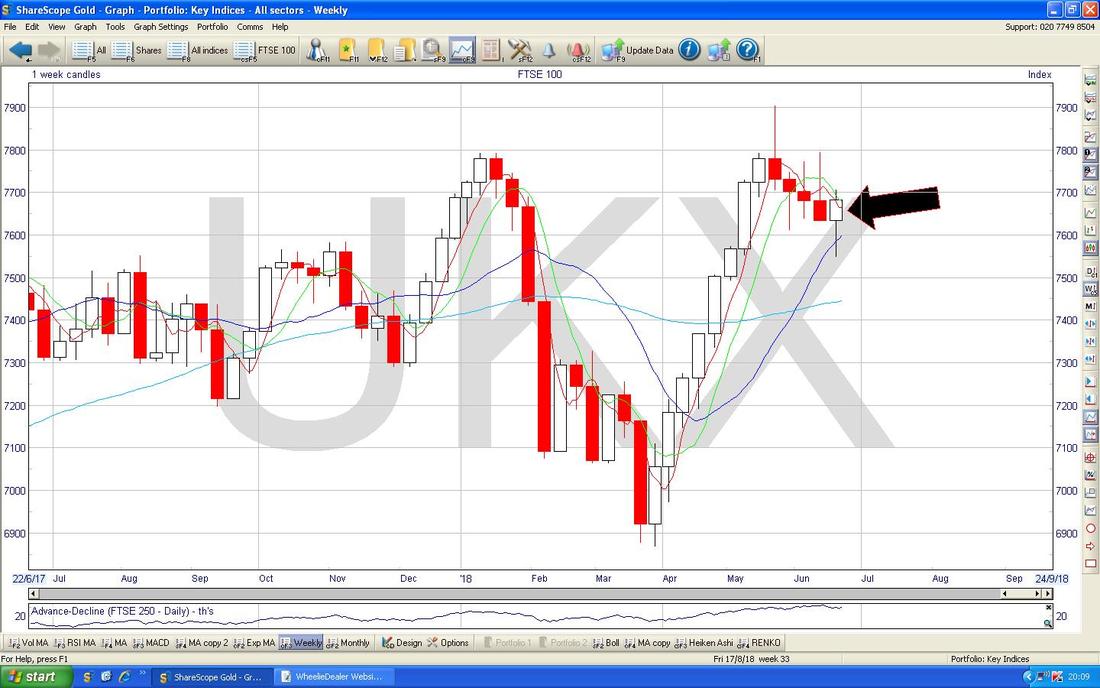
Below we have the Weekly Candles for the FTSE100. My Black Arrow is pointing to a Hammer Candle we got last Week and this suggests that after the 4 Down Weeks before we might now turn up.
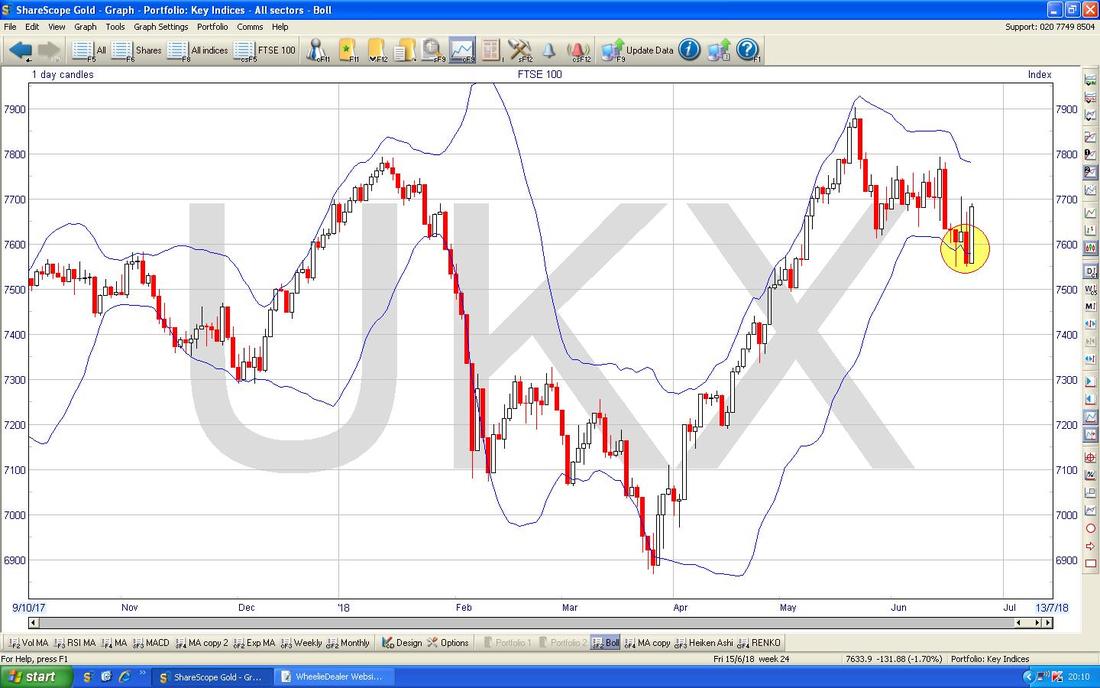
Now we have the Daily FTSE100 Candles with the Bollinger Bands above and below. My Yellow Circle is showing how we have been down at the Bottom BB and now the Price has moved up off the Bottom Band - this might be turning up then.
FTSE250
Due to my time constraints I won’t show much on this but it is largely similar to the FTSE100. On my Chart below look how we have avoided a ‘Death Cross’ on the 13/21 Day EMAs where my Green Arrow is. 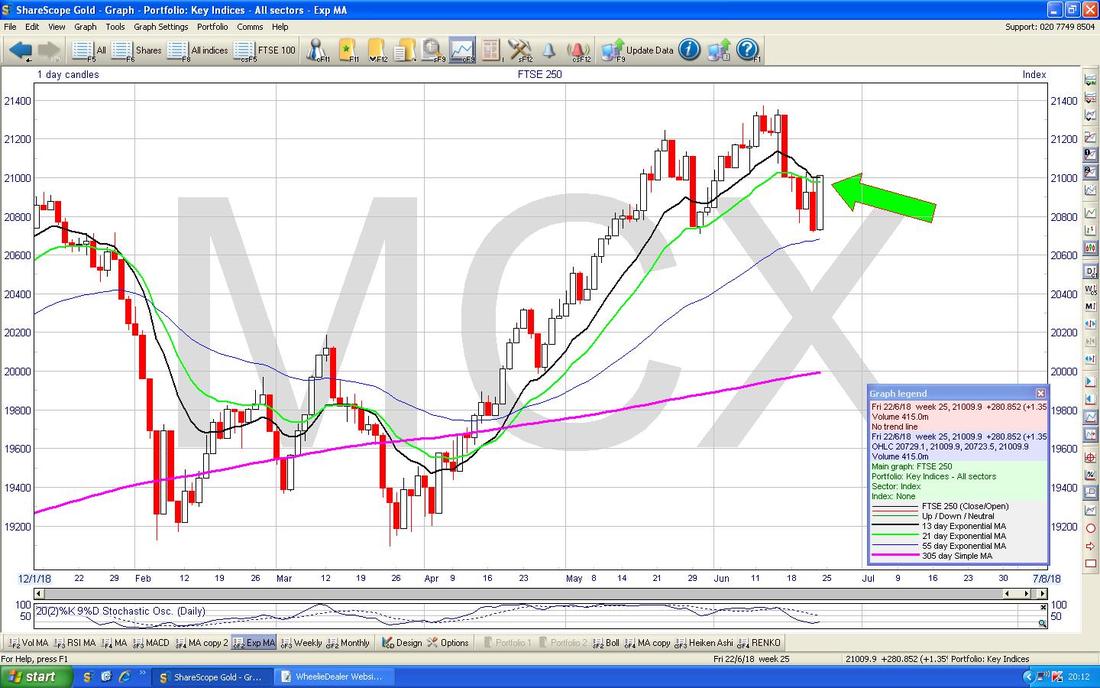
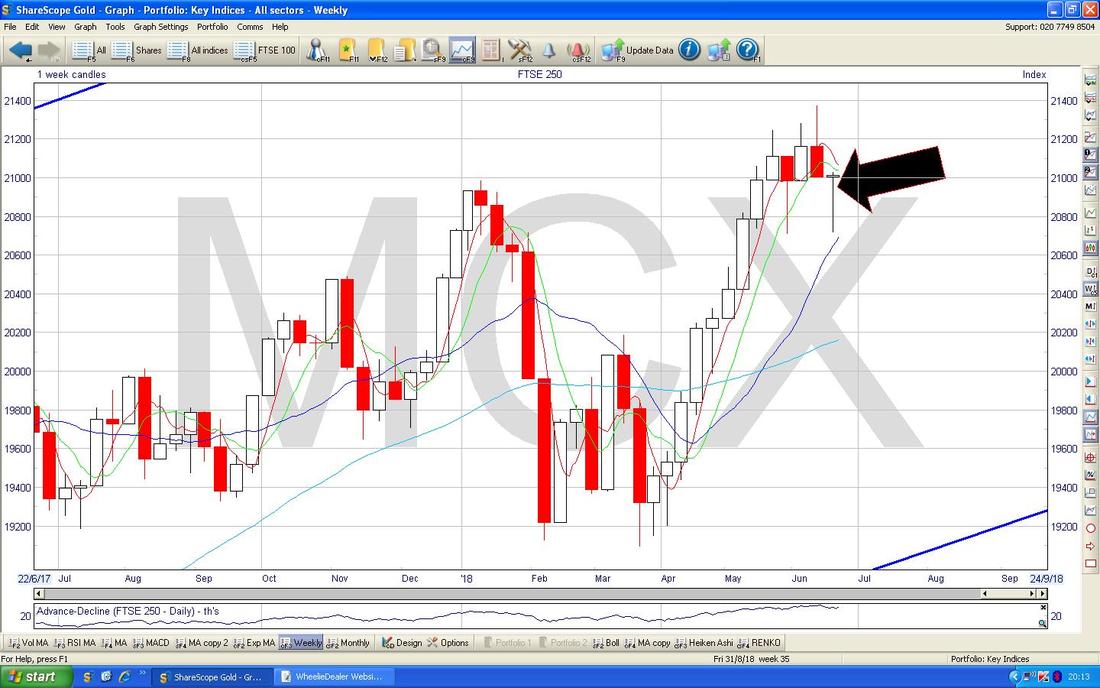
Now we have the Weeklies for the FTSE250. My Black Arrow is pointing to what is very much like a ‘Dragonfly Doji’ - anyway, whatever we name it the fact is we got a nice Bullish Reversal during Last Week.
Telecom Plus TEP
I hold TEP in my Income Portfolio and as a Long Spreadbet. The Company has been soggy for a long time as they have struggled in a very competitive Energy Price environment with ‘The Big 6’ offering very attractive Discount Offers to people who switch their Supplier but TEP have a policy of ‘Always Low Prices and every Customer pays the same’ which has not been so appealing against the Discounts from the Big 6. However, TEP put out Results last Week and they said they are expecting to return to Growth now because changes from the Regulator and the Government will mean that these Big 6 Discounts will go and the Energy Price Cap helps TEP. On a Forward P/E of about 18.5 falling to 16.3 the following Year and a Forward Divvy next Year expected of 4.5% and then 4.9% this looks pretty attractive as Growth picks up again. On the Chart below, where my Black Arrow is the Price moved up above the Resistance Level at 1112p and this is a Bullish Development and this Breakout will have been taken by many as Buy Signal. Note also the ‘W’ Shape over the last few Months. 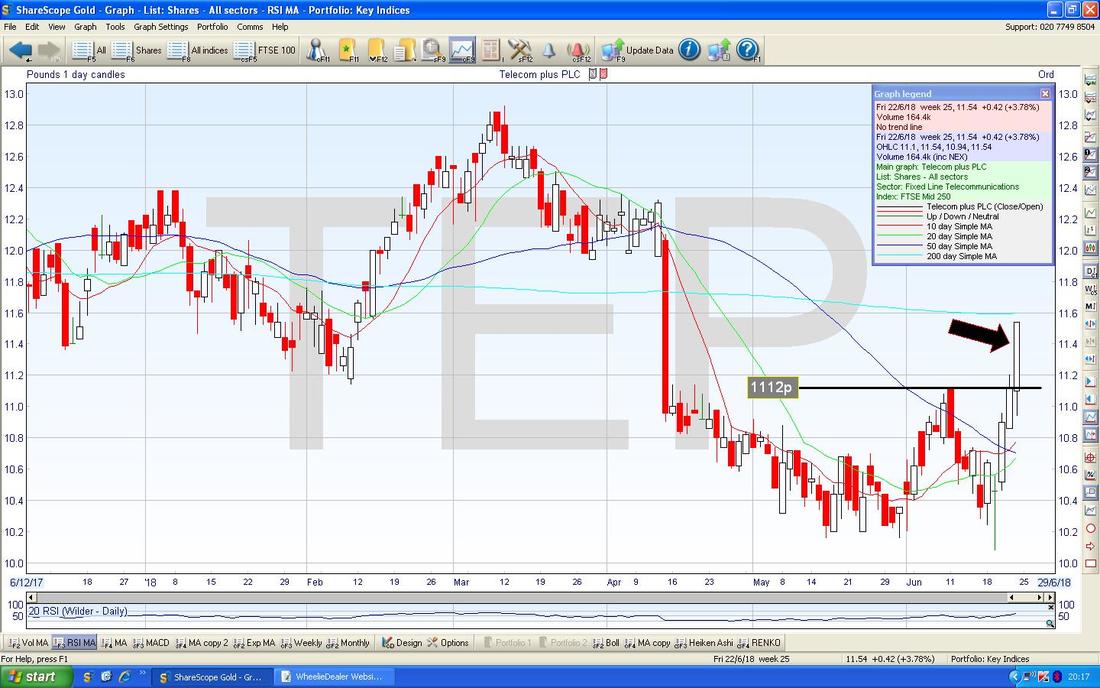
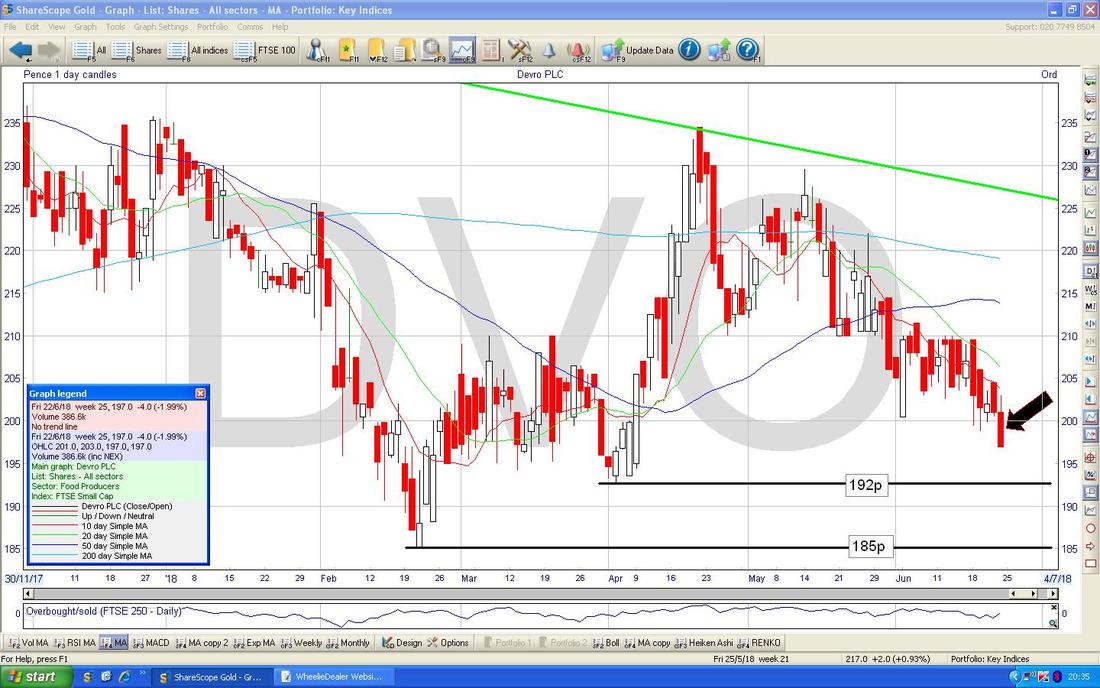
Devro DVO
I hold DVO and it looks decent Value but the Chart is weak. DVO has a bit of Debt but the Cashflow is very strong (if you look in the Blog Archives there are a couple of Blogs about DVO from a while back) and with a Forward Dividend expected of nearly 4.8% for Next Year and a Forward P/E for Next Year of 12.3 it is verging on Cheap I think. On my Chart below we have a Long Term Downtrend Line which I have marked in Green with the Green Arrow and this is capping any upside. Note how the Darker Blue 50 Day Moving Average Line is moving up towards the Lighter Blue 200 Day MA Line - if we get a ‘Golden Cross’ where the 50 goes through the 200 that would be very welcome !! The danger is that with the current weakness that Golden Cross is starting to look pretty unlikely. 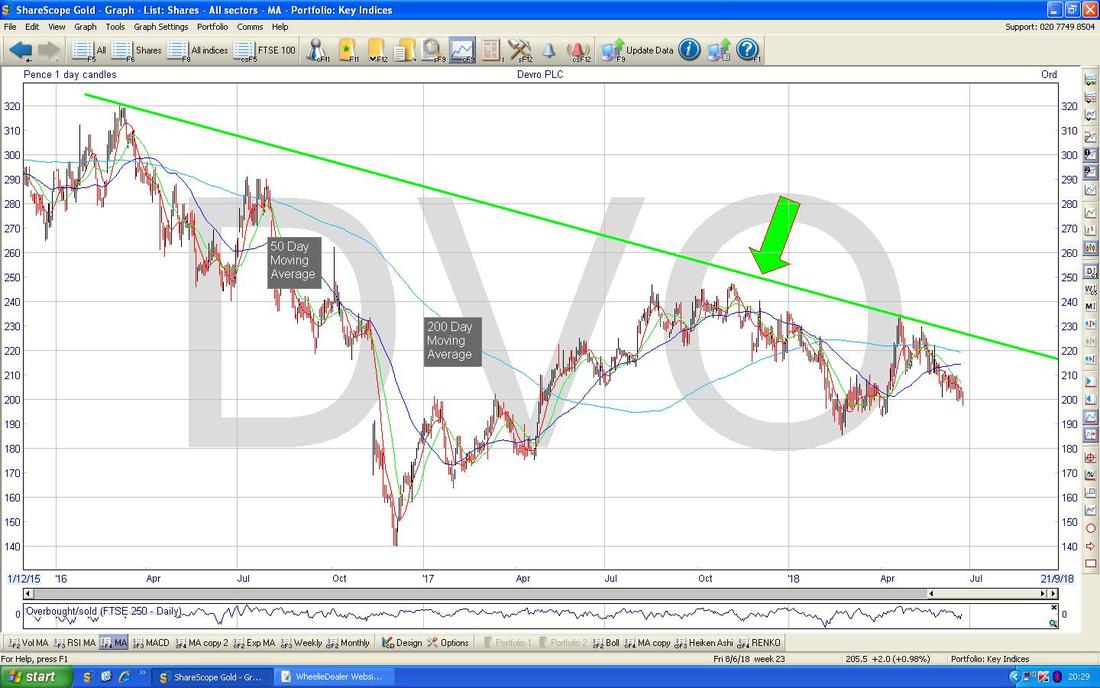
On my Chart below my Black Arrow is pointing to a Big Red Down Candle from Friday and the failure of Support around 200p is clearly not a good thing. Down below we have Support first at about 192p then at 185p - if the latter fails then this could drop a lot more.
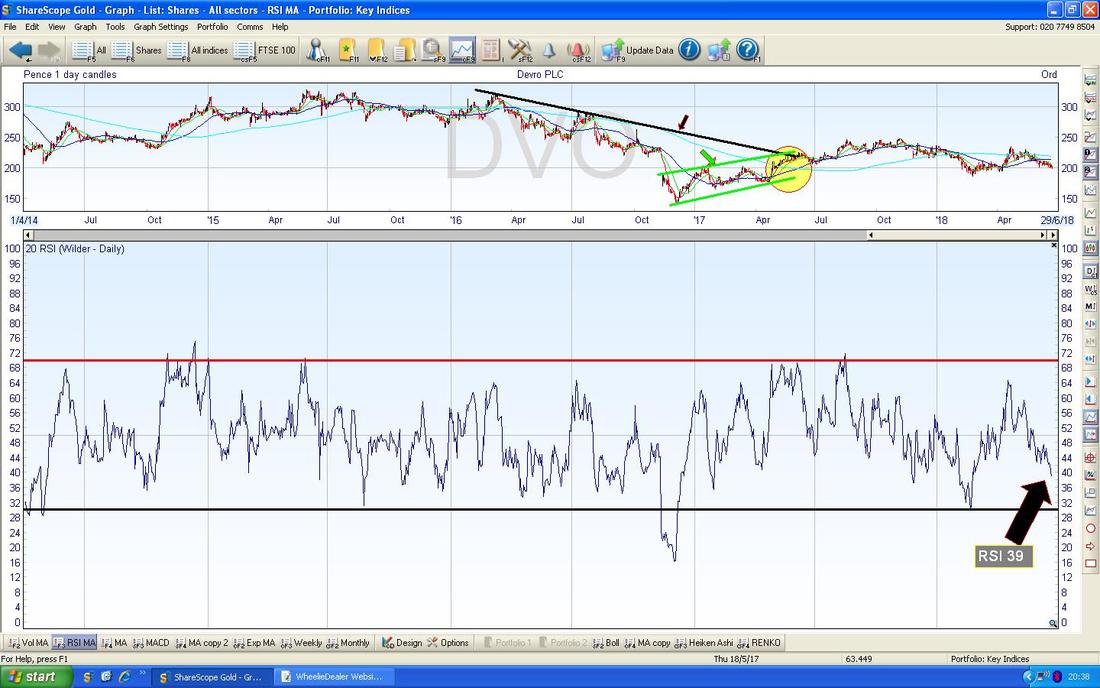
In the bottom window below we have the RSI (Relative Strength Index) for DVO on the Daily. On a reading of RSI 39 it is getting low but can go a lot lower.
My Chart below has the Daily Candles with the 13 and 21 Day EMAs again. My Black Arrow is showing how a Bearish ‘Death Cross’ between the 2 EMAs predicted the move down. Brilliant.
OK, in a nutshell DVO is falling but is not a Buy yet. I will leave it there - have a great week everyone and see you at Duxford if you are coming !! Cheers, WD. 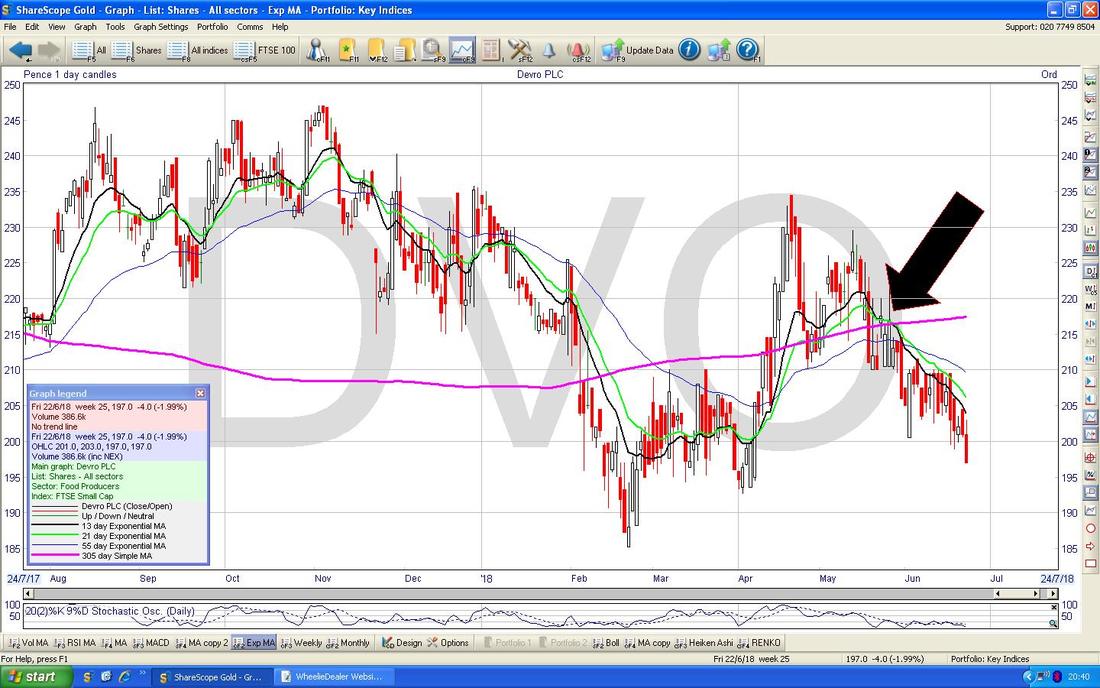
2 Comments
Jean black
25/6/2018 11:17:57 am
I hold DVO so it has given me food for thought, thank you for going to the bother of doing the charts
WheelieDealer
26/6/2018 09:15:28 pm
Hi Jean, Leave a Reply. |
'Educational' WheelieBlogsWelcome to my Educational Blog Page - I have another 'Stocks & Markets' Blog Page which you can access via a Button on the top of the Homepage. Archives
May 2024
Categories
All
Please see the Full Range of Book Ideas in Wheelie's Bookshop.
|
