

|
educational blogs |
|
I got that Title from a comment I heard on one of the News Programmes where apparently this is what White House Aides refer to Donald Trump as - he travels all over the place and round the World and you never know what he will say next and explode, leaving the Aides etc. to clean up the mess. Just recently the Hand-Grenade went off after the G7 Conference following Justin Trudeau’s Speech and then just Last Week Theresa May got hit by the Shockwave as she sat down to her posh Dinner at Blenheim Palace only to find out that Trump had done an Interview in ‘The Soaraway Sun’ slagging her off.
Last Week Overall my Portfolio gained 0.4% Last Week which I guess is ok really. My reticence is because the Markets are just so tedious at the moment but I guess with Summer in full swing it’s not really a surprise. I don’t know though, it certainly seems more painful that other Years and it is just more of the same for 2018 really with Upwards Progress on my Portfolio very hard to come by. Simplistically I guess all the worries and fears over Brexit are probably a factor and I am certainly very cautious myself as we go towards the Autumn which I suspect could be particularly troublesome.
Yet again my Income Portfolio has totally surprised me and so far for 2018 it is up 9.2% which is really galling when you consider that I do pretty much nothing to it (just 1 Buy and 1 Sell over 2018 I think) and it is far outperforming my ‘Normal’ Portfolio which is only barely positive. It does make me slightly concerned that perhaps the Risk Level in my Income Portfolio is higher than I think it is (the intention is to have fairly Low Risk and Defensive Shares to an extent) but when I look at the context of Returns over the last 3 or 4 Years I suspect this Year is merely an abberation and of course by the End of 2018 it could easily have dropped back loads.
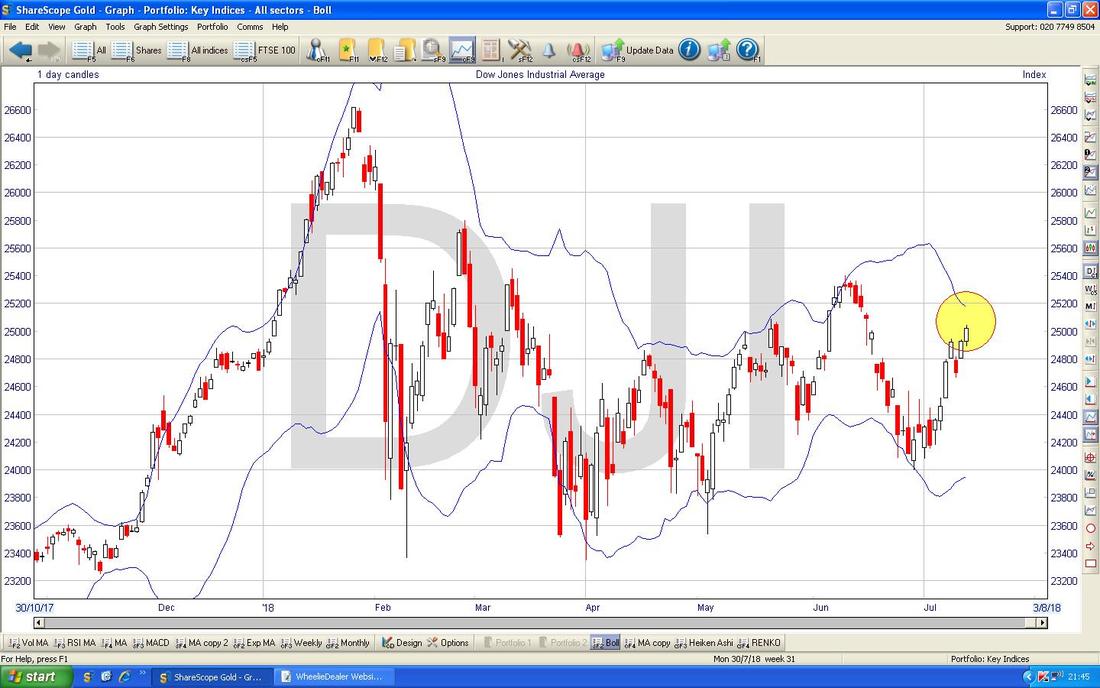
One observation I can make is that over 2017 several of the Stocks in my Income Portfolio had a pretty tough year and I think overall the Portfolio gained about 4% - so perhaps the Performance this year is really just the Stocks playing ‘catch-up’ and to an extent it is Mean Reversion. My Target for the Income Portfolio is around 7% per Year CAGR but of course in reality from Year to Year there will be variations in the Yearly Gains or Losses. If you go to the ‘Portfolios’ Page of this Website you should find at the top a List of the 12 Stocks in my Income Portfolio and if you click on the ‘Blog Category’ ‘Income Portfolios’ then you should find a detailed and lengthy Blog Series which I wrote on how to construct an Income Portfolio (and to help you gorgeous Readers I will include a Link further down this Blog). Looks like the Coming Week will have plenty of Political Shenanigans with Boris doing a Resignation Speech on Monday I think and the next Trade/Customs Bill coming up for Debate in Parliament - the potential for more trouble for Theresa May is massive. Amanda Plattell on Andrew Marr Show today was saying that it is believed the Chairman of the Tory Backbench 1922 Committee has 35 to 45 Letters - the Threshold is 48 Letters I think so a Leadership Challenge cannot be ruled out especially when Tory MPs feel pressure from their Constituency Parties over the perceived Brexit Betrayal. Sky News are saying Theresa May has had 8 Ministerial Resignations since the Chequers Plan arose…… As I mentioned in my ‘Weekly Performance’ Update for June on the Homepage (you have to scroll down to see it) which I finally got around to doing, my Strategy is pretty much the same as it has been for most of 2018 so far - I am not looking to Buy anything and my emphasis is on Selling a few things (well, TopChopping really) and particularly trying to lower my Long Spreadbet Exposure. I think Autumn could be really difficult and I am getting my Portfolio ready to take it on by lowering Overall Exposure and boosting Cash. Spreadbetting / CFD ESMA Regulatory Changes A few Weeks back in my Weekend Blog I wrote about the upcoming ESMA Changes and here is the Text I wrote: ‘This is something that has been getting part of my Brain Power in recent Weeks as I consider the implications of the Rule Changes which I think come in on August 1st 2018. I have quite a large Long Exposure in my igIndex Spreadbetting Account and it is partly made up of FTSE100 Stocks that I am Long on (some are a ‘Mirror-Trade’ of Stocks I hold in my Income Portfolio). The problem with this is that under the New Rules (sounds like a Dua Lipa tune !!) the Maximum Leverage a Client will be allowed is 5 times or something like that - which means the Margin Deposit will be 20% minimum. The catch is that at the moment FTSE100 Stocks are on a Margin of 5% or 10% and therefore to keep my Long FTSE100 Positions open I will need to use more Capital - so this means my ‘Cash Available’ will go down and I will need to put more Cash in perhaps to keep my Cash ‘Buffer’ of the size I like. Having said that, there is an upside that I doubt anyone else has thought of. It has often been the case in the past that when there is a major worrying Macro Event going on (like the Brexit Vote for example), then igIndex have increased their Margin Rates and to be honest I find this a Pain in the Arse as of course when we are about to go into a Market Meltdown the last thing I want is my Spreadbetting Provider using up more of my Free Cash Buffer !! Hopefully this will not happen in future. Another effect is that it might mean the Margin Requirement on Index Trades is massively increased (at the moment it is absurdly low like 1% or something) and this will mean doing large Index Longs or Shorts will need loads and loads of Margin Cash and therefore Smaller Positions might be the only practical way forwards. We shall see. There is also a possible wider impact that if lots of Spreadbet and CFD Customers end up Closing many of their Long Positions then this could put a degree of Selling Pressure upon Stocks in the normal Stockmarket. It is hard to predict how much this could happen - it might be absolutely minimal but it is worth considering that even though it should only affect Index and FTSE100 Positions, it could be that Customers are forced to sell Long Positions (and Close Short Positions although this would probably only have a small impact) in FTSE250 and FTSE Small Cap Stocks etc. as this is the only way they can keep some FTSE100 Positions open - so the impact could be across the Markets. My hunch is that the effect would be small and limited and probably only impact for a few Days but it is something to be aware of at the start of August. Of course, it might also impact the Revenues and Profits that the Spreadbetting/CFD Companies can make - it seems likely the number of Trades in aggregate will reduce and the size will definitely be much smaller if more Margin is needed upfront. I think there was another Rule Change that was relevant about when they will Close out a Position if your Margin drops below 50% or something - it is not something that concerns me but if I have missed something relevant about this I will probably include it in a future Blog.’ To an extent that says it all really but there are a few things to add that have come to light since I wrote that. The most crucial thing for me personally is that Margin Rates for Positions I already have opened will not change - it is only on New Positions that I open with igIndex that the Margin Rates could be higher (or lower on some Stocks which previously needed 25% Margin Deposit which will most likely drop to 20%). This is excellent news and means I won’t suddenly find my ‘Cash Available’ reducing a lot. I understand that City Index are doing a similar thing and I am assuming it is the case across the Spread betting / CFD Industry that Margins on Existing Positions will stay the same. Something that could be relevant though is that Spreadbetting Companies themselves might come under pressure as we near August and it is hard to know the impact on their Revenues/Profits. They claim it will have little effect but I am not convinced because it strikes me that Higher Margin Requirements must mean most Customers end up having Lower Exposures overall. Seeing as the Revenues/Profits the Companies make is derived from the % Spread on the Trades, then smaller Trade Sizes must suggest lower Revenues and Profits - we shall see but it is something to be aware of. I hold igIndex IGG Shares myself and will not be selling but I won’t be surprised if the Shares drop off a bit in the short term. Memory Lane Tripping First off here is a Link to those Blogs on how to create an Income Portfolio: http://wheeliedealer.weebly.com/blog/the-joy-of-income-portfolios-part-7-of-7 This contains Links to the earlier Parts. Next up we have an Oldie regarding Takeover Bids - several Stocks are mentioned in this one where they got Takeover Bids which fell through for whatever reason but this gave a good indication of what other Businesses thought they were worth. To this we can add Entertainment One ETO - I recall the Bid from ITV a few Years ago was 236p and on Friday the Shares hit 383p, which of course made me very happy as it is certainly in my Top 5 Holdings. GoCompare GOCO also recently received a Bid from ZPG which got withdrawn: http://wheeliedealer.weebly.com/blog/listen-to-what-the-market-tells-you-on-takeovers-includes-iom-888-itq-ffy-goal-mks Blog Slate Last Week I issued the First Part in a Series of 3 Blogs which are in effect a Review of Robbie Burn’s, The Naked Trader’s, latest Book, ‘Trade like a Shark’. I pretty much finished a very good Draft of the next 2 Parts on Friday and I expect to issue these over the next 2 Weeks. After that I will probably be Publishing a Series of Blogs from a Mate who is a Demon at Short Term Trading and makes a living out of it - I have read a couple of Drafts now and it is a superb piece of Writing so I suspect Readers will enjoy it. As with all these things even if Short Term is not your thing, you will probably find Ideas and Concepts in it which you can pinch to incorporate into your own Approach. I tripped over an idea for a New Blog today about how you don’t need to be hugely Intelligent to be a good Investor - it seems to be that Character Traits like Patience and Discipline are far more useful than out and out IQ. I am not totally sure how to write this yet but no doubt once I focus my mind and get a Clean Sheet of Paper in front of me with a Cup of Tesco’s Red Label, I should be able to figure some sort of structure out. What has got me thinking this way is an Article by Chris Dillow in this Week’s Investors Chronicle, the one with ‘Income Majors’ on the Front Cover, which appears on p.16 with the Title ‘In the genes - There’s a large genetic component to successful investing’. Ironically despite the Title it seems to stress the factors we can probably train ourselves for like Discipline rather than what appears to be Genetic factors. If you have access to the IC it is well worth reading. I am fully in ‘Wheelie Summer Mode’ now and trying to make the most of the great Weather and it is clearly a good time to be away from the Markets as they are chopping around like crazy and not really achieving much. Fortunately I have a good Slate of Draft Blogs lined up so I should be able to keep the flow going nicely even though it is not my No.1 priority !! Better sling some Charts in……… Dow Jones Industrials Index As always the Charts I am showing are ScreenShots from the Award-Breaking ShareScope Software that I use. If you are a SharePad User I am sure you can configure the Charts in there to look like mine if you wish. If you click on these Charts they should grow bigger so you can see them in more detail. On my Chart below which has the Daily Candlesticks going back for about 9 Months or so, my Small Yellow Circle is capturing a nice White Up Candle from Friday and this in itself looks Bullish. However, note that this Candle is now up near the Green Downtrend Resistance Line (marked by my Green Arrow) and for the Rally to continue it needs to get through that Green Line very soon. If it can crack the Green Line then the next difficult Level is the Resistance from the recent Peak at 25402 - a move above this would suggest a move on the All Time High at 26617 might be on the cards but it needs to get over Resistance at 25800 which comes from the Peak on Tuesday 27th February. Next look at my Blue Parallel Lines which I had proposed were a possible Uptrend Channel from a few Weeks ago (note this current Chart is quite similar to the one I have been showing for Weeks and Weeks). Clearly the Bottom Line of these 2 Blue Lines (the Lower one in other words) has been overshot a few times so I am now suggesting that the real Floor to an Uptrend Channel is where my sort of Pinkish Line is which is pointed at by that outrageously oversized Pink Arrow but I just wanted to make it clear !!! Next look at how the 200 Day Moving Average (Black Arrow) and the 50 Day MA (Blue Arrow) are both rising - that is very positive behaviour. 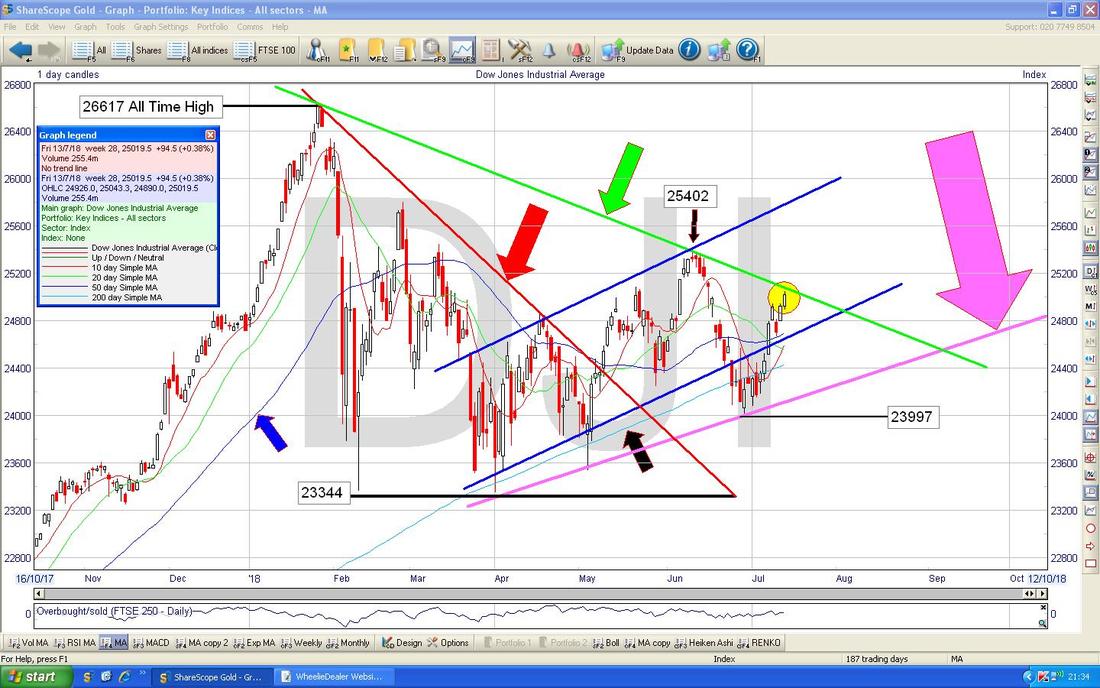
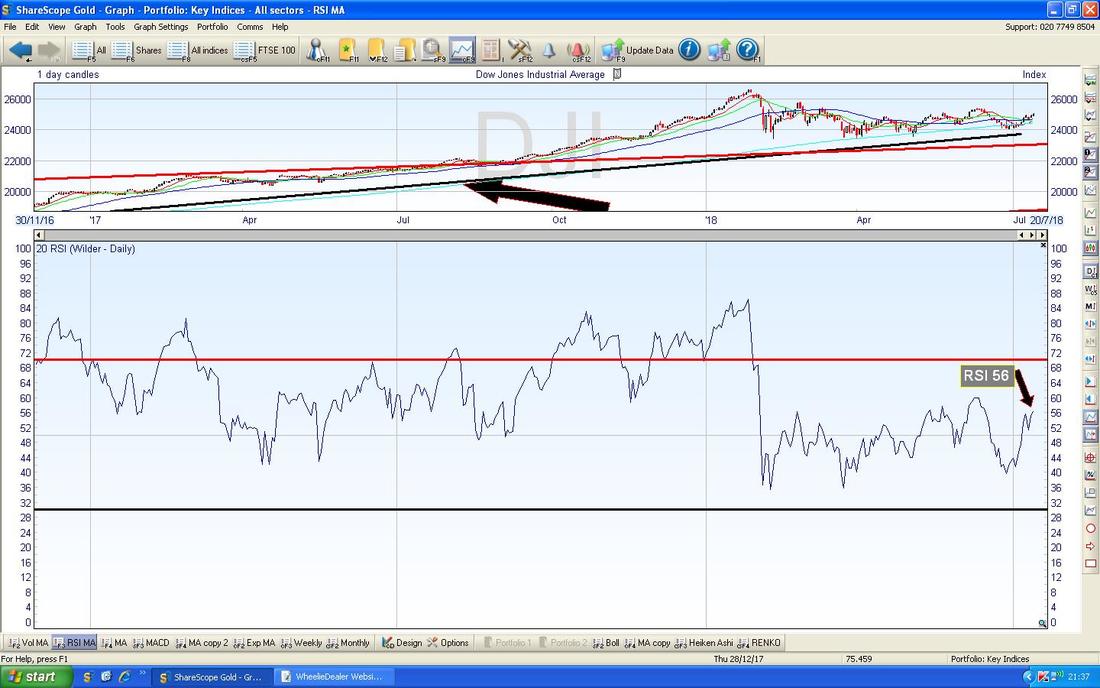
In the Bottom Window on the Screen below we have the RSI (Relative Strength Index) for the DOW Daily. On a Reading of RSI 56 this has loads of room to move up and this supports a Bullish scenario.
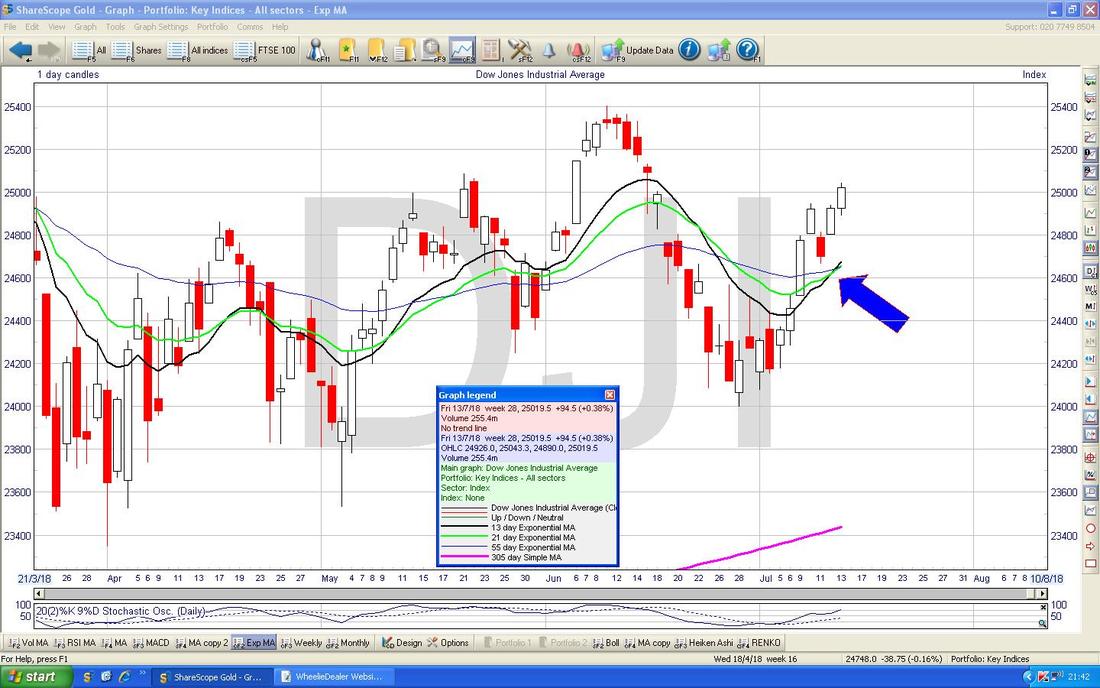
On my Screen below the Blue Arrow is pointing to where we recently got a Bullish ‘Golden Cross’ between the Black 13 Day Exponential Moving Average Line and the Green 21 Day EMA. This suggests more Gains to come in the Short Term - the next few Weeks perhaps.
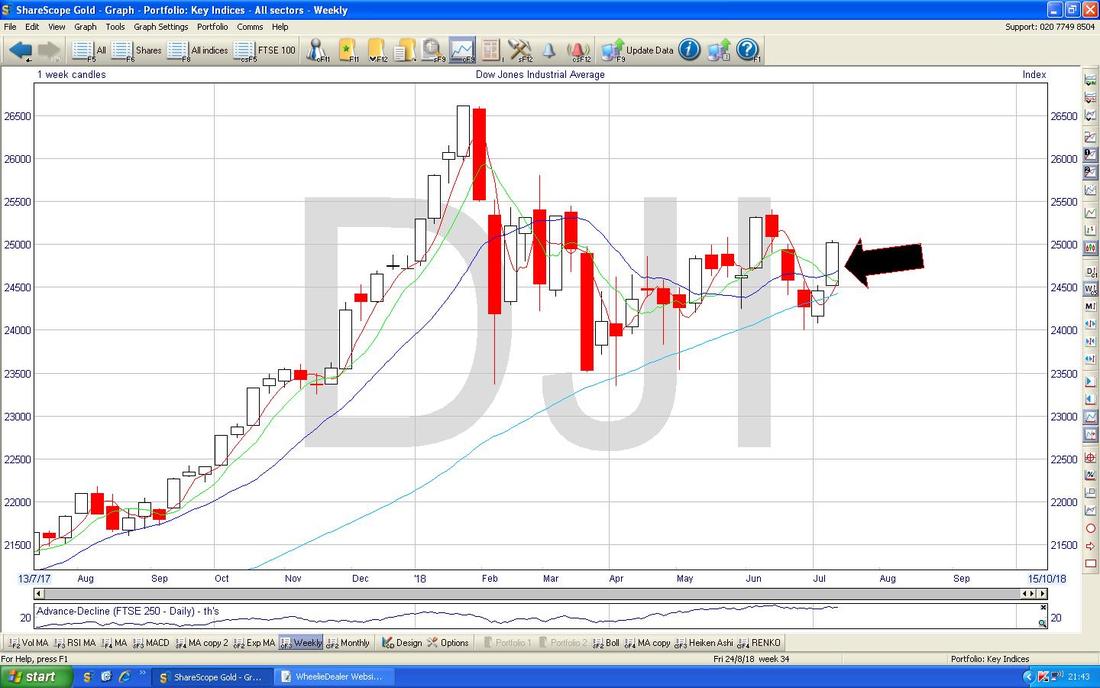
Now it’s the Weekly Candlesticks for the DOW - my Black Arrow is pointing to the Big White Up Candle from Last Week and this is Bullish.
Now we have the DOW Daily Candles with the Blue Wiggly Bollinger Bands above and below. My Yellow Circle is highlighting how the Candle from Friday is not far off the Upper Band now - it is possible that the Candles can ‘hug’ the Bands but the usual way things go is for it to drop back or go sideways once the Upper Band is hit. We shall see but it implies Resistance up at about 25200.
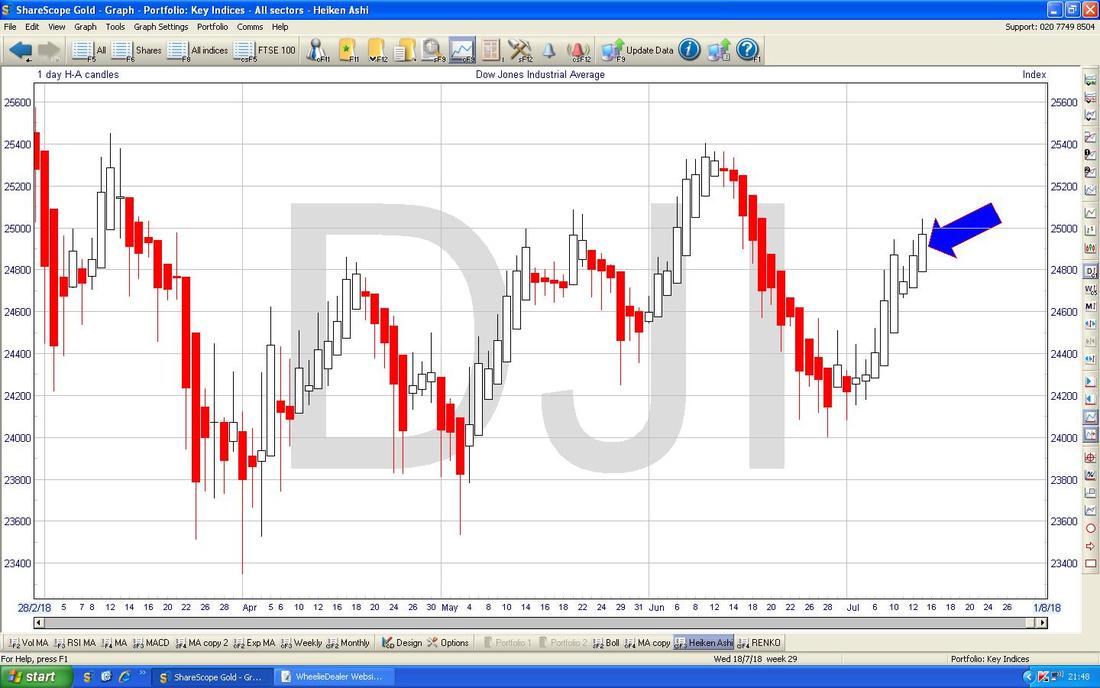
On my Chart below we have the Heiken Ashi Candlesticks - remember these are completely different to the usual Candlesticks I show so we must interpret them another way. In this case where my Blue Arrow is we have a Big White Up HA Candle and this is Bullish (the way these HA Candles work is that they go Narrow and Wide as they move and change colour - look at the Chart and you will see the pattern if you have a good imagination !!).
S&P500
There are similarities to the DOW here but on the Chart below we have the Daily Candles for the S&P500 and if anything it is a bit ‘ahead’ of the DOW with the Price currently above the Recent Peak which I have highlighted with my Yellow Circle. If you recall, on the DOW the Price had not quite got above the equivalent Recent Peak. My Grey Arrow is pointing to a Small Doji Candle from Friday and this doesn’t look as Bullish as the one on the DOW - it is possible that the S&P500 could turn down from this. However, there are several Bullish factors on this Chart such as the fact that early Last Week it managed to breakout of the Blue Downtrend Resistance Line which is marked by my Blue Arrow. In addition, the 50 and 200 Day Moving Averages are both looking very good as they are both rising. I won’t show the Chart but the RSI is reading RSI 60 which is not Overbought and is only a little ahead of the DOW RSI Reading. 
Now we have the EMAs again - this time where my Blue Arrow is we have a Bullish Golden Cross between the 13 and 21 Day EMAs - this suggests gains to come.
I won’t show them but both the Weekly Candles and the Heiken Ashi look Bullish and pretty much identical to the DOW ones. 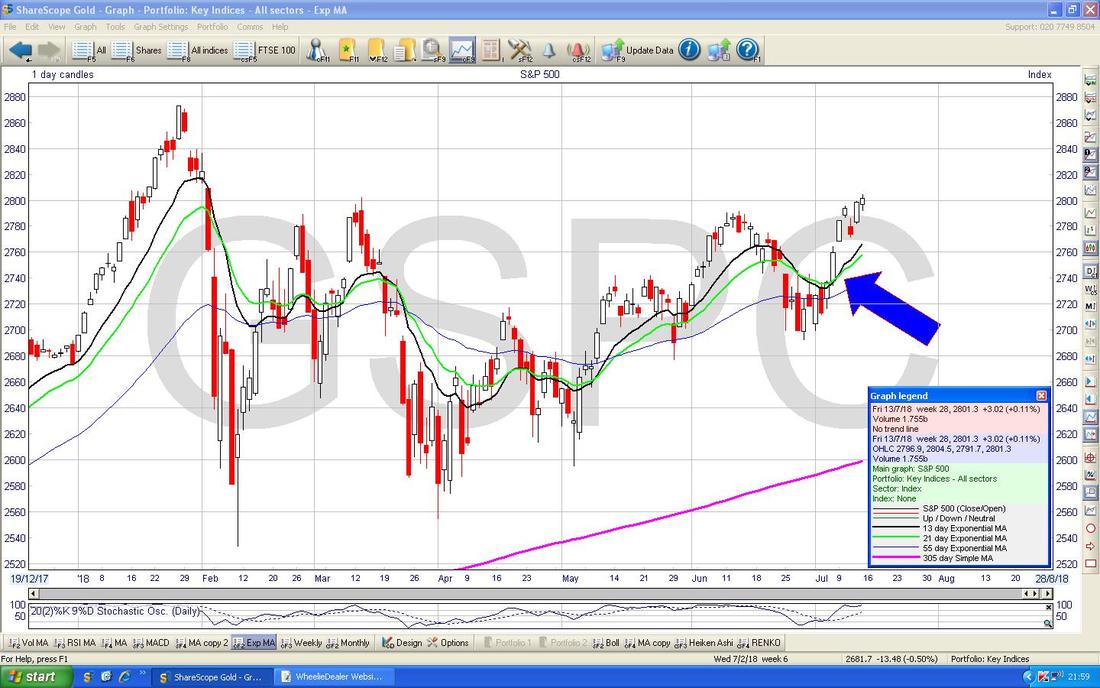
NASDAQ Composite
Last Week the NASDAQ Comp (US Tech) made a Fresh All Time High which is of course Bullish behaviour. However, on my Chart of the Daily Candles below note where my Yellow Circle is that we got a sort of ‘Star’ Doji or ‘Long Tails Doji’ or whatever you want to call it. This could be a Turning Point which means the NASDAQ might drop back but there is good Support nearby and the way this Index has behaved lately it doesn’t seem to Pullback for long. However, on RSI 62 (I won’t show this) it is not Overbought and if we do see a Pullback I suspect it won’t come to much. Apart from that Star Doji thing, the NASDAQ Comp is pretty similar to the other US Indexes. 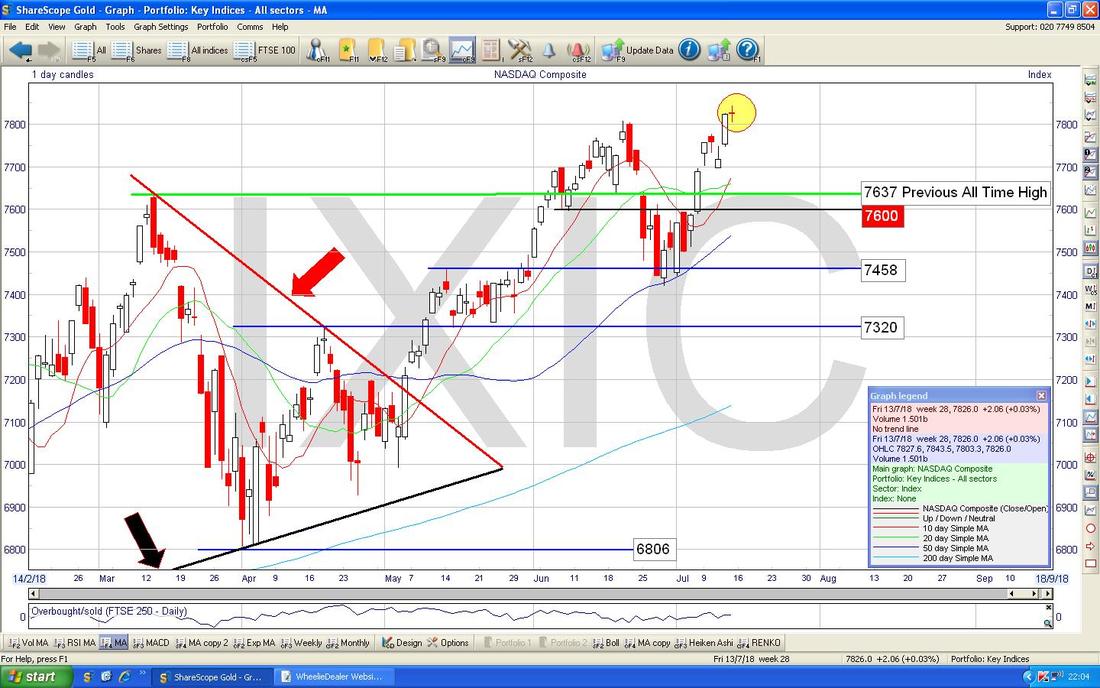
FTSE100
The Chart below has the recent Action on the FTSE100 Daily Candles. My Red Arrow is fingering (behave !!) an ‘inverted Hammer’ Candle from Friday and the important thing to note here is how the Level around 7716 which I have shown with the Blue Text Box has been Resistance for 4 Touches in recent Days. There is clearly Strong Near Term Resistance here and if the FTSE100 can Breakout above this Level, then that would be really Bullish. The Inverted Hammer and that Resistance suggest a Pullback but if the FTSE100 does drop then there is good Near Term Support at 7500 and around there. My Parallel Green Lines are marking a Downtrend Channel and note where my Green Arrow is the Upper Line is acting as Resistance - a Breakout over 7716 would imply a Breakout of this Downtrend Channel as well - doubly Bullish !! My Yellow Circle is showing a Bullish ‘Golden Cross’ between the 50 and 200 Day Moving Averages - this is very much in force and suggests Gains in coming Weeks and Months. Note also that the recent Price Action for about 4 Weeks seems to be hugging the 50 Day Moving Average Line (Blue Arrow). 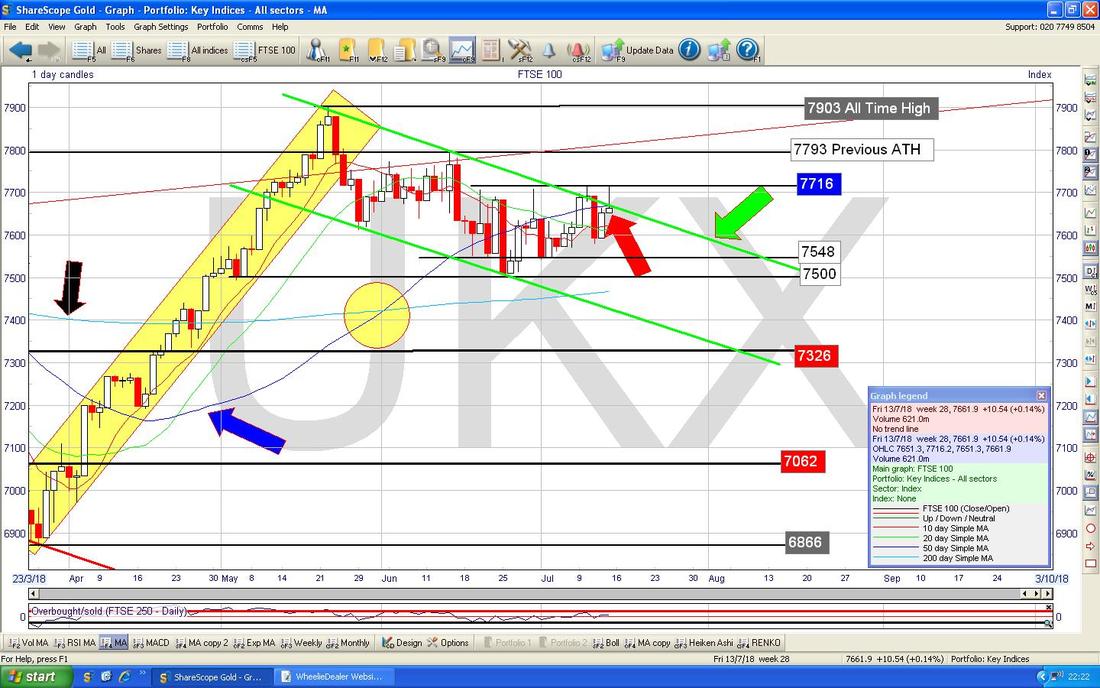
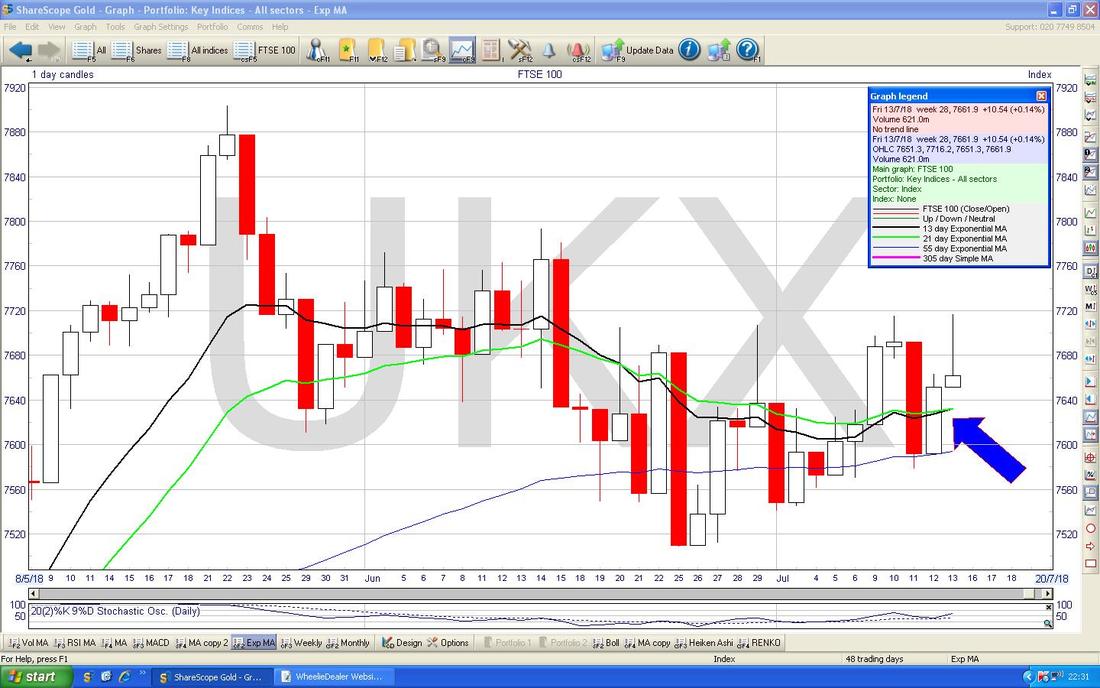
On the Chart below, my Blue Arrow is pointing to where we are very near a Bullish ‘Golden Cross’ on the 13 and 21 Day EMAs - if we get this then it implies a few Weeks of gains to come.
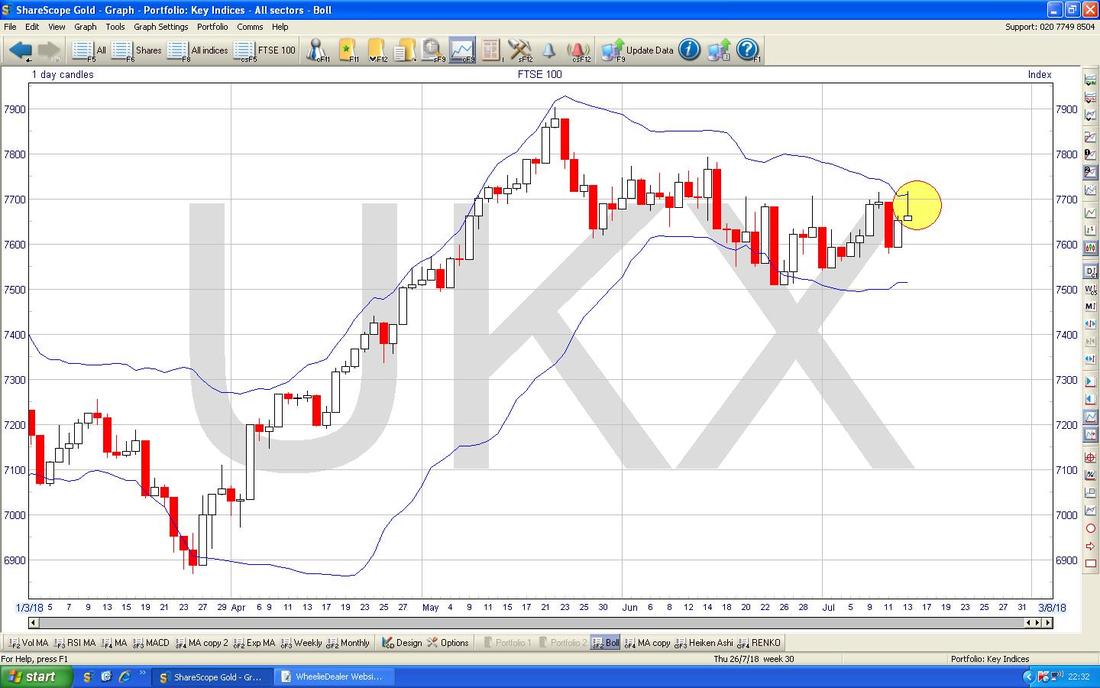
On the Chart below note how where my Yellow Circle is the Price touched the Upper Bollinger Band Intraday on Friday but then fell back.
FTSE250
On the Chart below we have the Daily Candles for the FTSE250 and note where my Green Circle is that we have an Inverted Hammer in a similar way to the FTSE100. My Yellow Box is highlighting a lot of Support not far below though. My Pink Circle is showing a Bullish Golden Cross between the 50 and 200 Day MAs - implies gains in coming Weeks and Months. 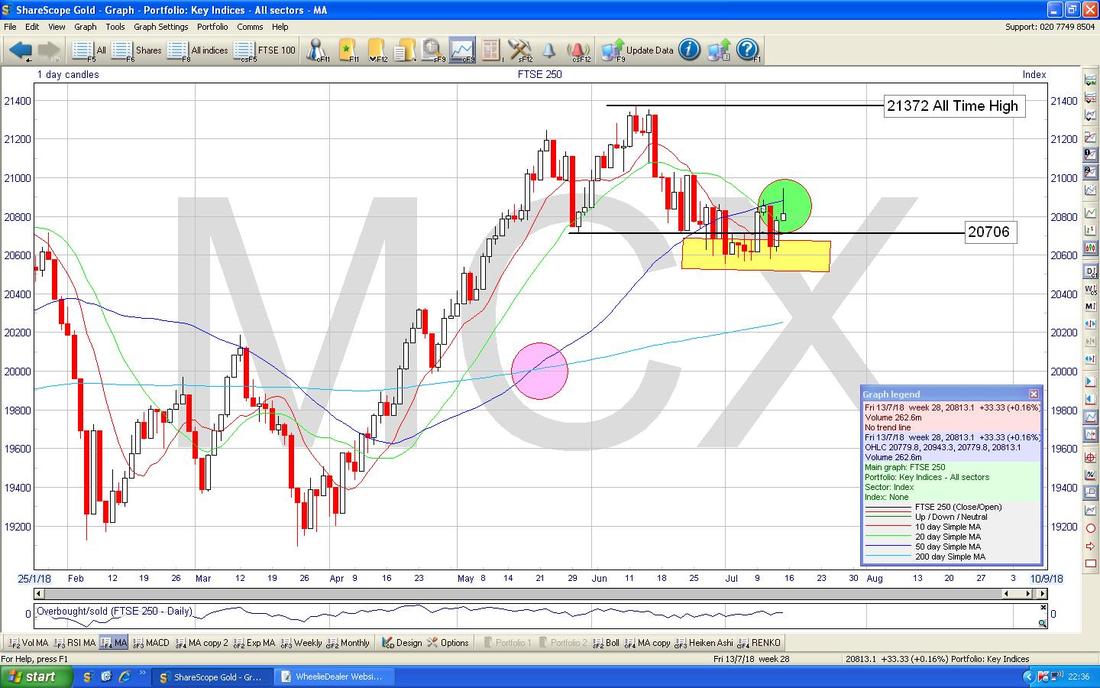
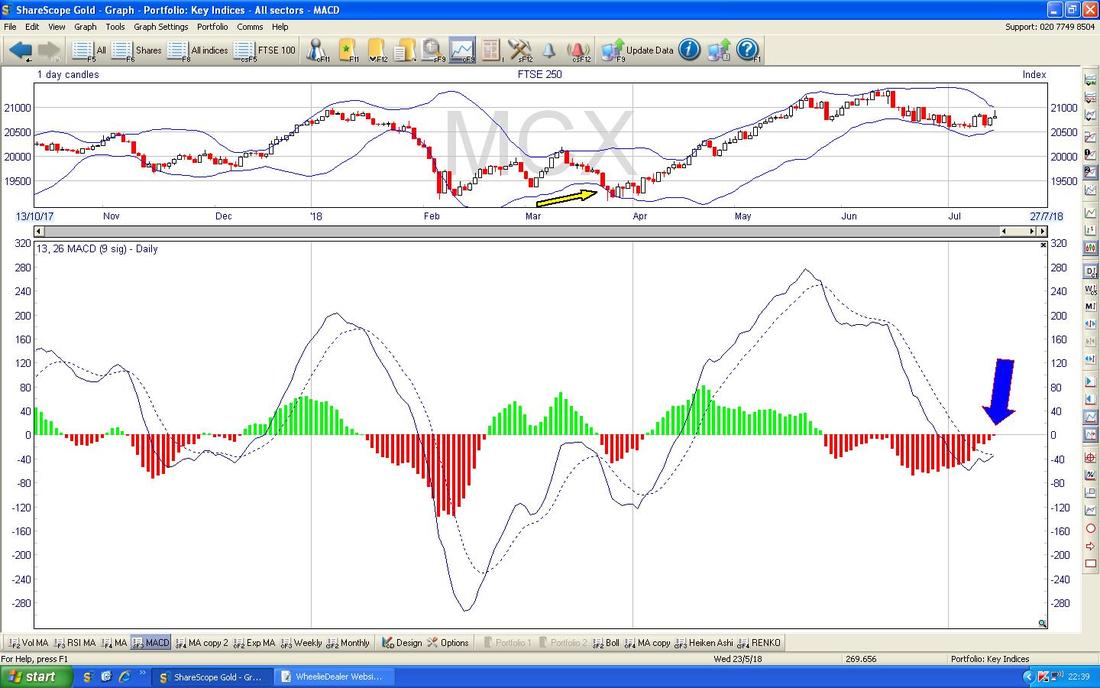
In the Bottom Window on the Screen below we have the MACD (Moving Average Convergence Divergence) for the FTSE250 Daily. My Blue Arrow is pointing to where we are on the verge of a Bullish MACD Cross - this is a short term indicator and I don’t find it all that reliable but it can help.
On the Chart below my Black Arrow is pointing to where we had a 13/21 Day EMA ‘Death Cross’ (obviously Bearish because you are Dead if a Bear gets hold of you, especially if he or she is ‘Cross’) some Days ago and this is still ‘in force’. We need a Bullish ‘Golden Cross’ to negate this Signal.
OK, I will leave it there. Good luck for the coming Week and remember to get time away from your Screens and to get out and enjoy the lush Weather !! Cheers, WD. 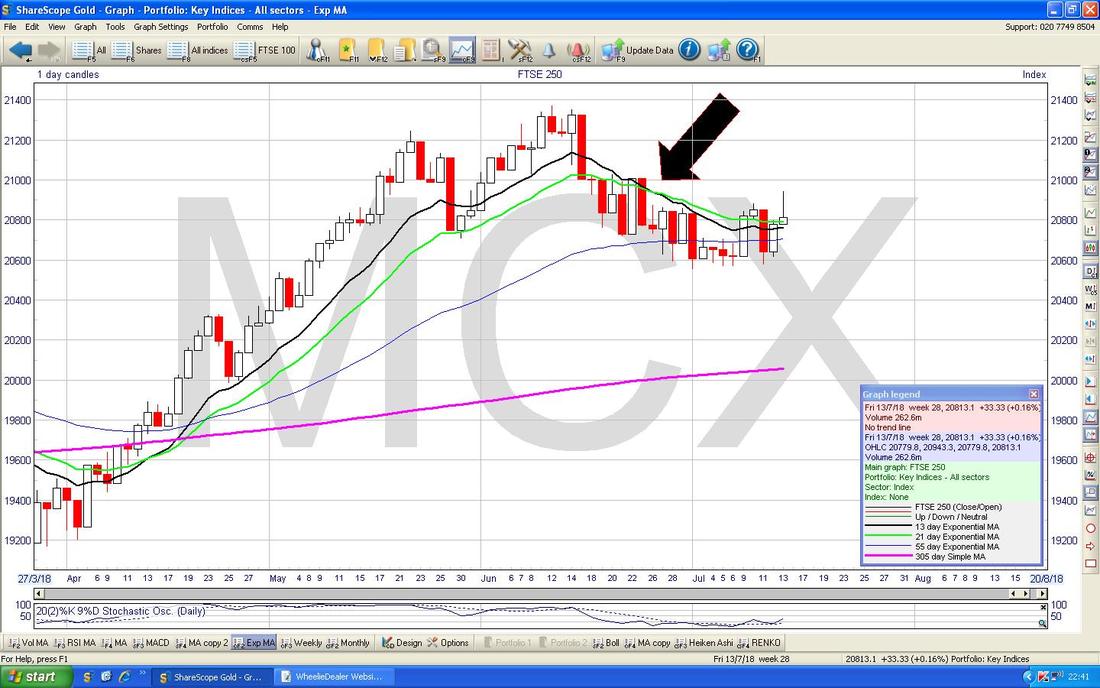
0 Comments
Leave a Reply. |
'Educational' WheelieBlogsWelcome to my Educational Blog Page - I have another 'Stocks & Markets' Blog Page which you can access via a Button on the top of the Homepage. Archives
May 2024
Categories
All
Please see the Full Range of Book Ideas in Wheelie's Bookshop.
|
