

|
educational blogs |
|
As always with these Blog Series, I have a rough idea of how they will pan out when I start on the early Blogs but as they develop I get to a point where I decide that it deserves some more Parts - hence you will note this is Part 5 of 7 and the next two will be looking at each of the Sector Classifications and highlighting particular Stocks that might be suitable for an Income Portfolio. This extension of the Series partly comes about from the size of each Part and the logical flow but it is also driven by my desire to ensure that at least 1 Part gets released each Week - I am sure this is what Readers want to see and also I am sure you appreciate that it takes me a while to bash them out.
How to Find Suitable Dividend Stocks I guess there are several routes to actually finding the Stocks you want to shove in your Income Portfolio but I will just mention 2 basic methods here which are very much how I tend to go about finding them:
Simply tripping over possible Candidates whilst going about my usual Stockmarket perusals
As a Full Time Investor I probably have a large time advantage over many Investors/Traders and of course I have the added benefit of not having distractions like Kids and stuff - this means I can focus on sniffing out Stocks in ‘Time Blocks’ which are highly productive and make the most of my Attention Span (the usual Human ability to focus on something, using the ‘Slow’ Brain, is probably in the region of 1 hour and that is assuming we are rested and in a good mood etc.). On a typical week day I am reading RNS statements and looking at Tweets etc. and reading Investors Chronicle etc. - these activities give me lots of exposure to Stocks in general but obviously as a subset of these I come across many Stocks that might be good for my Income Portfolio. In fact, if you scoot over to the ‘Little Black Book’ on the ‘WheelieBin’ page of this Website, you should be able to find listed many Income Stocks that I have thought decent enough to go in the Book. Once I have identified possible Stocks for my Income Portfolio it then becomes a process of Deep Thought and weighing up the suitability of a Potential New Stock to fit in with my other Holdings. Obviously when you are starting out and building the Income Portfolio from scratch you need to perhaps be more focused on Sectors (I discussed this in one of the earlier Parts of this Blog Series) and choosing the Stock you think best to fill such a Slot. No doubt for most Sector Exposure you will have several Candidates - for example, in the Oil Sector you could choose between Shell RDSB and BP. - I prefer (and hold) the former but many people might like the latter - I suspect both will be good holdings over time. These 2 WheelieBlogs from ‘The Archives’ give you more detail on how this ‘tripping’ over Stocks takes place: http://wheeliedealer.weebly.com/blog/how-i-find-potentially-great-stocks http://wheeliedealer.weebly.com/blog/wheelies-daily-roll Undertaking a ‘Screening’ Exercise This is an approach I don’t use all that often myself although when I first started my Income Portfolio I did do exactly this kind of thing. ‘Screeners’ are a Software Tool whereby you can set Parameters for various different Attributes of a Stock such as Historic P/E Ratio, Ratio of Debt to Profits, Dividend Yield, Forward P/E Ratio, Dividend Cover, PEG Ratio, 3 month Share Price Momentum, ROCE (Return on Capital Employed), Gross Profit Margins, etc., etc. In fact, on a sophisticated Screener such as that available on ShareScope and SharePad there are probably hundreds of Parameters you can muck around with - and ShareScope even has a ‘Slider’ so you can refine the Results of a Screen very easily. I use ShareScope myself but the Screeners I use are extremely basic and with regards to an Income Portfolio I am mostly focused on the Dividend Yield as my initial Screening Parameter although of course you can use other Parameters to bring more sophistication into your Screening. Personally I just want to highlight potential Candidates quickly and then to use more subjective and qualitative Analysis by myself to make my final Decisions on whether or not to Buy the Stock. Here is a ScreenShot of a ShareScope Screen with Parameters set around Dividend Yield on the FTSE350 (you can see the Parameters on the Right Hand Side) - I did this one on the Evening of Wednesday 15th November (as always if you click on the Picture it should get larger so you might have half a chance of being able to read it): 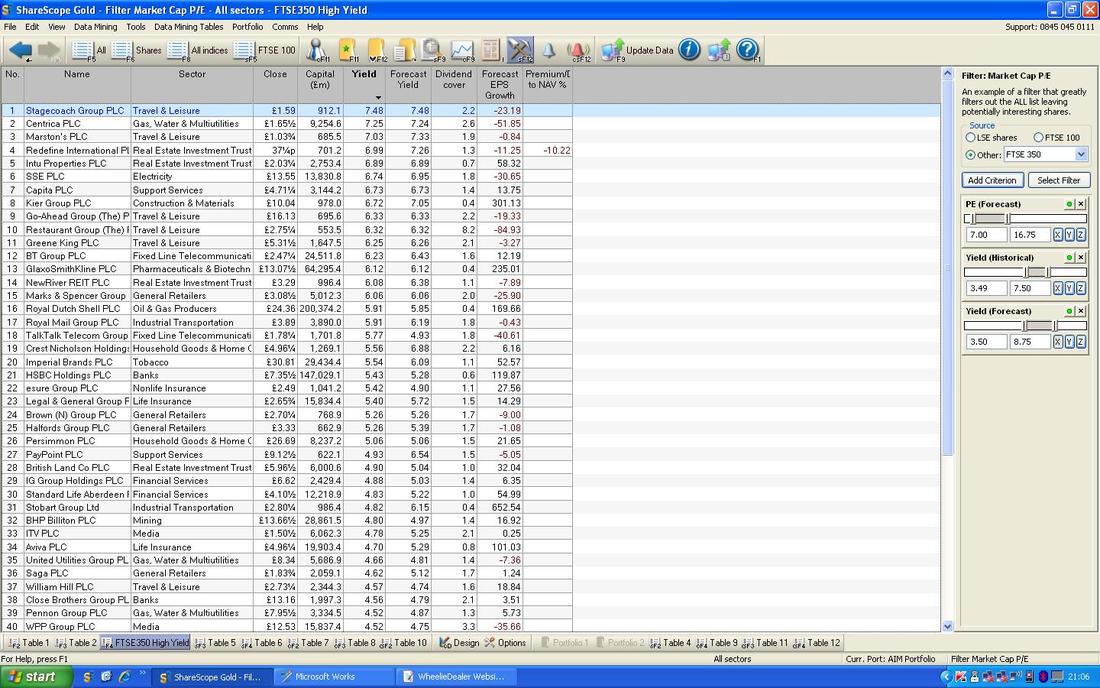
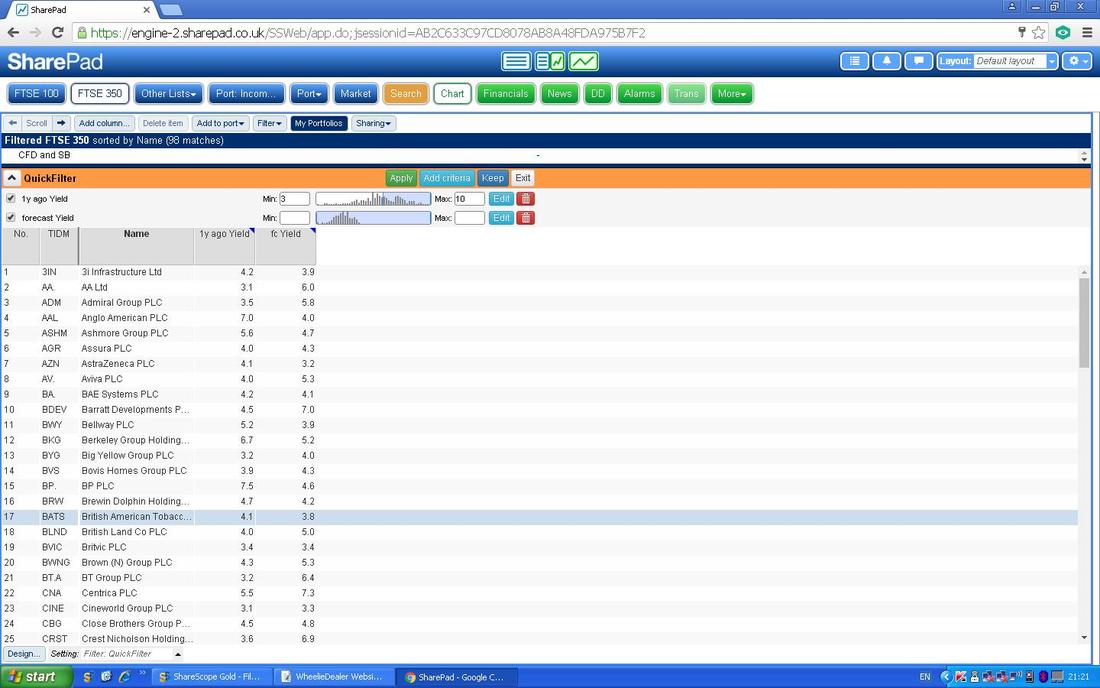
Here is a SharePad Screenshot which I also ran on the Evening of Wednesday 15th November - this is taken from my PC but you can do this using a Tablet which is one of the beauties of SharePad and a major difference from ShareScope which is not Online and you need to update a Database which sits on your PC (takes about 5 minutes on my old banger of a Netbook). I have no idea what I am doing with this SharePad Filter - it is the first time I have used it and I am not sure how to Sort the Order - I wanted to do it by Dividend Yield with the largest at the top - anyway, like with all these things you just gotta mess about with them (or perhaps using the ‘Help‘ button would be a good idea !!!):
The Tools mentioned above are Subscription based and you need to pay for them with a Monthly Fee (there is a Yearly option which gives you a bit of discount - I always do it this way) but for many people wanting a simple Income Portfolio you don’t really need to go to this expense - I use ShareScope/SharePad for my usual Share activities so it is an essential part of my ‘Toolkit’. If you are after a simple and suitable Screener then you can get a FREE one here:
http://www.iii.co.uk/markets/?type=stockfilter The ‘Useful Links’ page on my Website gets new Info put on it from time to time and the Link to this Screener is on that list if you ever forget where to find it. How to use the Interactive Investor FREE Stock Screener When you click on the link I provided above, you pretty much get the Screen shown below but on this one I have clicked on the ‘Sector’ Box and it has given me the ‘Drop Down Menu’ which is shown. In a later example I will use ‘Any’ but I wanted to show this because it means that if for instance you wanted an Income Stock in the ‘Health Care Equipment & Services’ Sector then you could click on this option and hugely narrow down the Number of Results you will get from doing the Screening Exercise. Note below the ‘Sector’ Box there is an Option for ‘Index’ - this could be useful because you can select FTSE100 or FTSE250 etc. 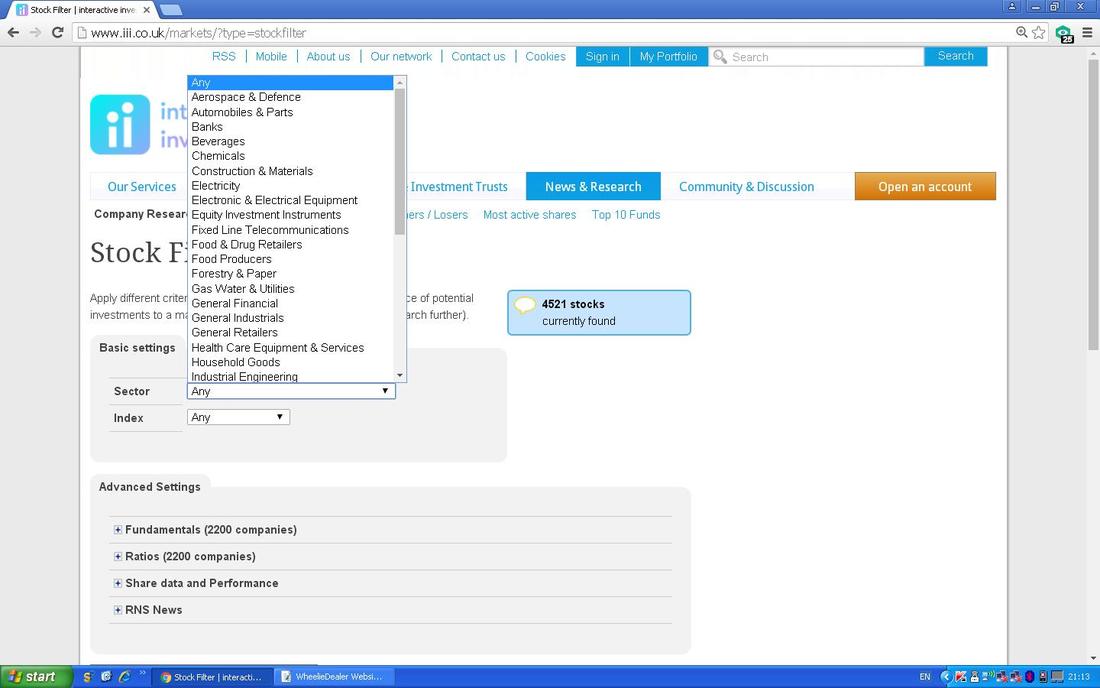
Further down you should see a Heading called ‘Advanced Settings’ - if you click on ‘Ratios (xxxx companies)’ then you should get a Screen similar to this one below (note I have selected the Index as FTSE100):
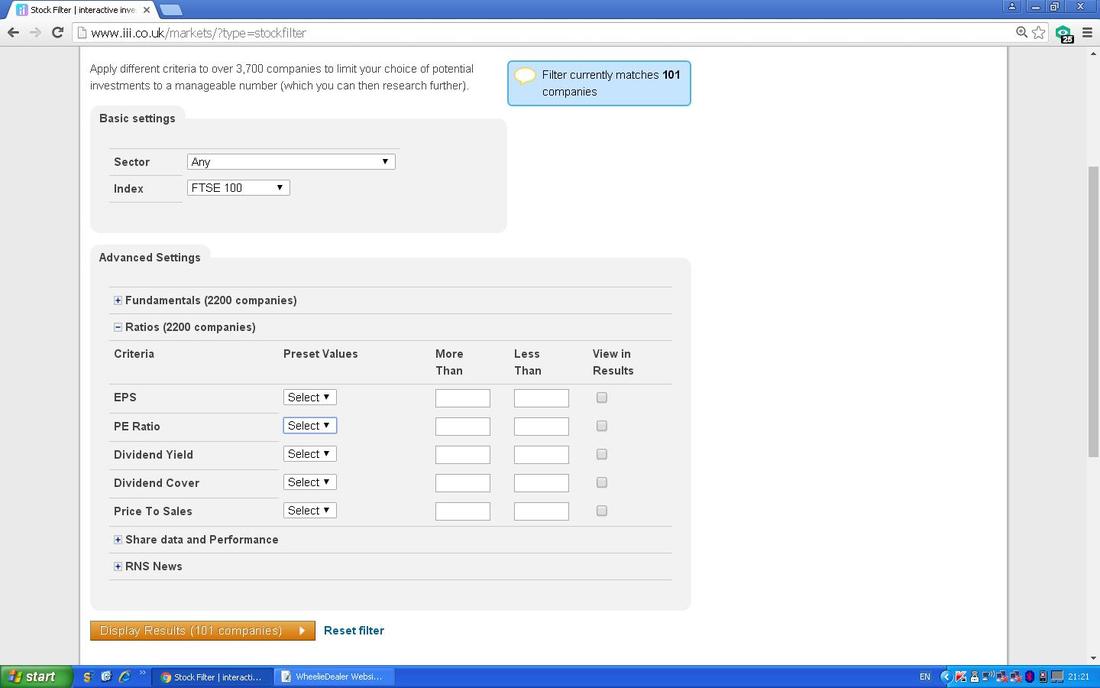
For sheer simplicity in showing you how the Screen works, I am just going to use the ‘Dividend Yield’ option and I have shown on the ScreenShot below the Dropdown Menu which appears under ‘Preset Values’ - you can of course use these but for my purposes I have used the Boxes to the Right to say that I want a Dividend Yield that is ‘More Than’ 3.5% and ‘Less Than’ 8%. As you change these numbers the Blue Box at the top with “Filter currently matches xx companies” alters.
For much more sophistication you can use the other Options like ‘Dividend Cover’ and ‘PE Ratio’ etc. - but I will leave it to you to play with these (I know you get bored at Work and with these Tools anyone walking past thinks you are hard at it feeding the Corporate Machine !!) 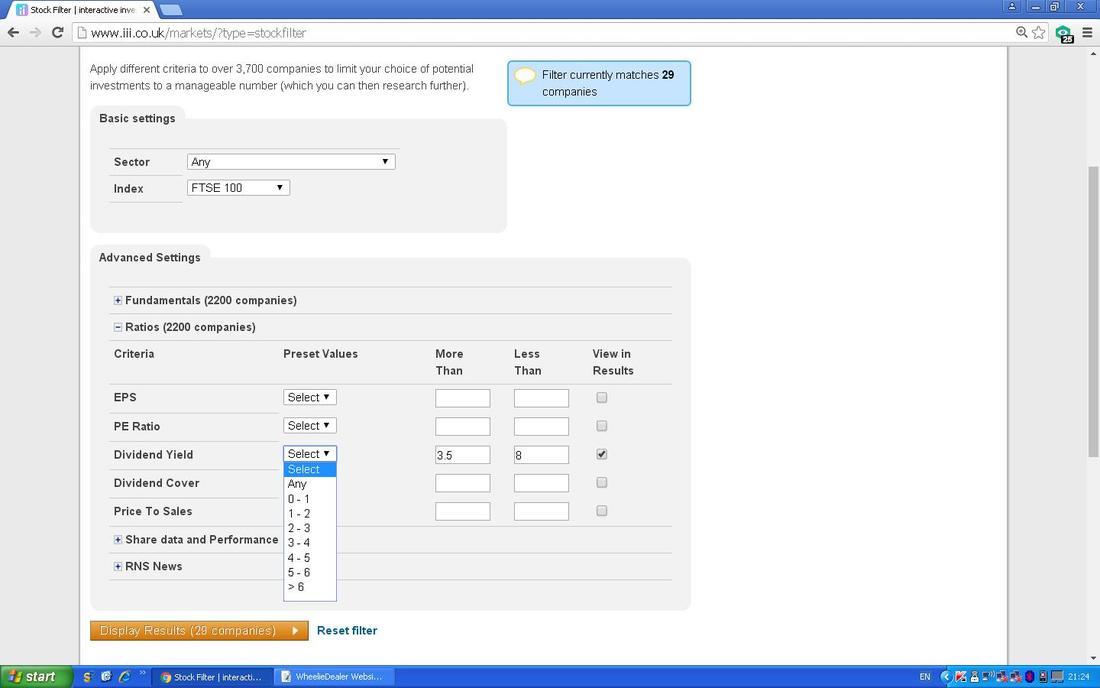
If you then click on the Big Orange Box at the bottom which says ‘Display Results (xx companies)’ you get the Screen below (obviously when you do it you might get different Companies coming up etc. - I did these on Friday 10th November 2017):
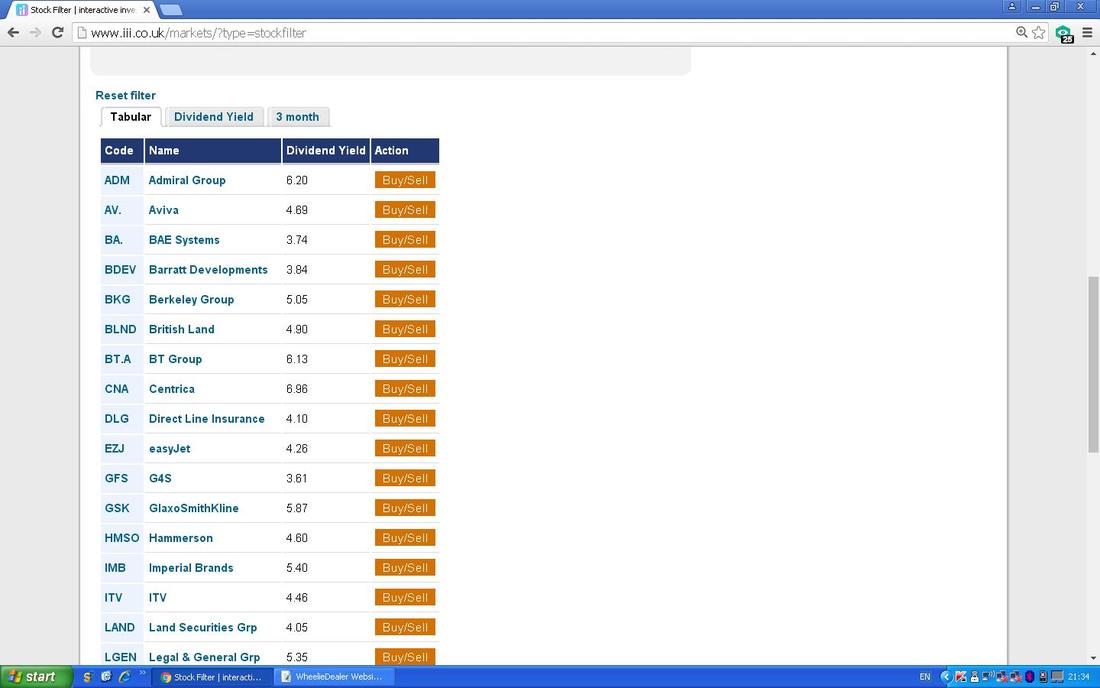
I am slightly disappointed by the fact it seems to list the Companies in Alphabetical Order but I guess for a Free Screener we can’t have miracles. Equally disappointing when I click on the Tab marked ‘Dividend Yield’ nothing comes up - I was hoping this would sort by Dividend Order. Anyway, as a bit of a consolation prize, when I clicked on the Tab marked ‘3 month’ I got this which I thought was pretty cool (Charts are very useful because they give you an idea of how the Price Trend is going and whether or not a Stock is High or Low or whatever - in many cases for Income Stocks I would be looking for something that moves up and down in a wide Range over time and I would want to buy near the bottom - provided that the Dividend Yield and the other Fundamentals stack up for me). If you click on the Company Names it takes you through to another iii Webpage which has lots of Fundamental info on that particular Stock.
That’s it for Part 5 - my intention is to do half the Sectors in Part 6 and the other half in Part 7 - the first of these should appear Next Week. Cheers, WD. 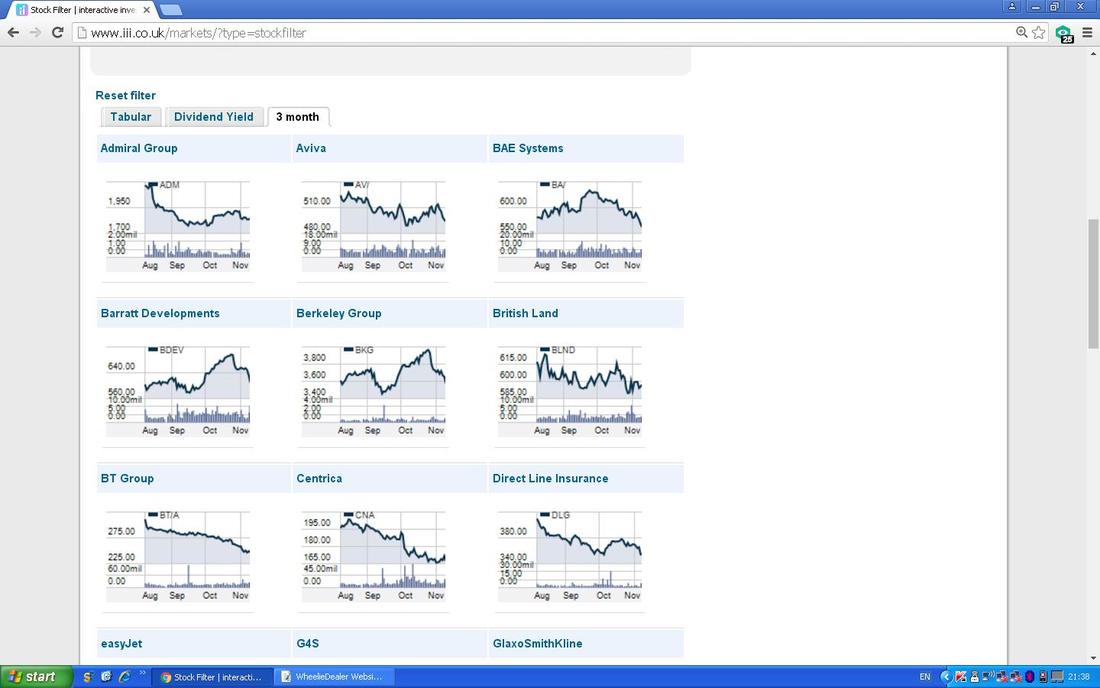
1 Comment
mr catflap
21/11/2017 01:55:43 pm
Strange. Both data sources giving different dividend. BAe, for example showing 3.79% vs 4.1%! Leave a Reply. |
'Educational' WheelieBlogsWelcome to my Educational Blog Page - I have another 'Stocks & Markets' Blog Page which you can access via a Button on the top of the Homepage. Archives
May 2024
Categories
All
Please see the Full Range of Book Ideas in Wheelie's Bookshop.
|
