|
I have no idea how much I can fit into this Blog as I am starting it quite late in the day after a pretty busy Weekend and with time seriously squeezed. Yesterday I went down to Swindon to see my Mum and Brother and after a lovely relax in the Sun at The Royal Oak pub at Wooton Rivers just outside Marlborough we went on to Devizes (past Silbury Hill and Avebury and various Long Barrows etc.) to see where my Mum grew up.
It’s quite strange because although I have known all my Life pretty much that my Mum came from Devizes I have never actually seen (or perhaps more importantly ‘appreciated’) where the House was and the environment/scenary in which she was a Little Girl etc. I’ve always known that her Father (my Granddad obviously) worked on an Estate doing Farm work but in my mind I had this image of flat Agricultural Land which I think was a ‘false memory’ that came about because when I was a Kid we must have driven through Devizes and my Mum and Dad probably said “oh, this is where your Mum comes from”.
But the reality was very different - it turns out that she grew up just outside Devizes near Rowde I think it is and Roundway (which had a Mental Hospital I think which doesn’t bode well !!) and it is very hilly and countrysidey and utterly beautiful. The House where she grew up is down in a Valley below the Estate Country Home place but it is such a scenic and picturesque place I totally didn’t expect that. My Mum is now nearly 83 and she is getting very frail and her memory is patchy but I am so pleased we did this while we still can and it was great to set some context about her early life that I just knew nothing about. Sadly I struggled to get clarity on how she got to School - she pointed out where it was in Devizes but she was very vague on how she used to get there from the House - she suggested that her Dad drove her sometimes but that seemed to only be on an occasional basis and it was a long way to the School.
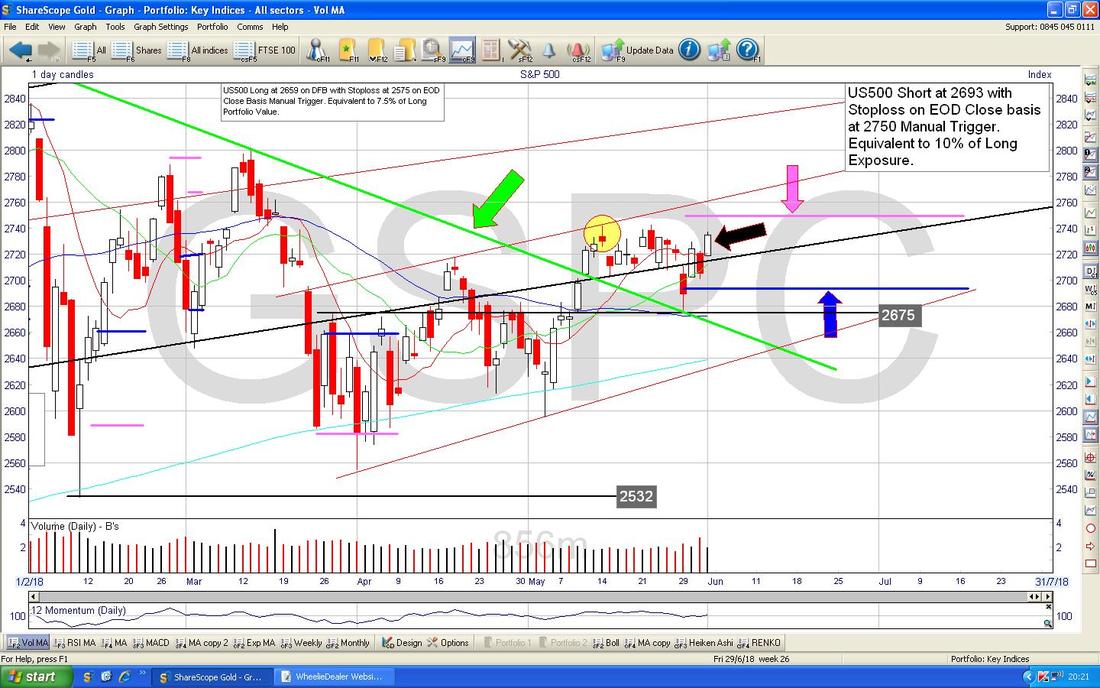
To all Readers I suggest that it is worth doing this sort of thing with your Parents if you still have them because they will probably enjoy it but it also was fascinating for me. It is the classic cliché that we only think of all the things we wanted to speak to our Parents about after they have gone. Today I have worked my butt off doing serious Dirt excavations in my Garden - I had a bit of a Compost Bin Disaster where the darned thing fell over and being a Paraplegic Wheelchair user I can’t just grab a Shovel and do 30 minutes of graft to sort it out - it has been an ongoing project for over a Week now but I do feel I am finally getting there. A while ago my mate Mark Otten suggested we should bury the Compost Bin deep into the Ground so that it was lower for me to chuck stuff into and I think doing this would also make the Bin more stable. So instead of begging a favour of Mark I have been steadily doing it myself (I need the exercise !!) and although it takes a long time I quite enjoy doing it as I think my Brain just loves repetitive and unthinking tasks and I find that my mind drifts off and thinks about all sorts of things and no doubt I was thinking about Stocks and stuff in there as well !! Last Week Well it was a short Week and we got off to a really bad start with Italy all kicking off and later in the Week we had Trump doing his Tariff thing and you can also chuck Spain into the mix. My Portfolio was down 0.9% overall but I am pretty relaxed about that and feel like I got off light really. I have a Small Short running on the S&P500 as a ‘Hedge’ to try to fend off some Market Downside Risk and if we see more strength in the coming Week to build on Friday then I will turn this Hedge off. Judging by how the Index Charts look as we will see in a bit, I would think the S&P500 is more likely to keep rising than to drop back. I am very tight for time next Week but at some point I will update the ‘Weekly Performance’ bit on the Homepage (although it might end up being the following Week) as May has now passed but looking quickly at my Numbers it looks like overall May was slightly positive for me but not by much. June is a bit of a concern because it has a pretty bad reputation being the 2nd Worst Month - so we could be in for some more ‘fun’. Nothing has changed for me on Strategy compared to pretty much what I have been doing all year. I am in no rush to Buy anything and am really just keeping an eye on things for opportunities to Topslice stuff if I need to and I am keen to Hedge if it looks like Markets could be going south. I expect to have a very relaxing Summer and will just be keeping things ticking over. I am not too concerned by all this Tariff Talk - I think it is most likely Trump doing his usual posturing and outrageous claims etc. before further Talks and stuff mean that very little changes. It is worth noting that after an earlier tantrum about Tariffs the Chinese actually did address some of the US’s concerns over Trade Imbalances. The Europe thing is much more of a problem possibly - there is no doubt that the People of Europe are very unhappy with the EU Policies on Austerity and Immigration and Voters are flocking to ‘Populist’ Parties while Rome Burns and the EU Eurocrats fiddle away as per usual. I heard on the News tonight that in Slovenia the same thing was happening where the ‘Far Right’ Party looks likely to win their Election. I struggle to see how the EU can come out of this intact (and note George Soros who is fanatically Pro-EU has serious doubts as well) as the Straitjacket of the Euro Currency means that the only available solutions are to either have huge Transfers of Cash from Germany to the South of Europe or for the Eurozone to collapse and Italy, Greece, Portugal, Spain etc. etc. to get their own Currencies and to devalue. Knowing how ineffective and inactive the EU always behaves, it is impossible to see this ending in a good way (if you remember, it was SuperMario saying he will do “whatever it takes“, that avoided the last Eurozone Debt Crisis flare up - but since then the Politicians have done precisely nothing to solve the problems). If the Eurozone collapses (the most likely scenario as there is no way Germans will be happy to pay more for the EU, they are also flooding to the Right Wing AFD Party), expect big problems in the Markets. We are not there yet, but it could happen in the next few Years. And of course we then have Brexit and I haven’t even bothered with Immigration which is yet another huge challenge to the EU which it has totally not addressed. Memory Lane Here are some Blogs on Investor vs. Trader etc. Note at the bottom of Part 2 the link to Wheelie’s Bookshop is wrong because the WheelieDealer2 Website still exists but I have not updated it for years now. The Bookshop is obviously on this ‘main’ Website. http://wheeliedealer.weebly.com/blog/where-are-you-on-the-trader-investor-spectrum-part-1-of-2 http://wheeliedealer.weebly.com/blog/where-are-you-on-the-trader-investor-spectrum-part-2-of-2 Blog Slate Last Week I put out Part 1 of the PHP Buy Rationale Blogs and I need to get on with Part 2 but I suspect that might get delayed because this coming Week I am up to my eyeballs in chores and the Isle of Man TT is on and that means I will be glued to ITV4 every night at 9pm to see just how crazy the Riders are this Year - it looks like 135mph average will tumble this year which is nuts because I can remember when 120mph was seen as something amazing and I think 130mph only tumbled a few years ago (Dean Harrison did 134.4mph on Friday just before his Bike blew-up). I’ll see what I can do and I will issue some sort of Blog but it might not be the PHP one yet - I think I should have time on the following Week to get that done. I have a few good Drafts already created so something will appear. S&P500 As always, the Charts I will show are ScreenShots taken from the ShareScope software that I subscribe to. If you click on the images they should grow larger for you to be able to see more detail. The Screen below is my actual ‘Working’ Chart on which I am monitoring the Small Short I have on the S&P500. This Chart has the Daily Candlesticks and the Blue Arrow is pointing to where I Opened the Short at 2693 after the Panic on Monday last Week and the Pink Arrow and Pink Line are marking where my Stoploss is placed (note this is a Manual Stoploss which I will trigger myself if the Price goes above that Line - although I can always Close it earlier if I want to). The Yellow Circle is highlighting an Inverted Hammer Candle from Monday 14th May and this Candle was the determinant of where I put the Stoploss - you should be able to see I have the Stop slightly above the Top of this Candle. Look how the Price Candles broke-out of the Green Downtrend Line (this was part of the Triangle I was going on about for recent Weeks) and note that after moving up to where the Yellow Circle is, the Price dropped back and then Last Monday (4 Candles back) the Price touched that Green Line and this could be a ‘Confirmation’ of the Breakout (former Resistance becomes Support) and at the end of Last Week we got a nice White Up Candle on Friday which is where my Black Arrow is. It is very possible that the Price now moves in a Range between around 2675 at the Bottom and 2742 at the Top (just under my Stoploss Line) and only if we get a Breakout of that Top Line will we be able to feel more Bullish. Alternatively, if the Price drops down below 2675 that would not be a good sign.
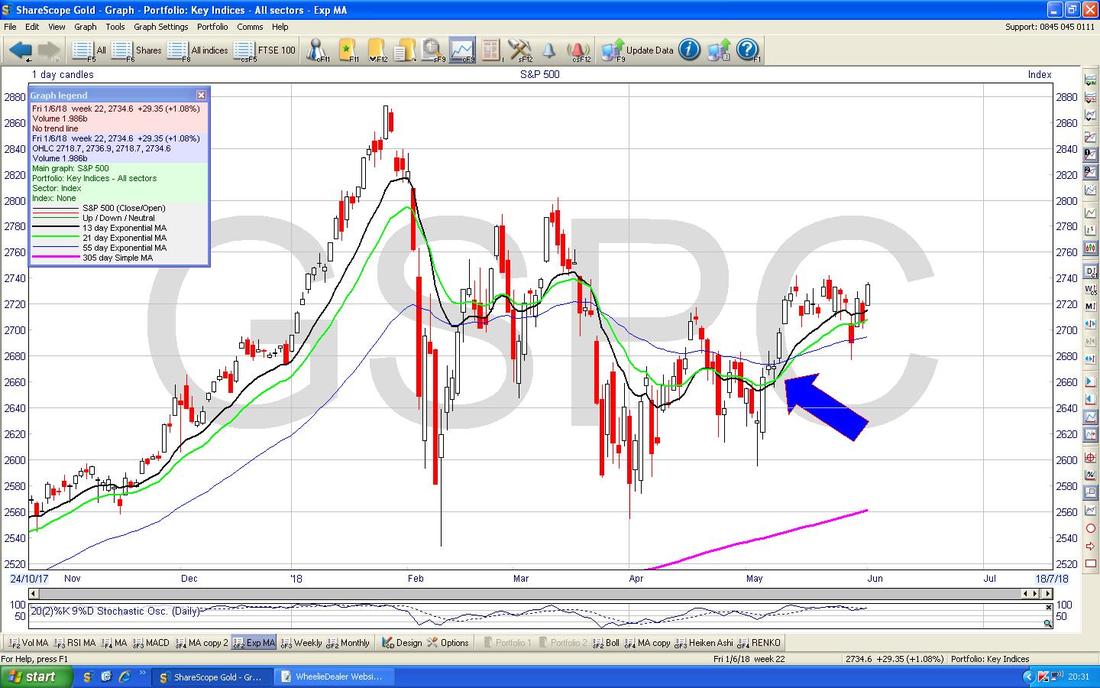
Below we have one of the most useful Indicators there is. Readers who are awake might notice that I have changed the Colours here but what we have where my Blue Arrow is is a ‘Golden Cross’ between the 13 Day Exponential Moving Average (the Black Wiggly Line) and the 21 Day EMA which is the Green Wiggly Line). At the moment that Golden Cross is still ‘in force’ and until we get the opposite Cross (a ‘Death Cross’) we should be safe on the Bullish tack.
Note when I placed my Short last Week it was as ‘Insurance’ because the Italian situation was looking very messy but that actually got sort of resolved in the short-term anyway. On the Night I put the Short on the 13/21 Day EMAs were very near doing a Death Cross but perhaps I should have held off until we got the Trigger - as always though any Trades we put on are rarely as a result of One Factor - and lots of others were suggesting it was wise to Hedge a bit. Sensibly I did only do a very Small Position.
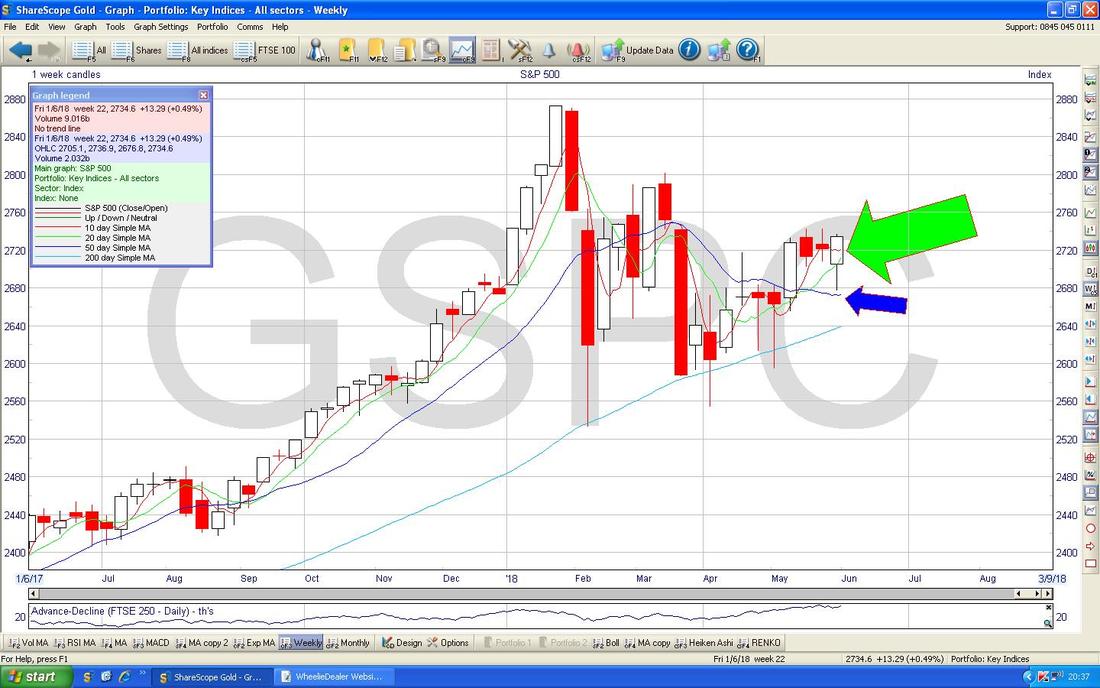
Next we have the Weekly Candles for the S&P500. My Green Arrow is pointing to a White Up Candle but note how it has a bit of a ‘Tail’ or ‘Wick’ pointing downwards but note also that this Tail found Support at the 50 Day Moving Average (where my Blue Arrow is). Next look at how the ‘Body’ of the Candle from Last Week ‘Engulfed’ the Candle from the Week before - so we have a ‘Bullish Engulfing Candle’ perhaps.
On the Chart below we move to the Monthly Candles now that we are into June. My Black Circle is catching a tiny Candle which is to be ignored because this is the June Candle forming up and so far we have only had Friday so it is irrelevant. My Green Arrow is pointing to the Monthly Candle for May and despite some ‘Tails’ we got mainly a nice White Up Body and this looks Bullish after the ‘Spinning Top’ Doji or ‘Long Tails’ Doji from April (pointed at by my Blue Arrow). It certainly looks like the 2 Red Down Candles from February and March had their Fall broken by the Doji from April and now in May we have turned up again.
Note where my Black Arrow is that the Price has been obeying Support from the 200 Day Moving Average very well.
Dow Jones Industrial Average DOW
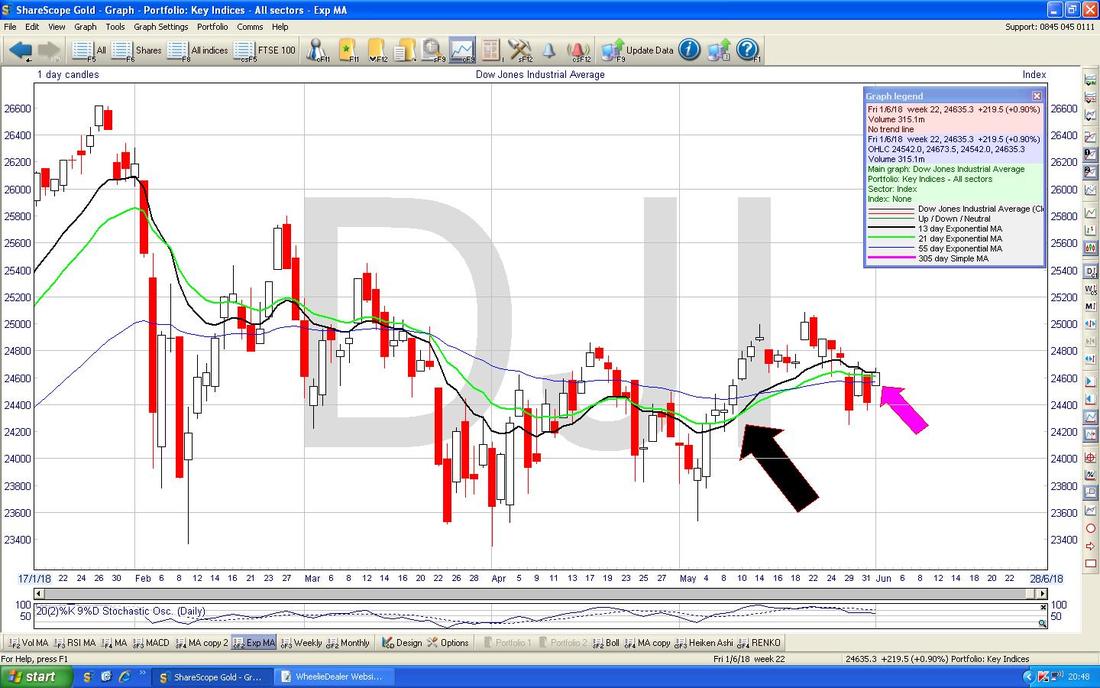
My Chart below has the Daily Candles for the DOW and my Pink Arrow is pointing to a Small Up Candle from Friday and bear in mind how that was much less impressive than what we saw on the S&P500. Anyway, the reason I am showing this Chart is because where my Black Arrow is we had a 13/21 Day EMA ‘Golden Cross’ and note that is still ‘in force’ but I want to draw attention to how the Black 13 Day EMA Line is very near the Green 21 Day EMA Line and if we get a ‘Death Cross’ then that would obviously be bad news. It would be very unusual I think to have a disparity with the S&P500 but it is possible so we must monitor how this plays out.
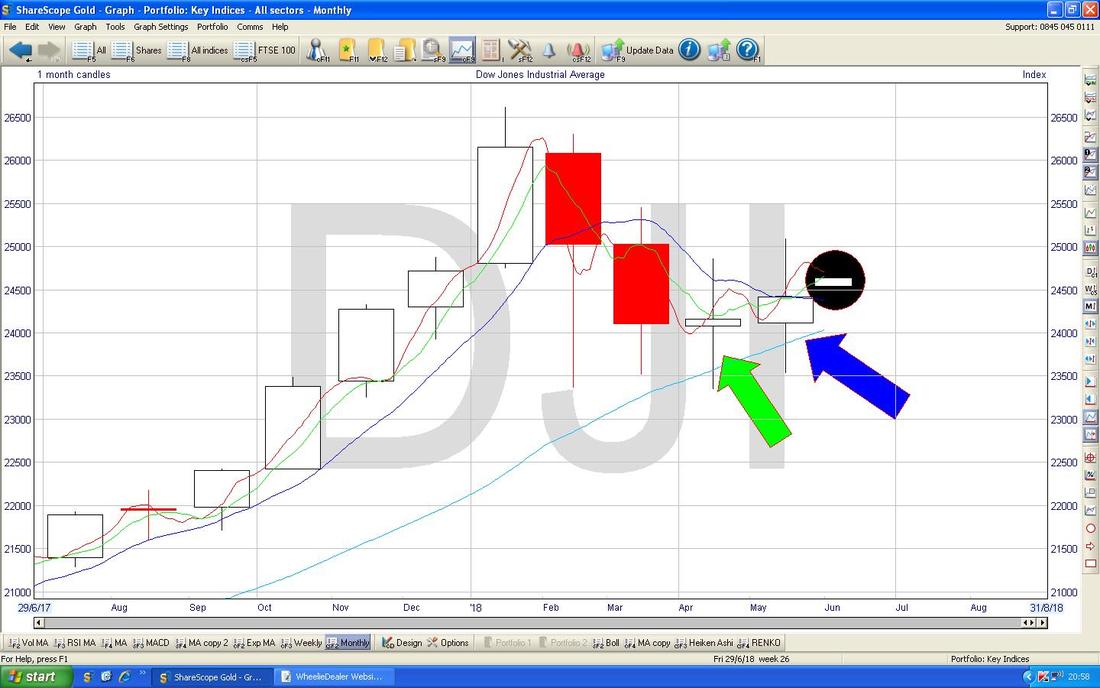
Next we have the Monthly on the DOW. Again ignore the Black Circle stuff and my Blue Arrow is pointing to a ‘Spinning Top’ Doji or ‘Long Tails’ Doji which is pretty much what we had in April also where my Green Arrow is. I am not sure we can infer much from this - the Monthly Candles on the DOW are certainly not as clear cut as on the S&P500 (I suspect this is partly because there is more of a Tech Sector involvement in the S&P500). Note again the DOW Candles have been obeying Support from the 200 Day MA pretty well.
Nasdaq Composite
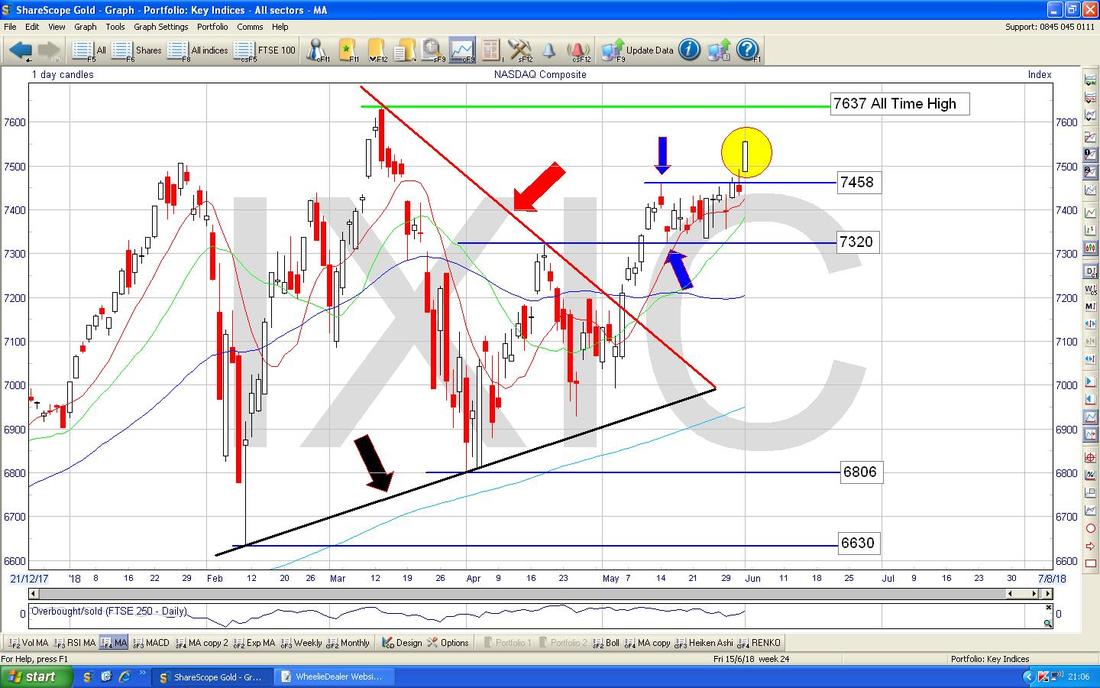
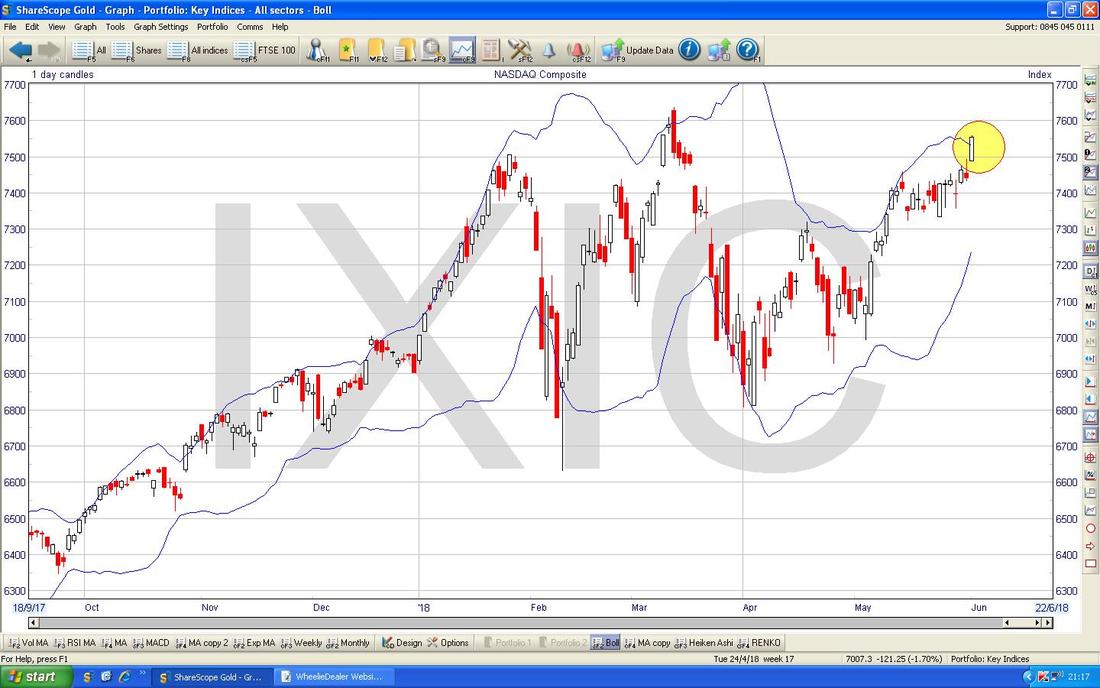
The Chart below has some similarities to ones I have shown in recent Weeks but I won’t talk about all the features on here. The main thing to note is my Yellow Circle which is enclosing a Big White Up Candle from Friday and note how this was a Breakout of the Sideways Range between 7320 and 7458. This is extremely Bullish Behaviour and I suspect we will see the All Time High at 7637 challenged very soon and another Breakout above this ATH would be Super-Bullish. This strength on the Nasdaq US Tech Index is what I meant about the S&P500 having more Tech exposure than the DOW.
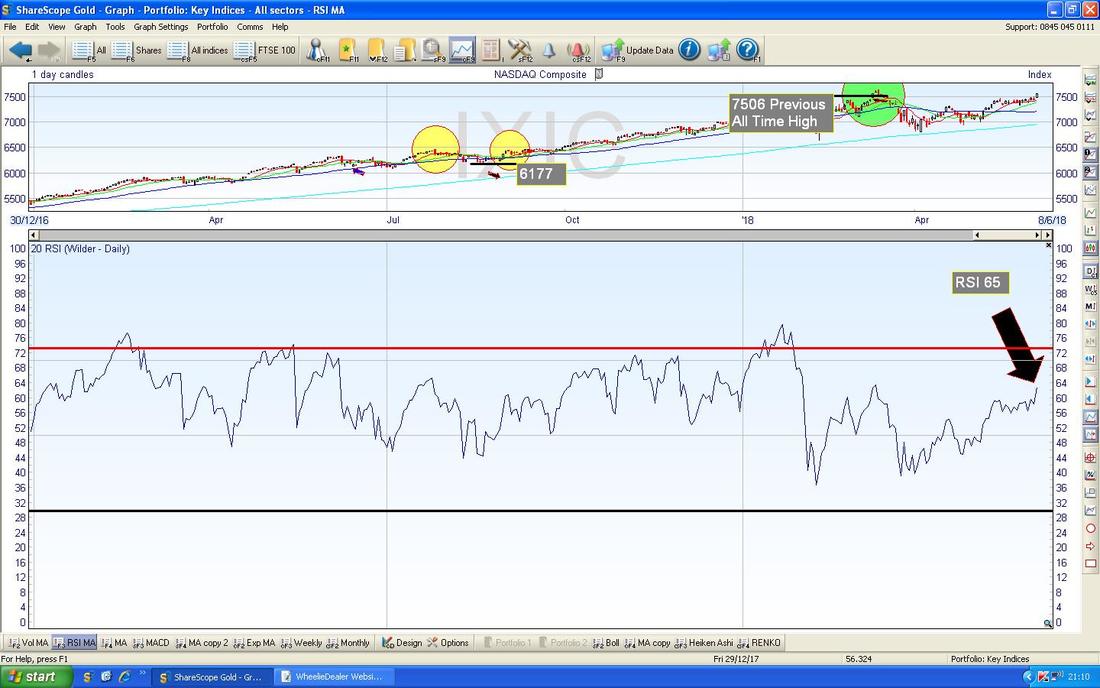
In the Bottom Window on the ScreenShot below we have the Relative Strength Index (RSI) for the Nasdaq Comp Daily. On a Reading of RSI 65 from Friday despite the strong move up there is plenty of scope for the RSI to go much higher and this supports the idea that we will see the All Time High challenged soon.
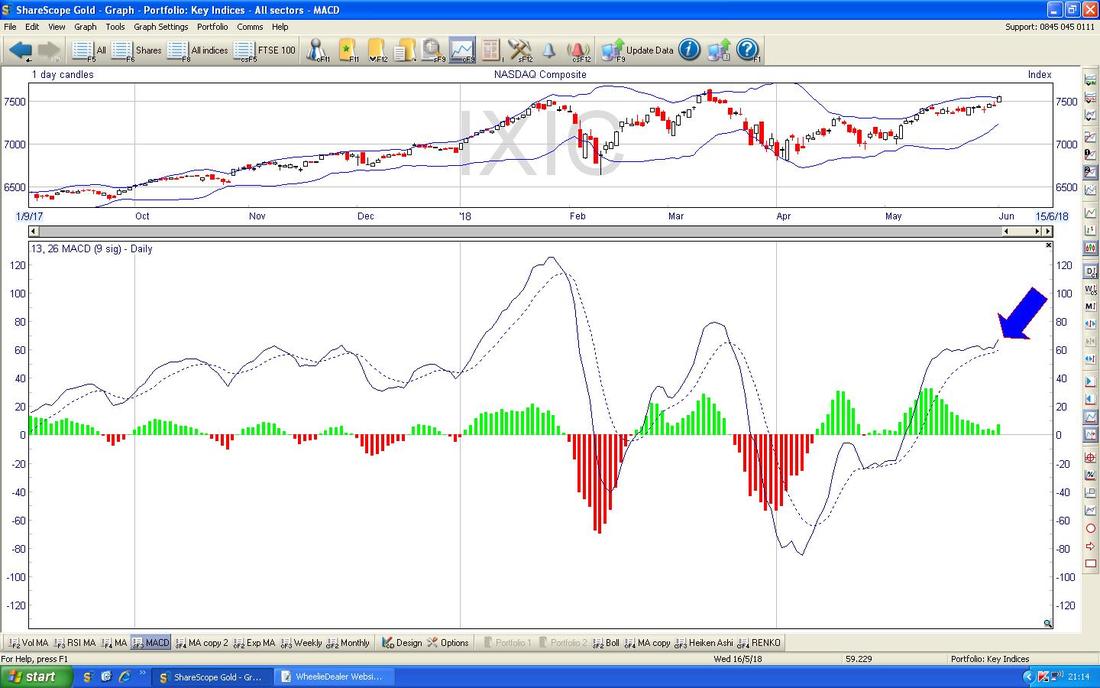
In the Bottom Window on the Screen Below we have the MACD (Moving Average Convergence Divergence) for the Nasdaq Comp Daily. I am showing this because it is a superb example of a very Bullish but rare event which is where my Blue Arrow is because we have a ‘Glance off’ or ‘Skim off’ where the MACD was setup to do a Bearish MACD Cross but in the event it avoided this and the ‘Signal Lines’ flicked up.
On the Chart below we have the Daily Candles for the Nasdaq Comp with the Blue Wiggly Bollinger Bands above and below. Where my Yellow Circle is note how the Candle from Friday Closed just outside the Upper BB - this is not usually a sustainable situation and we normally see the Price drop back a bit or go Sideways from here for a bit.
FTSE100
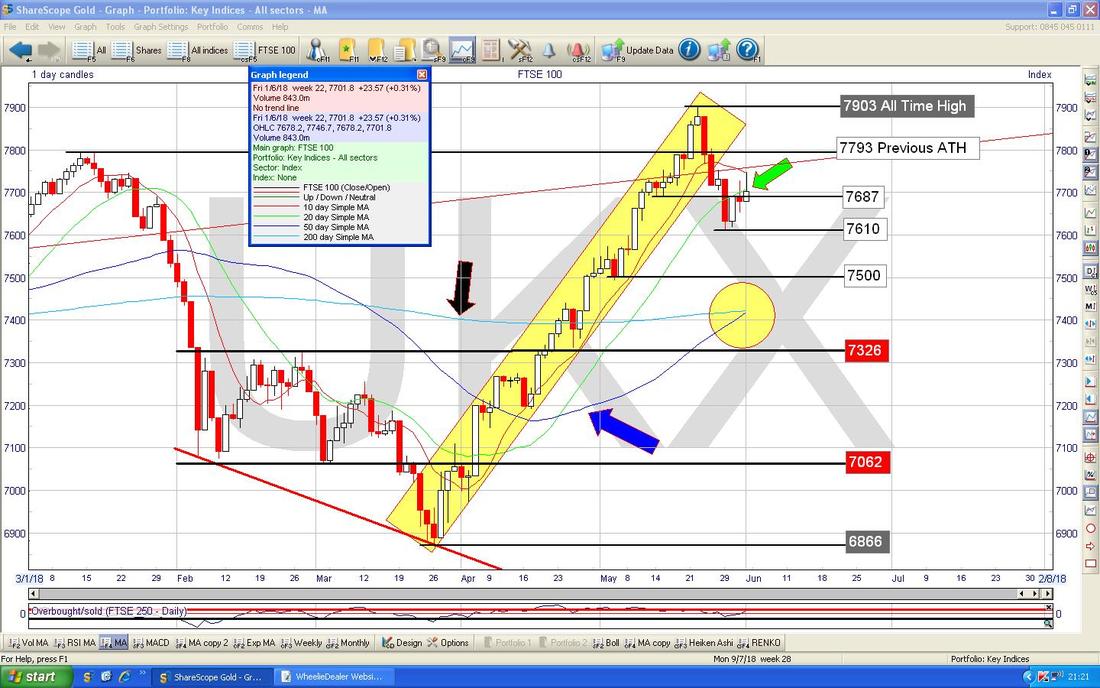
Below we have the Daily Candles for the FTSE100 and this Chart is largely similar to ones I have used in recent Weeks. My Green Arrow is pointing to an ‘Inverted Hammer’ Candle from Friday and note how the Intraday High was at 7746 and that level will be Resistance from here. On the Downside there is Support at 7610 which must hold or we could see the FTSE100 fall lower. Where my Yellow Circle is though we are getting a Bullish ‘Golden Cross’ on the 50/200 Day Moving Averages - this is a very good thing to see and suggests Weeks and Months ahead of upside.
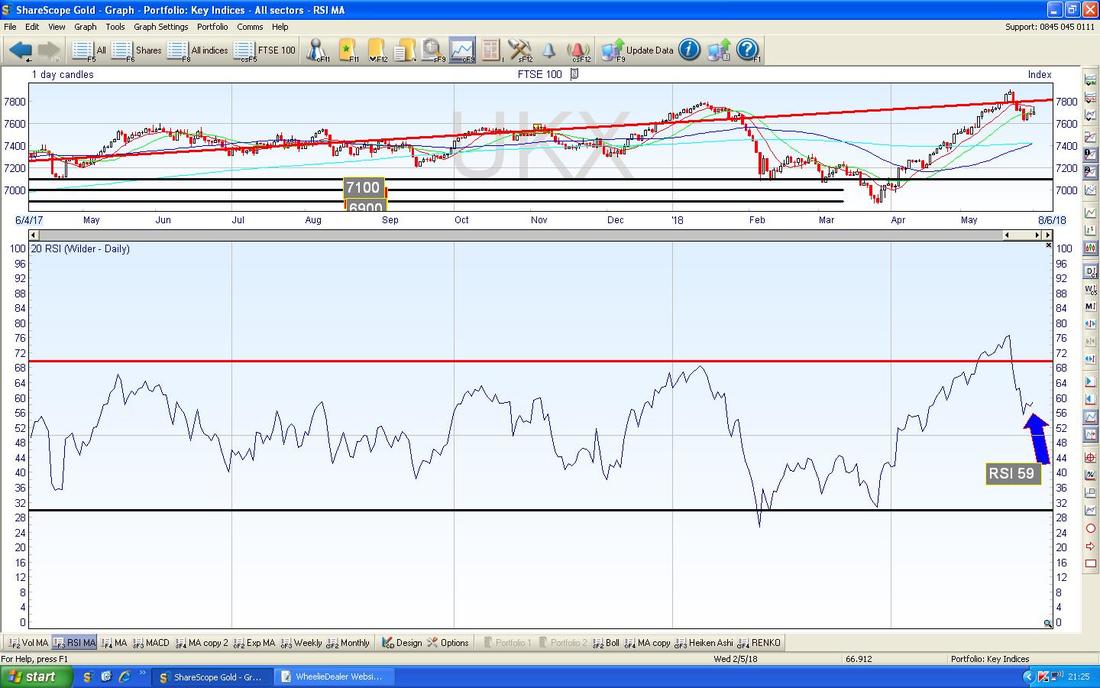
In the Bottom Window on the Chart below we have the RSI for the FTSE100 Daily. My Blue Arrow is pointing to a Reading of RSI 59 and if we see more Upside this suggests room to go a lot higher but on the flipside, there is plenty of room to fall as well !! I guess for now that 7610 Level is very important and if we can avoid that failing then there is good reason to be positive.
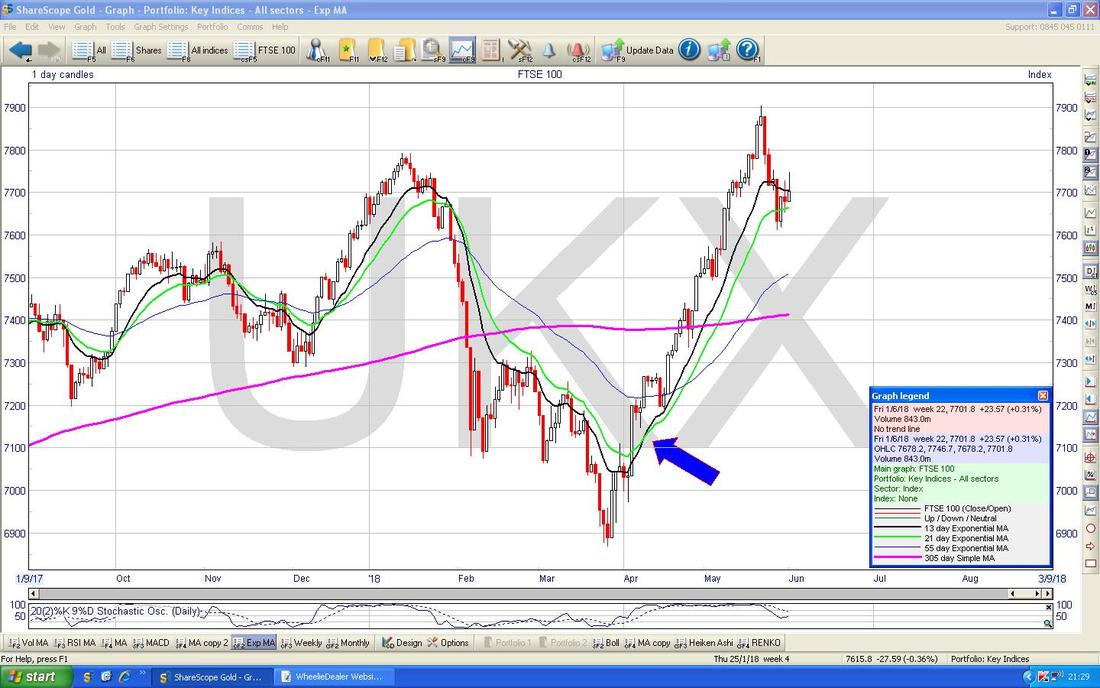
Next we have the EMAs - note where my Blue Arrow is that we got a Bullish ‘Golden Cross’ where the Black 13 Day EMA Crossed the Green 21 Day EMA and this is still ‘in force’. However, look at how in recent Days the Black 13 Day EMA Line has dipped down towards the Green 21 Day EMA Line and we might be near a ‘Death Cross’.
This Index is a pain of course because it seems to behave more like FOREX than Stocks these days.
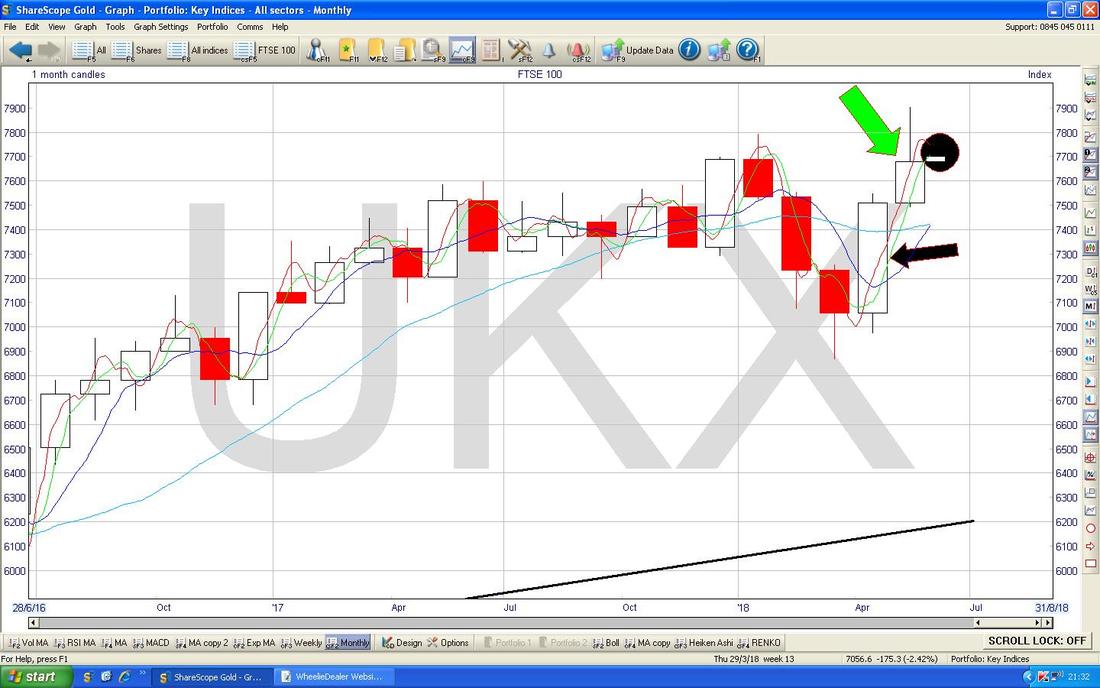
The Chart below has the Monthly Candles for the FTSE100. Again, ignore the small Candle in the Black Circle as this is June forming up but my Green Arrow is pointing to an ‘Inverted Hammer’ from May - it is not a great example and the ‘context’ is not clean as we only had one Up Month before in April where my Black Arrow is but it is a hint that the FTSE100 is not as Bullish as the US Indexes appear to be.
FTSE250
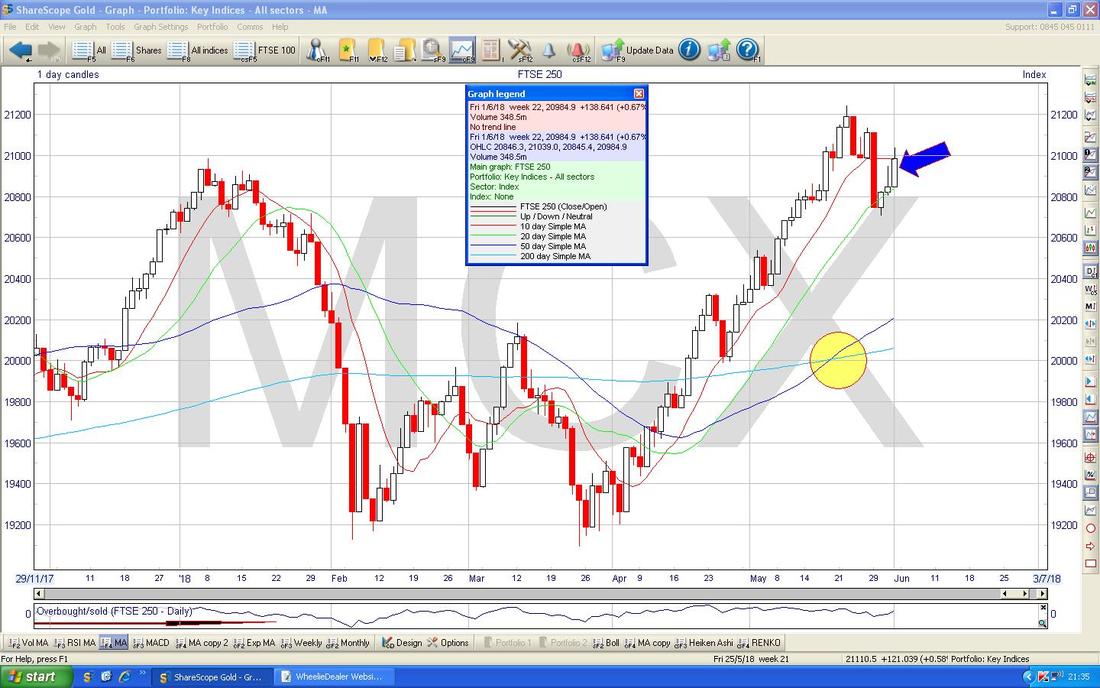
This Index probably means more to my Portfolio and to those of many Readers. The Chart below has the Daily Candles for the FTSE250 and my Blue Arrow is pointing to a Big White Up Candle from Friday. It dropped back slightly from the Intraday High but it certainly looks prettier than that from the FTSE100. My Yellow Circle is pointing out a Bullish ‘Golden Cross’ between the 50 and 200 Day Moving Average Lines and this suggests Weeks and Months of Gains to come.
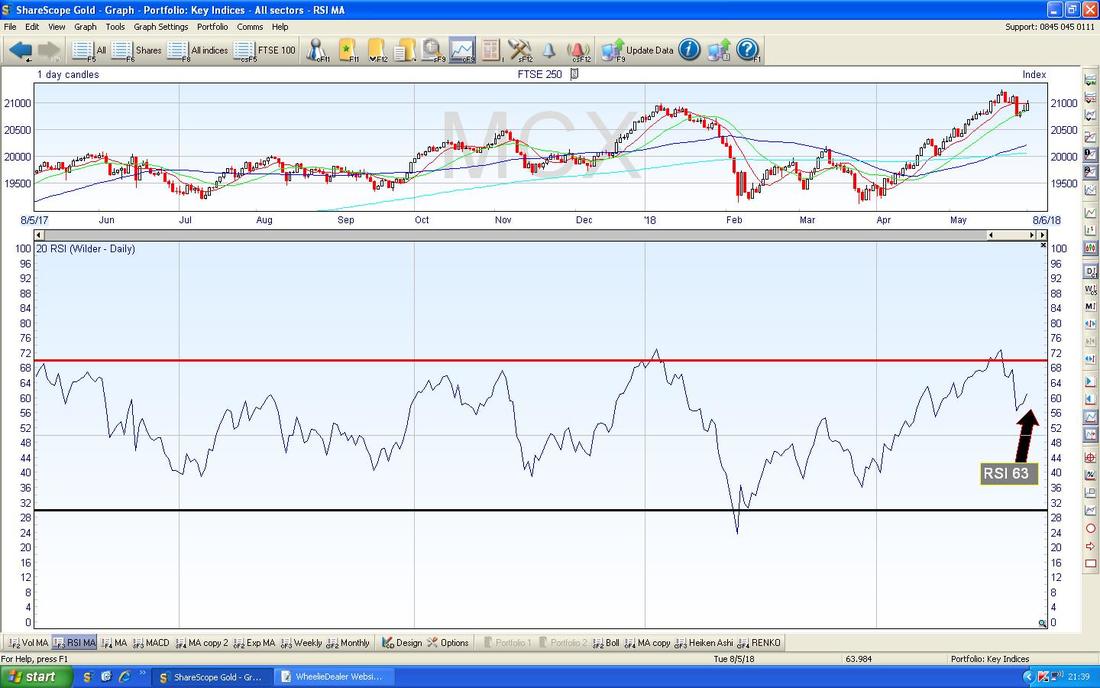
Next up is the RSI in the Bottom Window. On a Reading of RSI 63 it has room to go higher if the FTSE250 can stay Bullish in the coming Week.
I am gonna leave it there - good luck for the Week ahead and remember June tends to be a difficult Month so it might be best to be a bit careful. Do as I am going to do and get out and enjoy the Sunshine while we have it !! Cheers, WD.
0 Comments
Leave a Reply. |
'Educational' WheelieBlogsWelcome to my Educational Blog Page - I have another 'Stocks & Markets' Blog Page which you can access via a Button on the top of the Homepage. Archives
May 2024
Categories
All
Please see the Full Range of Book Ideas in Wheelie's Bookshop.
|


