|
I am sure I will have to rename these Weekend Blogs - increasingly they seem to contains copious amounts of Words and less and less Charts - so perhaps they should be ‘Weekend Words Blogs’ - although of course that lacks any kind of a ring.
Last Week We really had a ‘funny’ one last Week - I managed to gain 0.3% for my Portfolio on UK and Spreadbets stuff which was a bit disappointing after we had a massive Up Day on Thursday but this got almost totally wiped out with a very rubbish Down Day on Friday (I’m glad I spent most of it sat at a Pub by the River Thames in Windsor). However, I did get a nice surprise later in the evening when I worked out the Numbers for my US Unit Trusts (there are just 2 of them - AXA Framlington Health and Henderson Technology) which had a good Week mainly due to the strength in the Dollar and relative weakness of Sterling and this meant that Overall my Portfolio was up 0.7% for the Week which of course could have been better but I am reasonably happy. To put it into context, if I could make 0.7% every Week over a Year that would be a Total Return of over 36% - I wouldn’t moan at that !!
As always I am not doing much at the moment although I did Sell my position in Golden Prospect GPM taking a Loss on it which was annoying but I think it is the right thing to do. Gold has been a total pain in the backside and I just see little point in having exposure to it. As always, leave the Commodities and suchlike to the Short Term Traders - more and more I take the view that Stocks which lack ‘End Pricing Power’ are not a good idea.
I updated the ‘Weekly Performance’ section on the Homepage to cover how my Portfolio behaved in May and I have put a lot of words about what my Strategy is and some Macro concerns etc. - it might be worth reading. I also updated the ‘Little Black Book’ section which is on the WheelieBin page with loads of possible New Ideas for further Research. In case you hadn’t noticed this before, the ‘Changes List’ at the top of the Homepage always has any latest Additions/Changes to the Website - I suggest Readers always look at this when they get the rare urge to visit the Website. Wheelie’s Summer Bash If you have been reading the Website and following me on Twitter and all that for some time, you may recall that we have got in the habit of holding ‘Wheelie’s Summer Bash’ for the last 2 years and I have finally got around to chatting with Aston Girl (@reb40 on the Tweets) to see when she can fly down from her Igloo (although she tells me it is like Sunny Tundra at the moment !!) to the Civilised World around Windsor (yeah, hard to believe I know) and we have set a Date as……….. Saturday 15th September 2018 So shove it in your Diary and when I get around to it I will put more details on the Homepage and we have yet to confirm the Venue but it will most likely be at the same place as last Year which was The White Hart pub in Winkfield near Windsor which people seemed to like and fingers crossed we will get decent weather and be able to make full use of the extensive Beer Garden. I am sure we will ‘make use’ of the Beer and other Beverages whatever the weather !! As always it will be a totally open affair where anyone can come and all I ask is that People please email me or contact me on Twitter or whatever (send me a Letter if you must or Fax me, although Carrier Pigeons are not ideal as I can’t catch the devils !!), so that I can keep a track of numbers. You can email on [email protected] It will probably start at about 12 Noon and go on all day (last year it ended when the Landlord decided he had had enough of us - and before you start that was probably gone 11pm - he didn’t throw us out after a few hours !!). As such you can turn up whenever you like and they do decent Food at very good Prices so you can stuff your face there if you need to. It doesn’t matter how experienced or inexperienced you are and we tend to get a full mix of ages and sexes - these are totally informal events where everyone just gets together and socialises. If you want to meet up with some truly excellent Investors and Traders and/or if you want to just meet up with other like-minded people at a similar stage in their Investing Journey then it really is worth coming. There is no Entry Fee or anything although I do drink a lot of Beer !!! I am pretty confident that The White Hart will be the venue and there is a Hotel down the road called ‘Stirrups’ which apparently is quite serviceable and I suspect several people will be staying there - so there might even be a group of people kicking around there on the Friday Night. I will confirm The White Hart as quick as I can. Duxford Aerodrome Meet-up Monday 25th June If you simply cannot wait until September 15th then we are having a Get-together on 25th June at Duxford Aerodrome near Cambridge (only just over a week away). It is a great Museum and as with the WheelieBash everyone is invited and in this case you just need to pay the Entrance Fee to the Museum and we will be hanging around the Canteen bit which is near the way in. I am easy to spot because I am a Wheelchair User and I expect to be there around 12.30pm ish but turn up whenever you like and have a poke around the Museum. I recommend the US bit because there are some stunning Planes in there. The Car Park is enormous so if you drive there it is very easy with the place being just off the M11. If you go to the Homepage there are more details but I think I have pretty much said it all here. Blog Slate In the Week just gone I published the Second Part of the excellent Accounting Guest Blogs from Justin Scarborough - if you have not read them I recommend that you do so. They are targeted at people who do not have a deep understanding of how to read Accounts and I know most Readers will find this useful. Despite being out and about a lot with the better weather, I managed to make progress on the Second Part of the Primary Health Properties PHP ‘Buy Rationale’ Blogs and I just need to Proof Read it and add in a short Section I forgot to put in and then do the Charts bit which shouldn’t take too long. On that basis I should be able to get something out this Week. There is a nice List of future Blogs to come out and I have several in various states of completion. I intend to do some on ‘Common Mistakes by Newbie Investors’ which I think will be quite popular but apart from drawing up a List of those Errors as yet I have a mountain of work to do on it, so we will be many Weeks before that shows its ugly face. Something else that might appear in coming Weeks is a series of Guest Blogs from a mate about Short Term Trading really - I think Readers will love that because the Early Drafts are really shaping up well. SUK2 drawbacks Whilst chatting to Aston Girl on Friday afternoon, she mentioned her Short Position on the FTSE100 using the SUK2 ETF which is two-times leveraged (in other words SUK2 should pay out twice the % Fall of the FTSE100 if it goes in the right direction, and you lose twice as much if it rises). Anyway, I just want to flag a limitation with SUK2 and a possible solution. The catch is that SUK2 works really well if the FTSE100 drops down in a straight line - in other words if it drops for perhaps 3 Days on the trot with no Up Days in between, then it works really well and you should get twice the Drop of the FTSE100. Trouble is, if you hold SUK2 for several Days and the FTSE100 goes down, then up, then down again, then down, then up or whatever (i.e. it chops around a lot from Day to Day), then you will find that even if the Total Drop over perhaps 6 Days is 10%, you might not get the 20% you would expect and in some circumstances, for example, it might only be 8% or something !! It is a very strange instrument and it is all about how they calculate the ‘Rollover’ Value from Day to Day. I would suggest the best solution to this problem is to just buy XUKS and do a Position which is twice as big. Simples (although obviously you need the Cash to be able to buy this as you buy ETFs like a Share - see my ‘Funds’ page for more details on ETFs). The Importance of Dividends (or rather, their Growth) I was sat by the River on Friday at the Pub and my ‘work’ excuse for this was that I was meeting with my mate Stuart who had been to the Mello South Event the day before (which I hear was rather good, as you would expect). Anyway, he mentioned something interesting which I think was raised by Guy Thomas in a talk he did about Funds but I might have this wrong (by the way, Guy wrote the wonderful Book ‘Free Capital’ and I recommend you read this if you wish to give up the Rat Race and Invest for a living - nip over to Wheelie’s Bookshop and you can read about it). The point was that the Total Returns you make from any Company are comprised of 3 bits (note I assume this is for a Holding Period of many Years so you get the effects of Compounding) - the Starting Level of the Dividend, the Growth over time of the Dividend and the Capital Growth of the Investment. I am not sure if these figures are totally correct as I probably misunderstood what Stuart said but it was something like this in terms of where the Total Returns come from:
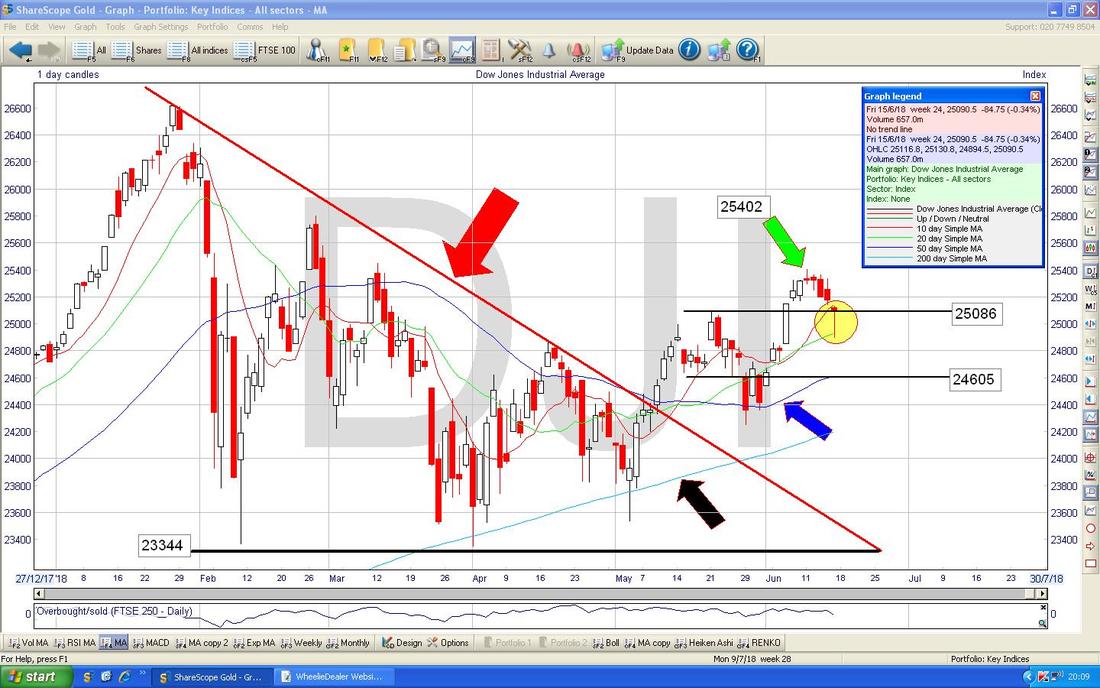
Whether these figures are right or wrong is not really the point - the thing to take onboard is that Growth of Dividends is extremely important (and on these numbers Guy claims it is by far the most important factor) and when selecting Stocks to invest in, we must take considerable notice of this aspect. We need to find Stocks where the Dividend is likely to grow quickly which obviously means fast growing Sales and strong Growth in Profits and good Cash Conversion. How to Calculate the Cash per Share a Business has I was chatting to someone on Twitter and we were discussing what the Cash Pile that a Company has is worth in terms of the Share Price, so that we can strip it out in order to get a better picture of the P/E Ratio and in effect use the ‘Enterprise Value’ for this calculation. As a consequence of this it struck me that Readers probably struggle with this and I just wanted to simply explain how to do it. In essence, it is a case of comparing Ratios - so this means that the Equation goes like this: Cash held by Company / Market Capitalisation = X / Current Share Price (where / means ‘divided by’ and X is the number we are trying to find out - in other words the Cash Per Share). Doing some re-jigging we get the following formula: X = Cash held by Company / Market Capitalisation x Current Share Price. So making things more concise: Cash per Share = Cash / Market Cap. x Share Price Let’s do an example using Mpac Group MPAC. Roughly speaking, MPAC has £29m of Cash and the Market Cap is £42m and the Share Price is 207p. So using the Formula we have: Cash per MPAC Share = £29m / £42m x 207p Cash per MPAC Share = 0.69 x 207p Cash per MPAC Share = 143p. I hope that makes sense. Sorry to remind you all of your Maths Schooldays (or ‘Math‘ if you are a Yank). Commercial Property I have felt for quite some time that Commercial Property Stocks still look good value and I think worries over Brexit have hit them far too much and the Sector could be worth a good look over. Obviously certain bits are best avoided like the Retail Sector but some of the Big Property Companies are at nice Discounts to NAV (Net Asset Value) and they pay juicy Dividends. The Storage Stocks like BYG, SAFE and particularly LOK might be worth thinking about and the Distribution Warehouse ones look good like BBOX despite good runs already. Obviously all this Online Shopping needs Sheds to temporarily park the stuff in while it wends its way to the End-Customers. Anyway, I was reading the latest Investors Chronicle earlier today (dated 15 June - 21 June 2018 with ‘How to be a Contrarian’ on the cover) and on Page 20 Jonas Crosland has written a good page on this theme. It is worth reading the Article if you are sensible enough to get the IC and the bits that stood out to me were: “However, the current outlook suggests that as far as major influences go there is little likelihood of a major shock that would alter the current trend. This itself is perhaps a dangerous assumption because by definition shocks are unexpected. But the key components governing sentiment such as economic activity and interest rates are not expected to change materially. Some sectors of the real estate market will perform better than others, but for office, housing and urban logistics the supply/demand imbalance and supporting factors such as the recorded levels of employment put them at the top of the pile. And it’s also worth remembering that the last financial crash came as a result of banks being greedy. Some lessons have been learnt from that by property landlords. Speculative building has been on a more measured basis while equity rather than debt has been used to a greater extent to raise funds. So there is still plenty of room for advancement for the canny operator willing to put in the legwork.” I don’t have all that much exposure to Commercial Property and perhaps that is an error. I hold ESP and PHP (the latter certainly won’t be hurt by the Governments announcement to shove more Money into the NHS). Something that also hits me is that with the Brexit worries, Development seems to have been slowed down and this could result in a big shortage of Offices and Warehouses etc. in coming Years - something to think about. John Rosier’s Column On page 26 of IC this Week John Rosier has done his regular Update (he is a very good Investor and you can follow him on Twitter at @John Rosier) and there were a few interesting comments that I thought Readers would like me to draw their attention to. First off John said this which I liked: “Regular readers will know that I can live with short-term volatility, preferring to focus on the longer term - and, more importantly, the dividend paying potential of the portfolio.” John also said this which I liked because I have also felt that Share Prices tend to under-react to Good News: “Over the years, I have detected that often share prices do not respond as enthusiastically to ‘ahead of expectations’ trading updates as perhaps they should. It’s almost as though the market does not believe it and wants to see more evidence first.” This is important because I have no doubt that buying Stocks that have put out ‘Ahead of Expectations’ Trading Updates can really be a good Strategy and I wrote a Blog about Analyst conservatism in forecasts which I will put in the ‘Memory Lane’ bit below. Obviously you must never just blindly buy such a Stock but they are certainly well worth investigating and doing proper research on. By the way, John also added Medica MGP to his Portfolio recently and this might be worth a look - it does Remote Radiology stuff and was an IPO not that long ago but the Shares fell back a lot after a strong initial surge up. Memory Lane This one is from September 2017 and should explore more the concept I covered above regarding ‘Ahead of Expectations’: http://wheeliedealer.weebly.com/blog/analysing-the-analysts That’s a lots of words, so let’s just do a few Charts before I wrap it up, but before that I need to take a pause for my Daily Dose of Strawberries - I seem to be drowning in the things at the moment and although it is a ‘nice problem to have’ it is getting to the point where I have replaced Meals with Bowls of Strawberries and Ice Cream and I am becoming a bit of a Fruitarian - or perhaps that is more ‘Strawberrytarian’? I am at the point where I still like them but I do sense that my desire for them is starting to peak. I might have to do a Chart with my ‘Enjoyment of Strawberries’ on one axis and with ‘Number of Bowls consumed’ on the other axis. The WheelieGarden has gone into full overdrive on Strawberry Production and not even the Slugs and Woodlice can eat them fast enough. ………Short Pause in Blog writing……… OK, I’m back and that Bowl was most definitely hard going - I will have to con my Neighbours into taking more off me. My Stomach seems a bit iffy as well…… Dow Jones Industrials Average (The DOW) As always the Charts I show are from the superb ShareScope software that I subscribe to and if you click on the images they should grow bigger so you can see more detail. Of course on Friday we had a shocker but it is interesting that the DOW recovered Intraday after a Big Sell-off and this Reversal meant that we got a very nice looking Hammer Candle which is shown in my Yellow Circle. I won’t show it here but there was a huge Spike in Volume as well which suggests that when Bears pushed the Index down the Bulls charged in and pushed it back up again - so it is quite likely this is not a disaster and we might be able to recover off of this next Week. Of course the Low of the Day at the bottom of the Hammer Candle at 24894 is now important Support and must hold in the very Short Term but if it fails we then have good Support at 24605 and below. I would go so far as to say this is a very well supported Market. To the Upside a move over the recent High where my Green Arrow is at 25402 would be a Bullish Event. Note how the 50 Day Moving Average Line (marked by my Blue Arrow) has turned up and away from the 200 Day MA which is marked with the Black Arrow. This is Bullish as it avoids a Bearish ‘Death Cross’ which would happen if the 50 Day MA fell down through the 200 day MA Line. I don’t think being Short this Market is the right stance.
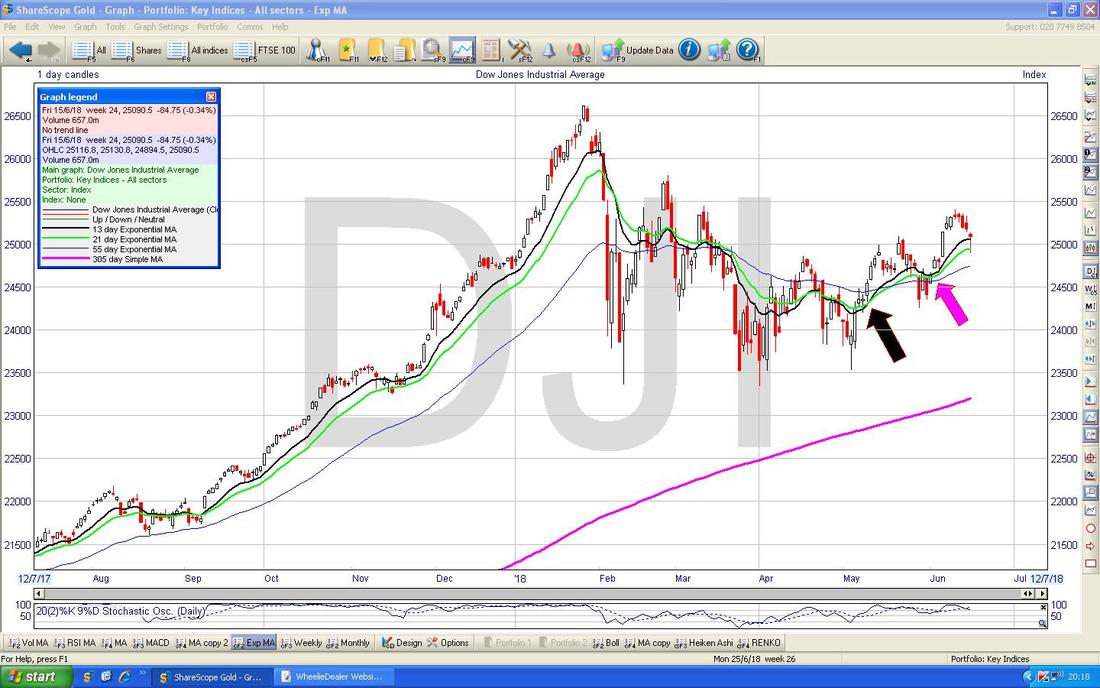
Next we have something that is rapidly becoming one of my most used Indicators. If you look on the Chart below for the DOW the Black Arrow is pointing to where we had a Bullish ‘Golden Cross’ between the Black 13 Day Exponential Moving Average and the ‘slower’ Green EMA Line which is the 21 Day EMA. After such Crosses I would expect a few Weeks of Gains and only when we get the opposite Crossover (the Bearish ‘Death Cross’) is the Market likely to drop.
Where my sort of Pinky Arrow is we nearly had a 13/21 Day EMA Death Cross but it just avoided it. Such avoidance is in itself Bullish.
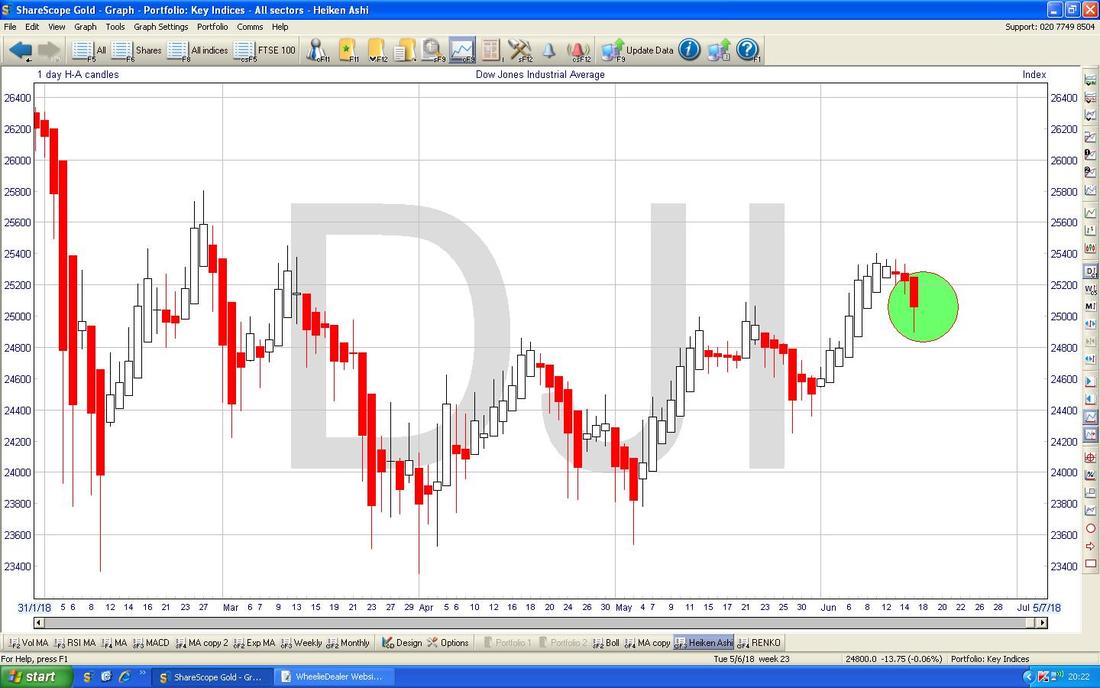
Next we have the Heiken Ashi Candlesticks for the DOW. These are totally different to ‘Normal’ Japanese Candlesticks and are a lot ‘slower’ because they take a couple of Days to form up. On the Chart below my Green Circle is highlighting a Big Red Down HA Candle which is Bearish and suggests more downside. However, remember these are slower than the Normal Candles and the Hammer we had on Friday which I showed earlier might be more timely and show we are likely to move up.
There is also the ‘Monday Reverses Friday’ factor to consider….
The S&P500 is largely similar to the DOW so I will not show it this week.
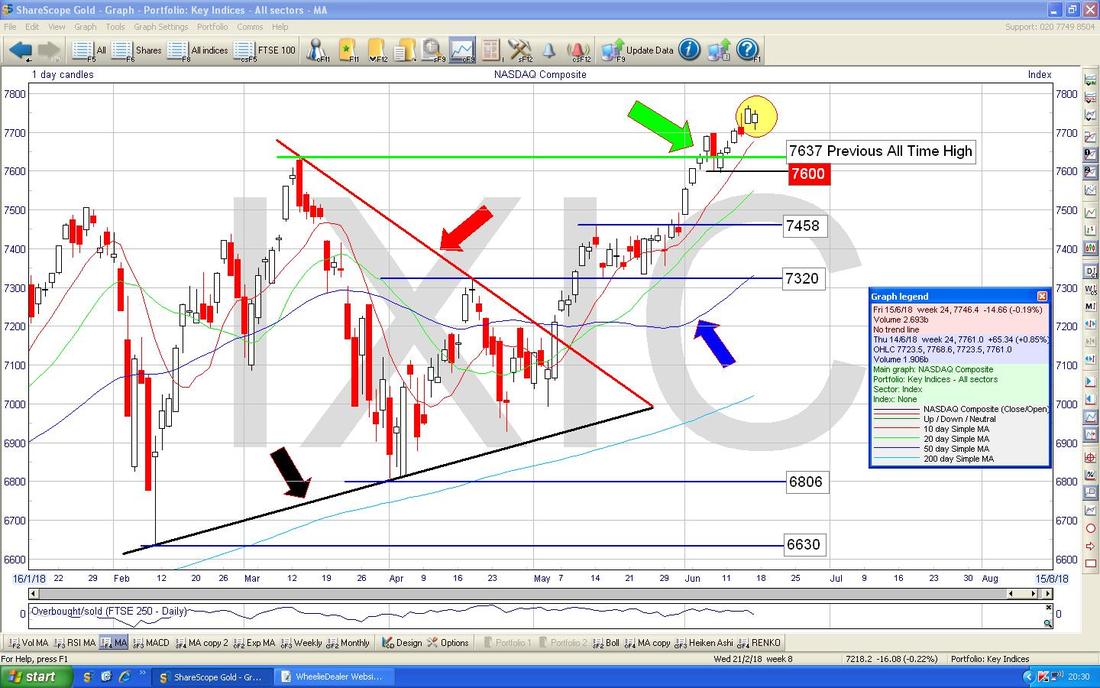
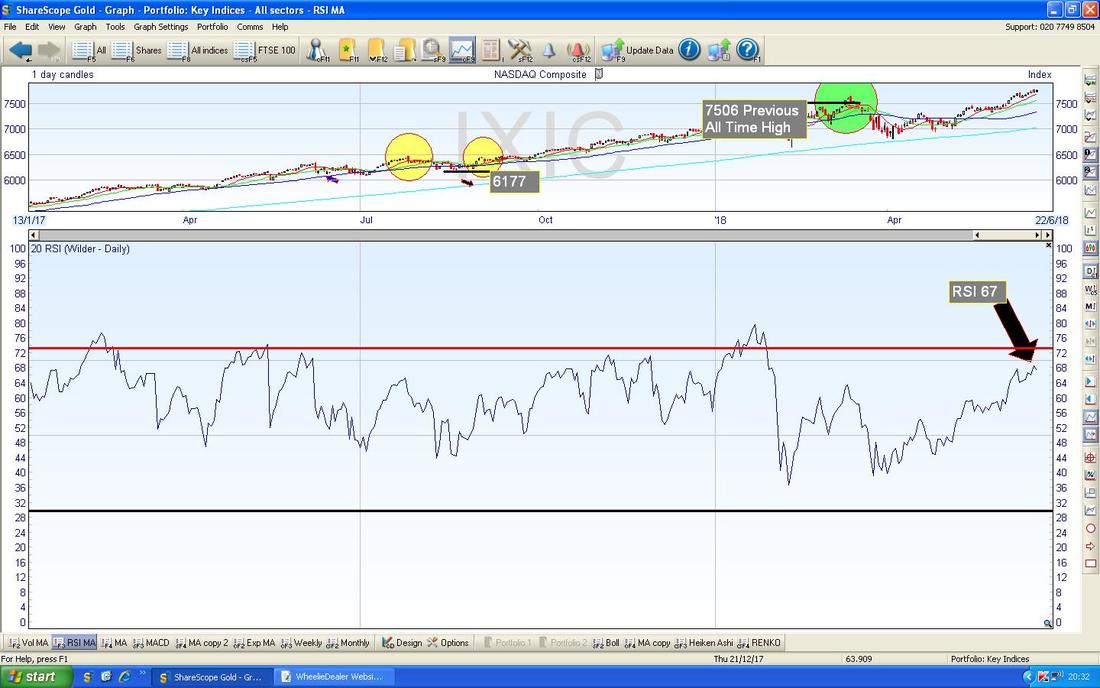
Nasdaq Composite (US Tech) This still looks Bullish to me. We had a strong Up Day on Thursday which was followed by a lower but still Up Day on Friday - I have captured these in my Yellow Circle and after the Breakout of the Green Line (where my Green Arrow is) which is the Previous All Time High at 7637, it looks very Bullish. That Previous ATH should act as Support now if we do get a Pullback. Note where my Blue Arrow is how the Blue 50 Day MA Line has turned up lately and away from the 200 Day MA.
With a Market so bullish, the RSI (Relative Strength Index) is a really good measure of how much higher it is likely to go and when the run up will come to an end. In the bottom window on my Screen below, we have the RSI for the Nasdaq Comp Daily and on a Reading of RSI 67 it is very high but by the standards of the Nasdaq it can go higher yet before a proper Pullback or Sideways Consolidation comes along to unwind an over-extended RSI reading.
In a similar way, when you have a Stock or Index etc. that is falling, the RSI can give you some idea of when it will turn up.
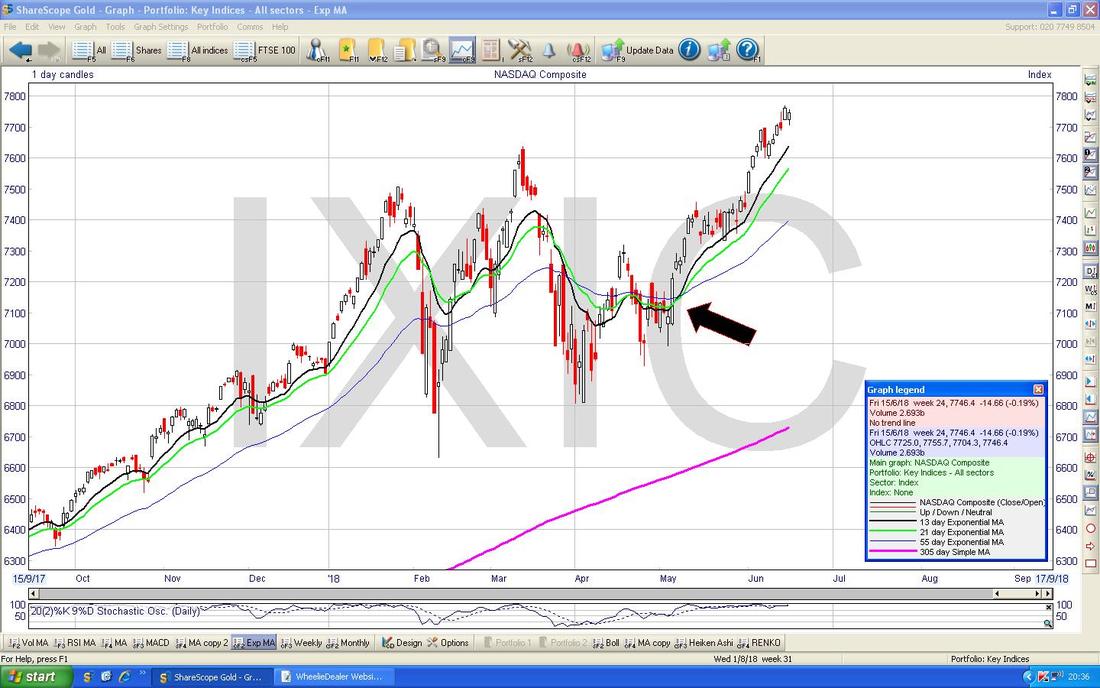
The Chart below has the 13 and 21 Day EMAs and my Black Arrow is showing where they Crossed in a Bullish way many Weeks ago and look how predictive that turned out to be !!! As yet there is no sign of a ‘Death Cross’.
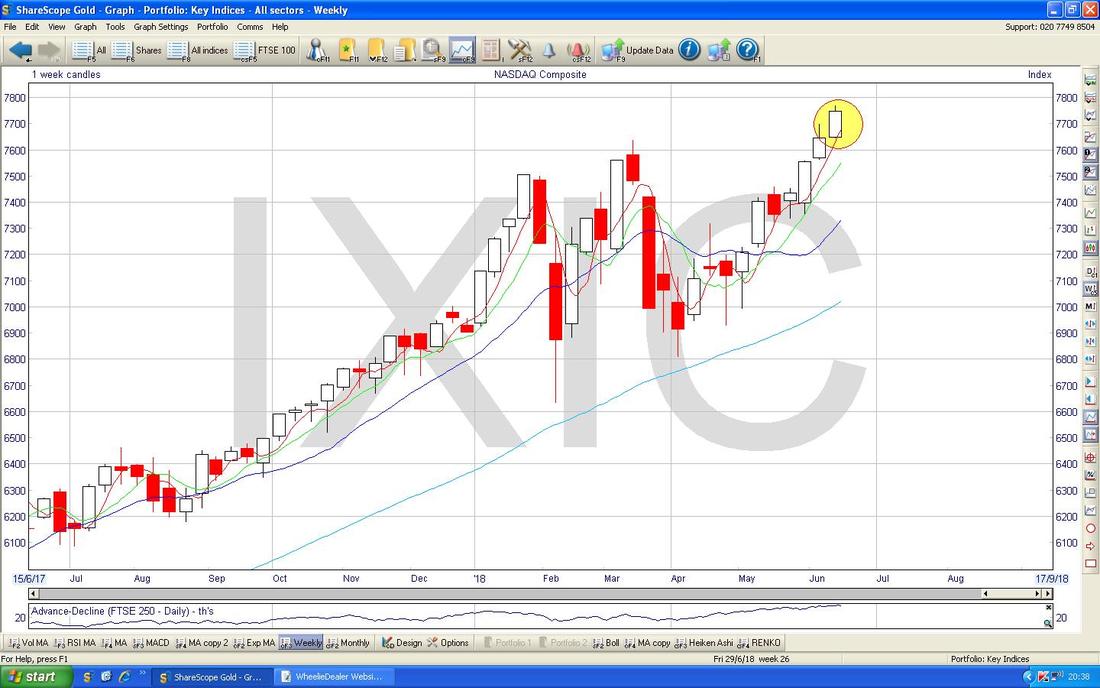
Next we have the Weekly Candles for the Nasdaq Comp - my Yellow Circle is showing a Big White Up Candle - more Bullish signs.
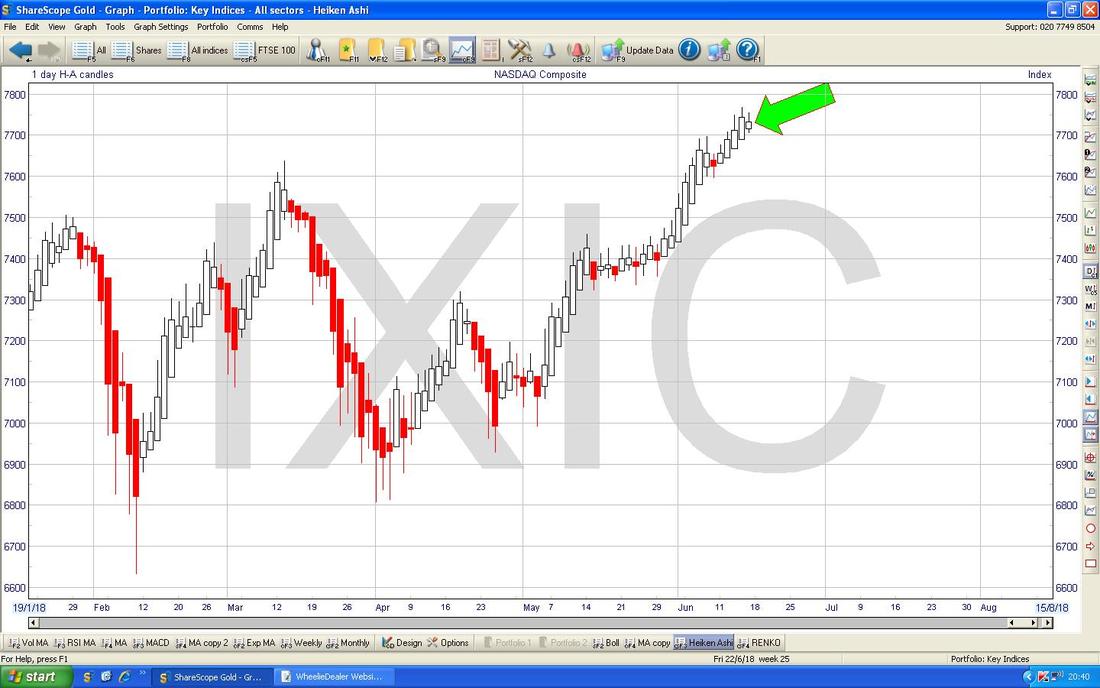
This is something to watch - and we should know on Monday Night how this has played out. On the Heiken Ashi Candles below, where my Green Arrow is we have been treated to a Narrow White HA Candle which might be a hint that the move up is weakening. Something to monitor.
FTSE100
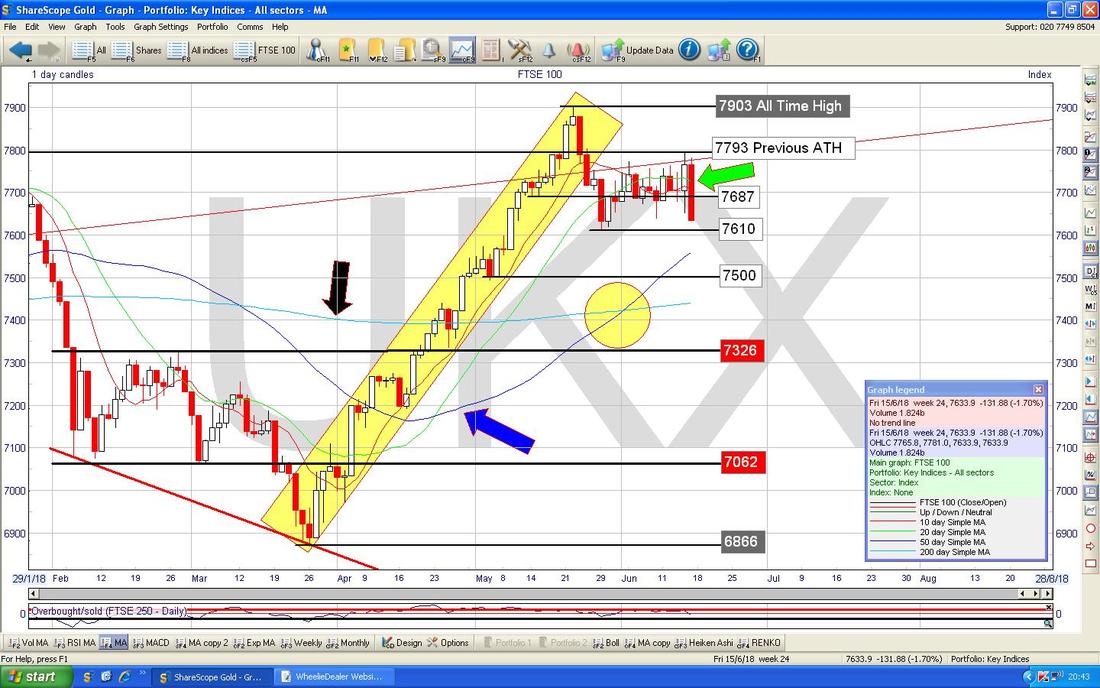
Again we have a similar Chart to the one I showed last Weekend. Most important thing here is where my Yellow Circle is which is catching the Bullish Golden Cross between the 50 and 200 Day Moving Averages - such Crosses tend to predict Weeks and Months of Gains to come. My Green Arrow shows the Big Red Down Candle we got on Friday and in itself this would be a Bearish Signal. However, it is really about Support and Resistance now and as long as the Low of the Sideways Range holds at 7610 there is not much to worry about. In addition, 7600 is the Level to watch and if this fails then things would be a lot more Bearish and concerning in the Short Term. To the Upside, we need to see a move over the Resistance up at 7793. June is legendarily a Bad Month but I am not sure how it will play out this year. With the US looking pretty Bullish and with Forex being such a factor on the FTSE100 (and that is not to mention the mess that Theresa May has got herself into), it is hard to have any idea what it is going to do. Just watch those Support and Resistance Levels.
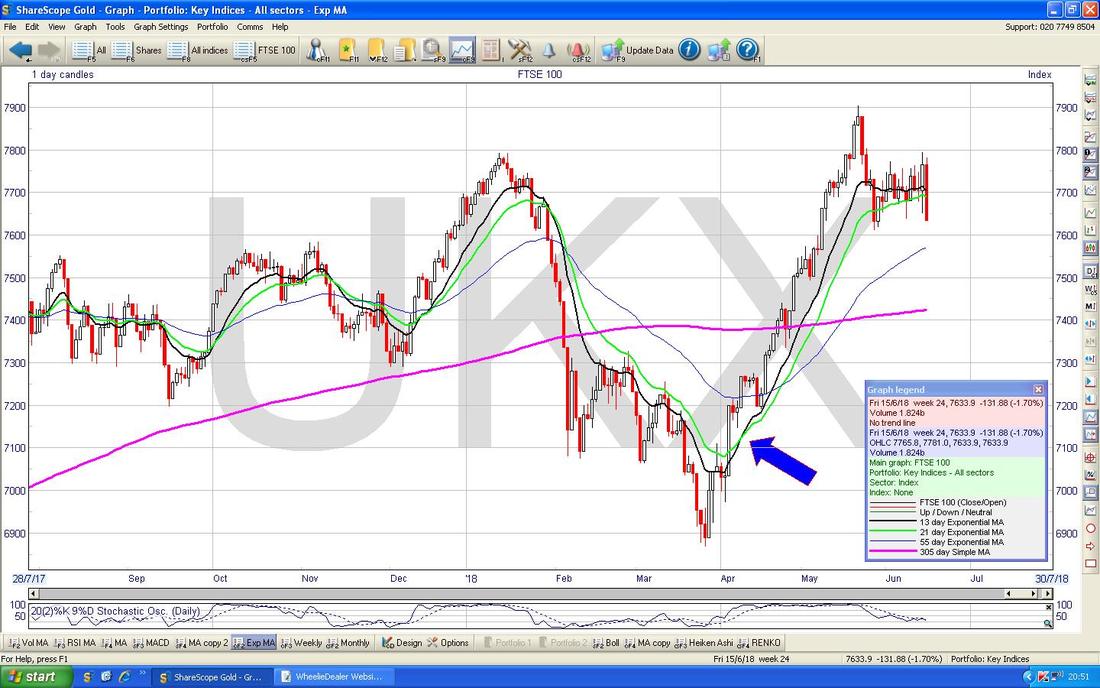
Here we have the 13/21 EMA Crosses again. Where my Blue Arrow is we had a Bullish Golden Cross and since that we have not had a Death Cross - this is something to watch.
FTSE250
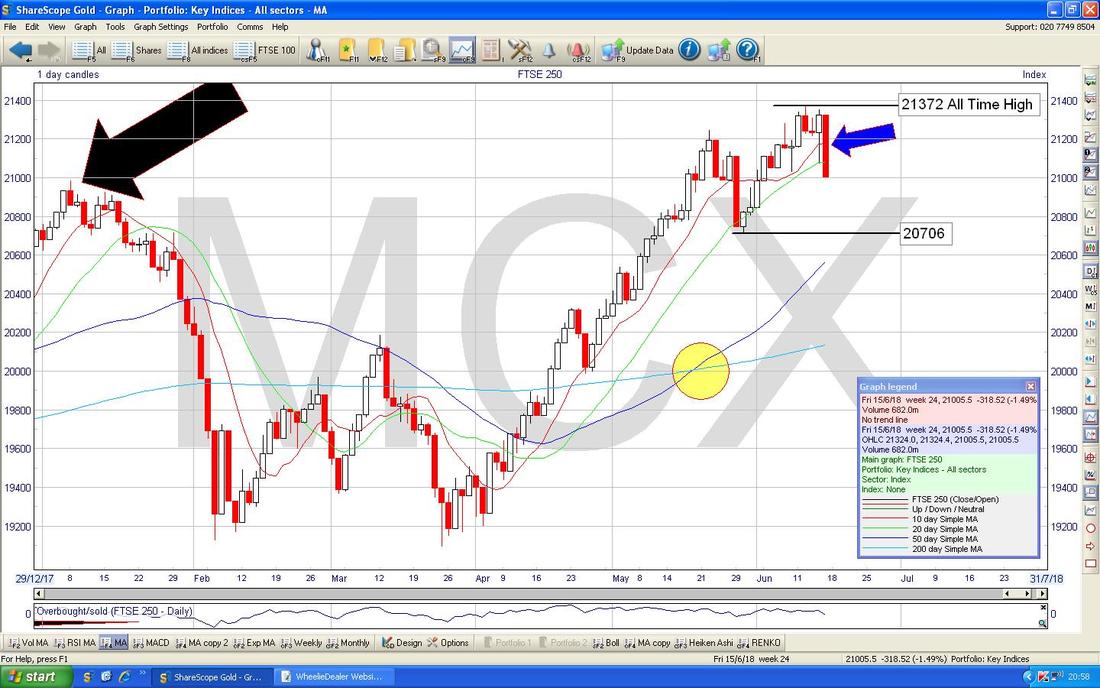
My Chart below has the Daily Candles for the FTSE250 and this has similarities to the FTSE100 in that where my Blue Arrow is we had a Big Red Down Candle from Friday. Note this stopped at about 21000 and this should be Very Good Support because where my enormous Black Arrow is we had the same Level of 21000 ish as the All Time High which was only recently Broken-over (former Resistance becomes Support and Vice-versa). Again this is about Support and Resistance. To the Downside the Key Level is 20706 and a move below this would be a concern. To the Upside, the recent ATH at 21372 needs to be Broken-over and any such Breakout would be very Bullish. Note my Yellow Circle showing the 50/200 Day MA Golden Cross - this predicts Months of Gains ahead. I will leave it there - I need to do the Proof Read and upload to the Website System etc. I hope everyone has a Safe and Prosperous Week !! (and keep off the Strawberries !!) Cheers, WD.
0 Comments
Leave a Reply. |
'Educational' WheelieBlogsWelcome to my Educational Blog Page - I have another 'Stocks & Markets' Blog Page which you can access via a Button on the top of the Homepage. Archives
May 2024
Categories
All
Please see the Full Range of Book Ideas in Wheelie's Bookshop.
|


