|
THIS IS NOT A TIP OR RECOMMENDATION. I AM NOT A TIPSTER. PLEASE DO YOUR OWN RESEARCH. PLEASE READ THE DISCLAIMER ON THE HOME PAGE OF MY WEBSITES.
You may have seen that I bought more St. Ives (Epic code: SIV) early in the morning on Friday 29th May and I wanted to do a quick Blog to give Readers a view on why I made this Decision. I am in Summer mode and trying to take things easy so I will not do a hugely detailed Blog - but you will find the guts of my Decision in here and you can have a look into the Company yourself if you wish to. Remember this is not a Recommendation to Buy or anything.
As per usual, I made my Decision outside of Market Trading Hours on the night of Thursday 28th May - I like to be calm and rational when I make decisions and I find the hustle and bustle of the Market Day can affect my ability to be objective. If you find yourself making Snap Trades during the Day and afterwards regret them, maybe you should instigate a similar rule - it definitely has improved my Results. In consequence, all the Screenshots and stuff in this Blog are as I saw them on Thursday night.
I had actually been thinking about a Topup on SIV for many weeks - and have been quite perplexed to see them continually falling - but it strikes me as a very Undervalued Stock and when I have such Situations - it pays to be patient. If you follow me on Tweetererer, you may have seen my comments on this matter over recent weeks !! In particular, I want to bring to your attention a Technical Event which was / is very significant - you will have to be patient, it’s at the bottom !! And I know many Readers will be very relieved to hear there are no Candles in this Blog…….(cheers, vuvuzelas and applause from the Crowd at this point.) Speedy Company Overview In very simple terms, SIV was a Printing Business that has been making an astute Strategic move into the high growth area of Digital Marketing (online and Mobile Marketing and Advertising stuff). I expect it to do some more Acquisitions and the Printing Business provides a superb Cash Cow to enable this Strategic Shift. I copied the following text from the recent Half Year Results announcement, it gives a fair summary: “St Ives is an international marketing services group, made up of a number of successful and dynamic businesses serving leading brands internationally, with offices in the UK, North America, China and Singapore. We operate not as a single entity but as a group of market leading businesses, each with its own unique value proposition, offering complementary services and collaborating closely with each other wherever this adds value to clients. We work with a large number of leading, international consumer-facing brands across all major sectors - including retail & FMCG, healthcare & pharma, financial services, media, technology, automotive and charity - helping them determine strategic direction, and designing and delivering world-class solutions to match their specific requirements. Our industry-leading Strategic Marketing businesses have strong capabilities across three specialist high growth areas: data, digital and consulting. Our Marketing Activation businesses, which deliver marketing communications through a combination of print and in-store marketing services, complement our Strategic Marketing offering and collaborate with them where this adds value to clients. The Group's strategy for further growth for the marketing services businesses is centred around three key priorities: · organic growth through collaboration and investment in our existing brands; · internationalisation, often client-led, into large and high growth markets; combined with · further acquisitions of complementary, ambitious and growing Strategic Marketing businesses that share our common attributes and ethos. Our long standing Books business, which is the UK market leader, represents another valuable source of profit and cash generation as we pursue our overall growth strategy. St Ives employs more than 3,000 people in the UK, North America and Asia, and is listed on the London Stock Exchange (SIV) with a market capitalisation of c£240m.” The Company’s Website is: www.st-ives.co.uk Recent Developments / Trading Update SIV announced their Half Year Results on 10th March 2015, and said “Current trading in line with management's expectations.” They also announced a new Corporate Structure, which seems to make a lot of sense. There is considerable detail on this in the Announcement if you have a dig: “Revised corporate structure with three segments, reflecting new strategic positioning: - Strategic Marketing: focused on high growth marketing segments of data, digital and consulting; - Marketing Activation: delivering marketing communications through print and in-store marketing services; - Books: representing the UK's market leading book printing business, Clays.” I particularly liked this bit as it shows the Print Business has a nice backlog of work for coming years, which can throw off cash while the Marketing bit grows: “We have reached agreement with Penguin Random House, the UK's largest trade publisher, to provide 100% of their UK monochrome book production under a new multi-year contract. This represents a significant market share gain for the business and, along with a number of other recent contract wins and extensions, secures approximately 80% of Clays' workload for the next three to six years.” You should be able to read the Half Year Results Announcement here: http://otp.investis.com/clients/uk/st_ives/rns1/regulatory-story.aspx?cid=407&newsid=491479 Risks
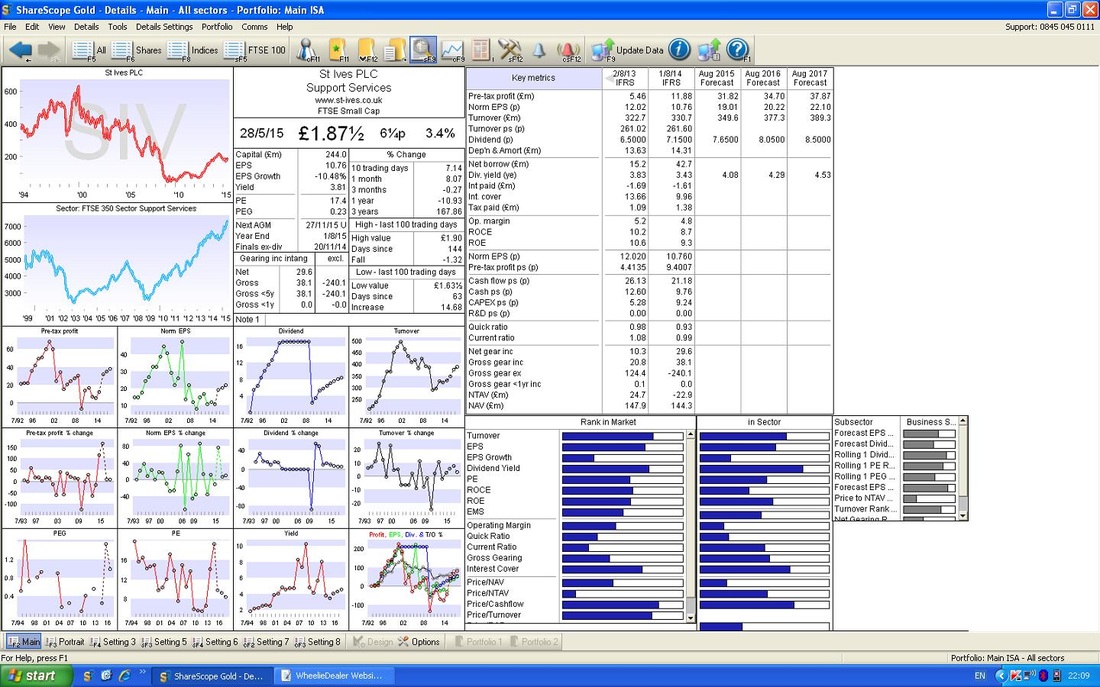
Valuation If you look at the ShareScope ‘Details’ screen below, you should see in the Top Right Hand corner ‘Norm EPS (p)’ of 20.22 for ‘Aug 2016 Forecast’. At my Buy Price of 189.47p, this gives a Forward P/E Ratio (Price to Earnings Ratio - look at it as the Years the Company will take to earn back my initial Investment amount) of 9.4 (189.47 divided by 20.22). Anything under 10 is often seen as Good Value and I am not arguing with this !! For the same year (i.e, next year), the ‘Dividend (p)’ is forecast to be 8.05p. At my Buy Price, this gives a Dividend Yield of 4.2%. This is a very tasty yield for me to pick up while I wait for the Shares to do their stuff and give me some nice Capital Gains (hopefully !!). If you look at the ‘Dividend (p)’ figures, you will see they are expected to rise over the years - this kind of ‘Progressive’ Dividend tends to help drive the Share Price higher (please don’t confuse this word with anything the Prospective Candidates for the Labour Party might say……….) Please note, I never take published P/E and Divvy Yield Ratios at face value - in fact, I never really look at them. Instead, I ALWAYS work out these Values myself with a Calculator. Remember, in the Investment World you should trust Nobody and nothing you Read !!
Target
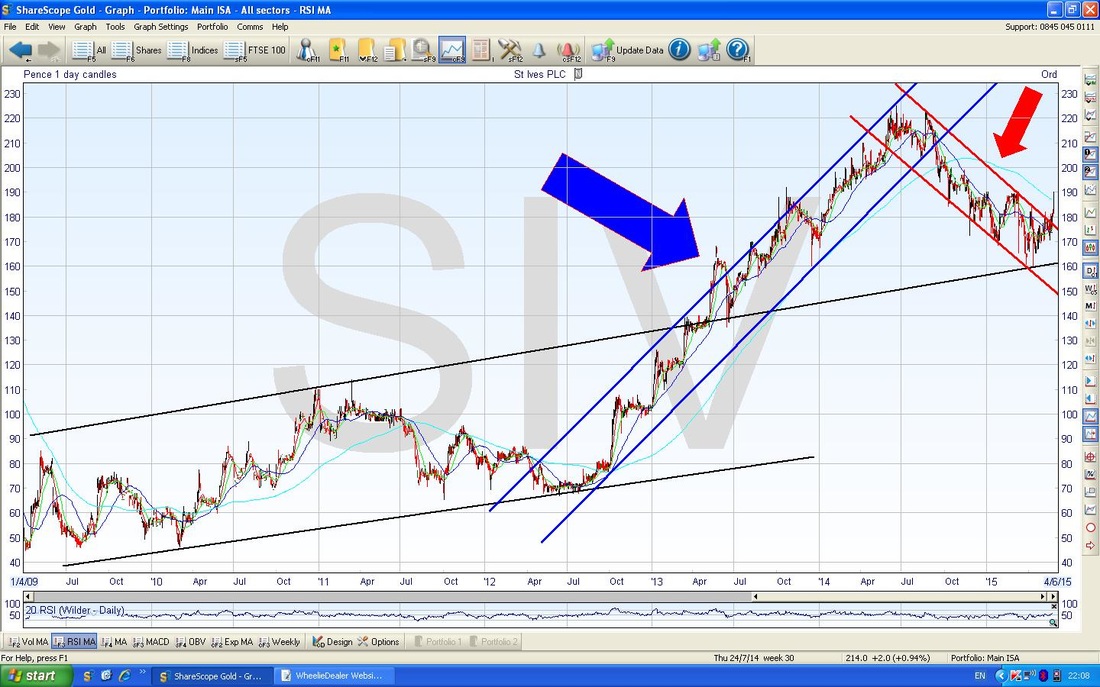
In terms of Fundamental Value, I feel that a P/E of 15 would not be unreasonable for a Quality Marketing Company sat in the high growth Digital Marketing space - assuming SIV continues to make a successful transition. On this basis, with EPS (Earnings Per Share) of 20.22p for next year, a Realistic Target would be 303p (20.22 x 15). If this can be hit, then that is 60% Upside on my Buy Price. As with any Share Buy, there is Risk and it could all go horribly wrong. However, I do feel there is some Upside Risk here in that the Company might be able to beat the Forecasts and this could help drive the Shares higher - perhaps in reality, 350p might be possible - but I will have to be patient and see how things play out. From a Technical Viewpoint, there are Strong Resistance Levels around 225p, 280p, 300p, 350p, 400p. It often makes a lot of sense to think about Fundamental Valuation derived Targets in terms of likely Chart Resistance Areas. Technicals Right, we got to one of the most important bits of this Blog in terms of an important Element that Readers may find useful in their own Investing / Trading. As a slight detour (it’s delayed gratification - you will thank me for it later…), I heard some ‘Expert’ somewhere say something like “Any old muppet can learn how to Analyse a Company - the Art is in learning the Trading Skills” - which roughly translates that it’s one thing to pick a Good Company but if you want to make Real Money consistently, you have to be able to make important Trading Decisions - with regard to Timing, Risk Management, Psychology, Positions Sizes and suchlike. It is quite clear to me that many people do the first bit of Analysing Companies extremely well but fall down because their Trading Skills are lacking. This particular Technical Occurrence is a great example of how a bit of Simple Technical Knowledge can enhance your Stock Picking skills. OK, enough Detours (ah, The Detours, wasn’t that an early Incarnation of The Who? Now there‘s a proper Rock Band - kids, look it up on that Googly thing you use…….), right, what we are talking about here is a Downtrend Breakout. Please have a look at the Chart below. What you should see are 3 Distinct Price Channels in which the Price moved around over the last 5 years ish. As ever, we start with the Long Term view first to get the Context for Shorter Term Analysis. We have the Uptrend from a few years ago which is marked with Black upper and lower Channel Lines, and then we have the lovely Uptrend that ended in April 2014 which I have marked with Blue Upper and Lower lines (and if you really can’t see what I mean, there is a whopping great BLUE Arrow………), and finally we have the subsequent Downtrend which I have marked with Red Lines - and the Big Red Arrow. Time for a Who, sorry I mean a Detour - it really makes me laugh when people criticise or dismiss Technical Analysis and say it is “mumbo jumbo” or “tea leaves” or whatever. This Chart below shows very clearly how Prices move in Price Channels - if you can pick up the Skill to be able to quickly identify these Channels, it will make you a lot more Money. I hear such cr*p as “fooled by Randomness” and this sort of nonsense - how exactly are the Channels below a Random Pattern? Rant Over. Let’s move on.
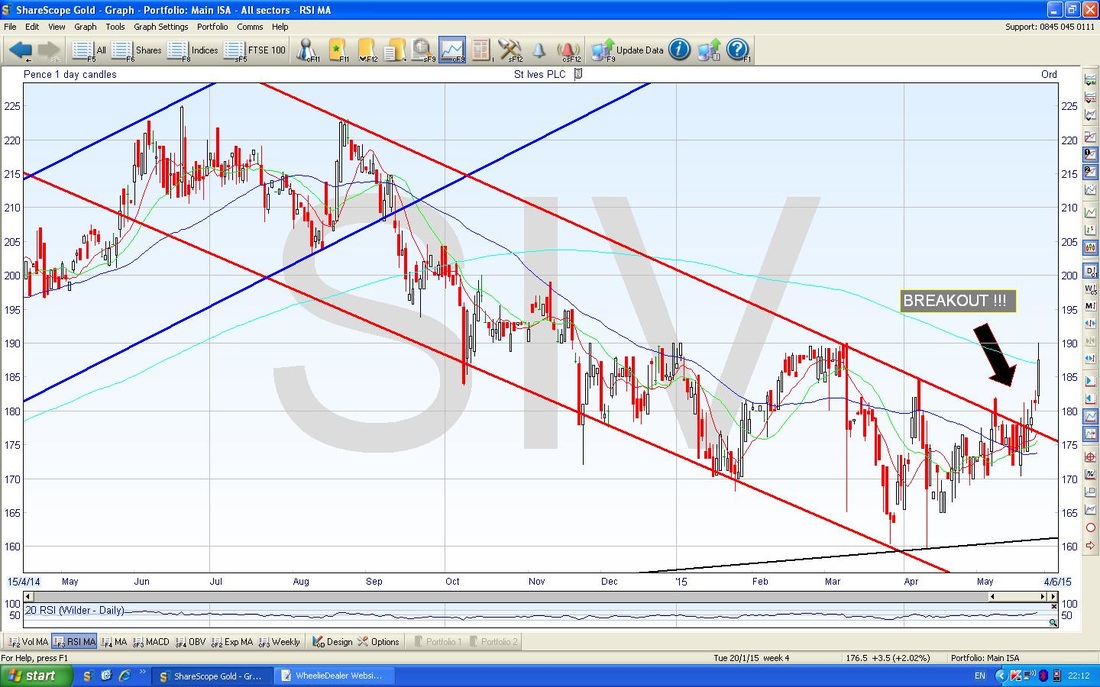
On the ScreenShot below, I have zoomed in on the Chart which I showed just above so that we are only looking at the last year really. Now you should see the Red Line marked Downtrend Channel and I have clearly marked with a Black Arrow where the Price Candles (Wheelie, you utter Swine - you promised no Candles in this one !!) did the Breakout from the Downtrend Upper Line. Heck, I have even labelled it.
The significance of this Downtrend Channel Breakout should not be underestimated - they have a powerful Technical Significance. The Upper Downtrend Channel Line is a ‘Resistance Line’ just like when we have Horizontal Resistance Levels on a Chart where a Price is unable to break through. Many Readers will know that when a Breakout of such a Horizontal Resistance Line happens, the Price often (nearly always really) shoots up very fast afterwards - it’s a bit like a Dam being breached and the water gushing through with immense power.
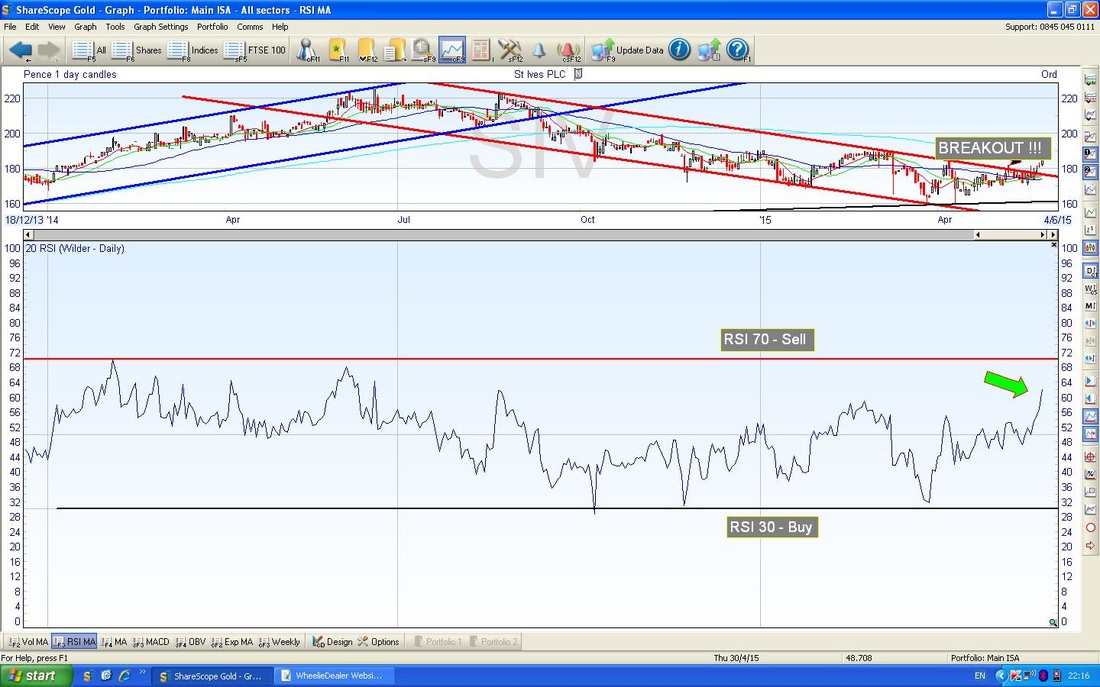
What often happens on such Breakouts through Resistance is that the Price shoots up but may then Reverse and head back down again and do a ‘Confirmation’, which is where the Price comes back to the former Resistance Line and tests this as a new ‘Support Line‘. It is a Technical Analysis Rule that “Former Resistance becomes Support” and “Former Support becomes Resistance” - simple but vital principles to learn. As I hinted earlier, I had been watching the Price move down this Downtrend Channel for weeks and have been eagerly anticipating the Breakout so that I could buy more at an Optimum time. I could have bought while the Price was still in the Downtrend Channel but the Risk in such an approach is that the Price can just keep going down - “Don’t Catch a Falling Knife” - it is always far safer to wait for the Breakout when you will know the Odds are massively on your side that the Price is likely to move up, not continue dropping. Patience………… As it happens (I am typing this on the Night of Friday 29th May 2015) I bought too early and the Price fell back during the day today quite a lot. This is disappointing but I took the view that even though the Price was up near the 200 Day Moving Average (the feint light blue line on the Chart above) which might act as Resistance, I have seen too many of these things Run Away and I have missed out. Resistance Breakouts like this can produce moves with very strong Upward Momentum. I expect the Price will do a ‘Confirmation’ around the Former Resistance Line of the Downtrend Channel and will then Reverse and head on up. It may not, we can never be 100% certain as all these things are Probabilistic - however the Odds are highly in my favour now that the Breakout has occurred. If the Breakout fails, then it is called a ‘False Breakout’ - I would prefer it if this does not happen. If you look at the Chart Below, in the Bottom Window you should see the RSI (Relative Strength Indicator). This is one of my favourite Indicators as it is very reliable and predictive and it is simple to understand. The Red Horizontal Line at the Top marks an RSI reading of 70 - the convention is that when the Wiggly Blue RSI Line gets up around this level, the Share Price is Overbought and is due to fall. If you look at my Green Arrow, you will see that the Current Price is at an RSI reading of about 62 - so it has plenty of room to move up in coming days without getting ‘Overbought’. For information, the Black Horizontal Line denotes an RSI reading of 30 where a Share Price tends to be Oversold and likely to start moving up - as I hinted, the Predictive Power of RSI is very good.
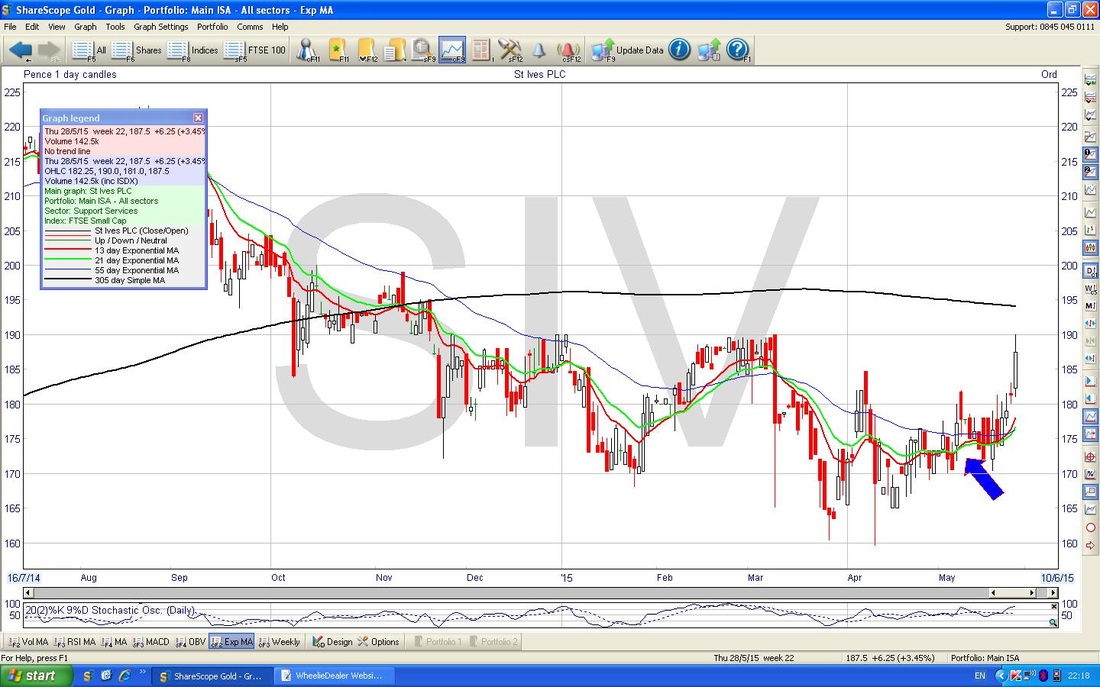
On the Chart below, please look at the Blue Arrow - this marks where the Red 13 Day EMA (Exponential Moving Average) line crossed over and above the Green 21 Day EMA line. This is marvellous because it is quite predictive of a Rising Share Price for a few weeks or longer.
On the Flipside, if the Red Line crosses below the Green line, then the Price will probably fall for some weeks or longer.
Come on, be fair, there weren’t all that many Candles……… Conclusion I really like the Strategic Moves that SIV is undertaking away from the slowly dying Printing Business. Digital Marketing in the online and mobile world are an exciting Growth area and I think the Company has been very astute in making this move. It’s worth noting that Centaur Media CAU is doing a similar thing. Considering the Strategic Logic, the Current Forward P/E Rating around 9 is very low and I will pick up a 4% Divvy to boot - what’s not to like? Note the Company has been doing Share Buybacks as well. The Technical Downtrend Channel Breakout suggests to me that this is the time to be buying in advance of a recovery in the Share Price back up to a more realistic Rating. nzuri alasiri, wd
4 Comments
John
3/6/2015 12:42:07 am
I have just recently topped up on SIV for what seem to be the same reasons although my analysis is much less thorough than yours. I have a screener that attempts to identify such possible reversals,
Reply
WheelieD
9/6/2015 04:26:51 pm
Hi John, good luck to you too !! Thanks for your comments - to be fair, I have done this in a lot of depth to help Readers but I tend to find that there are Key Items that if you get right tend to make you money. Stuff like Valuation, Timing, Buying Quality, Stake Building, Topslicing etc. make a lot of difference to results.
Reply
17/6/2015 02:12:14 am
Nice analysis and I like how you have quite a thorough review in assessing your share trades.
Reply
WheelieD
18/6/2015 05:55:11 pm
Hi Guy who Flies,
Reply
Leave a Reply. |
'Educational' WheelieBlogsWelcome to my Educational Blog Page - I have another 'Stocks & Markets' Blog Page which you can access via a Button on the top of the Homepage. Archives
May 2024
Categories
All
Please see the Full Range of Book Ideas in Wheelie's Bookshop.
|


