|
Well that was a rather pleasant Week for me, despite the drag of Superdry SDRY getting hit hard and On The Beach OTB leaping around all over the place around its Results but it is not something I am concerned about. My Portfolio gained 1.6% overall which is a very good outcome and I also had the additional joy which was caused by getting the Yearly Statement for my Prudential ‘With Profits’ Bond which has added 8.2% in the last Year which I think is the strongest Gain I have ever had from it in about 19 Years of ownership.
I have mentioned the With Profits Bond many a time and I have been so pleased with it over the Years. I must have about 15% of my Overall Wealth in it and it has some defensive qualities which make it quite a good diversifier. In the Credit Crunch it suffered but that was down to a thing called a ‘Market Value Adjustment’ (MVA) which is applied when you try to Cash it in but if you have held for something like more than 7 Years then an MVA does not apply to you and you can get out the Cash Value at that time.
The ‘With Profits’ bit means that they work on the basis of an ‘Annual Bonus’ which is variable and depends on how the Fund has performed and the beauty is that they retain some Profits so that when the Fund has a bad Year, they can still make a decent Annual Bonus and in the 19 Years I have held it that is exactly how it has played out. I remember the Year before last it paid out something like 7% which I am sure was the highest since I had owned it but to eclipse that this Year’s is awesome - obviously I was chuffed to bits to receive my Letter the other day. The other sweet thing about this is that the Value of my Investment in the Fund is now at its All Time High after many Years of compounding (having said that, I did take some Cash out a few Years ago) which means that the 8.2% applies to a larger Absolute Number - very nice.
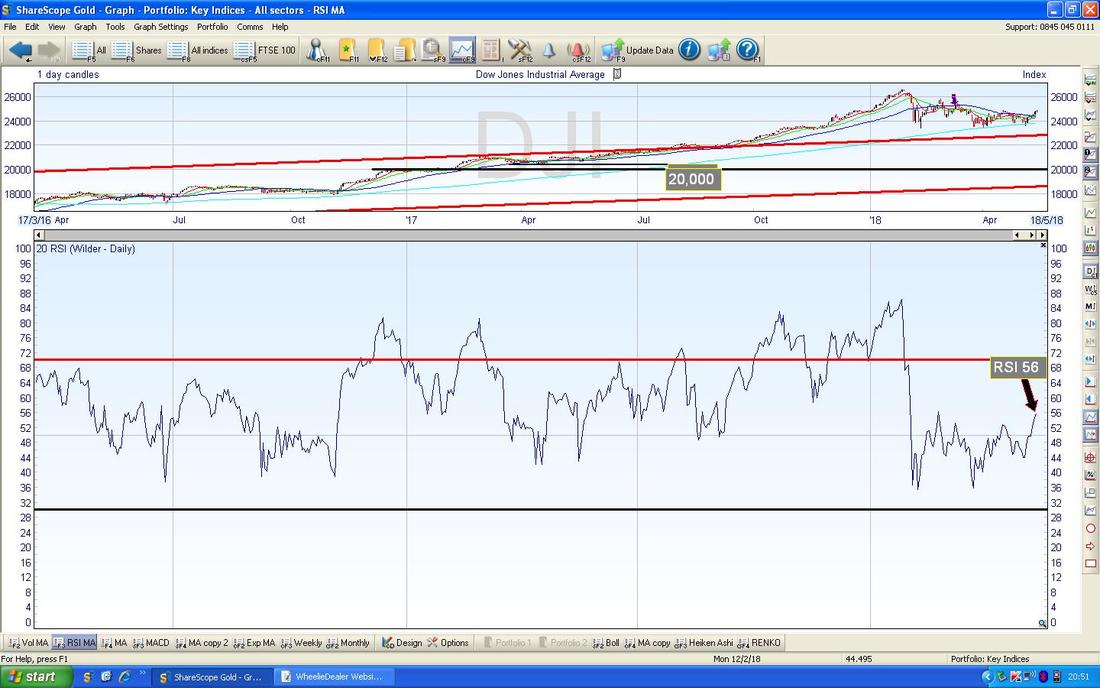
The Prudential With Profits Bond is the largest one of its kind and it is the sort of thing that all those awful Endowment Mortgages were linked to but mine is standalone and not tied to a Mortgage. I think the worst Annual Bonus has been perhaps about 3% but over the Years it has hugely outperformed Cash and I even think there was a thing called a ‘Terminal Bonus’ which was even more Money which was added to the Fund after I had held it for 7 Years - it is a shame more People don’t know about these excellent Funds. There are some Tax Advantages which I think is that you can take out 5% of the Fund per Year with no Tax Liability - although I am not totally sure of that. There is also a Life Insurance element to it. It’s not something I am too concerned about at the moment but I can see a situation in a few Years where I will need to Cash in a Chunk of this Fund because it will be too big a Proportion of my Wealth - although I won’t be in too much of a rush. Really it is a case of monitoring the situation each Year (it makes sense that I think about this just after December 31st when I do my ‘Scores on the Doors’ for the Year) and making sure that the proportions of my Wealth I have in various Pots are appropriate. Over time I would like to add more to my Income Portfolio as this might be easier/better for me to manage when I am really ancient and even more senile !! May Market Of course we are approaching the classic “Sell in May and go away and don’t bother coming back until St. Ledger Day”, and I had a quick look in my old copy of the UK Stockmarket Almanac from 2016 and the usual pattern is that the FTSE100 is down a tiny bit over May (down 0.2% I think it said) but more crucially it is usual for the FTSE100 to rise for the first 2 Weeks of May but then to fall away in the final 2 Weeks. I guess you could argue we still have 3 Weeks of May to go although the last Week would be just a few Days but if the Markets follow the normal pattern then perhaps things could start tailing off soon. However, after such a dismal start to 2018 I suspect much Selling has been done already and if anything a lot of Investors/Stockmarket Participants will be heavily in Cash and as the Markets start to perk up they are probably going to panic to get their Cash in. This is also supported by the idea that the ‘Hunt for Yield’ is still on and what is truly amazing is that even after around 8 Years or so of the Longest Bull Market in history, there are still loads of Quality Large Stocks with Dividend Yields of 4% or more and with Interest Rates still low (and likely to remain that way), these kinds of Stocks could easily attract Income Buyers. On the subject of Interest Rates, the only Central Bank which seems to have any intent to push them up is the US Federal Reserve but even there the Fed Funds Rate is only something like 1.75% still and any Rate Rises are likely to be pretty slow. In the UK the Economy looks pretty tepid and there is no way the Bank of England will be taking chances with Raising Rates so it is most likely Rates will stay low here. Europe was growing quite fast recently but seems to be slowing down - with such concerns it is equally likely that SuperMario will not be raising Rates fast (if at all). Asia seems to be growing well and the US appears to be delivering 2% to 3% GDP growth which is still low by historical standards but is the best since the Credit Crunch. Anyway, I will be taking no chances and I will be monitoring the Charts every Night for signs of trouble and will Hedge if need be. With recent Price Action on all the Major Indexes, I think the likelihood of trouble has significantly reduced and if anything the focus now should be on when the FTSE100 takes out the previous All Time High (ATH) at 7800 and powers on to 8000. My hunch is that we will see 8000 during 2018 and probably higher. With Summer around the corner I will not be doing much and I am very happy with my Stocks and my Overall Exposure to the Long Side. I want to add a Stock or 2 to my Income Portfolio but I am taking my time over this and want to be sure I am making a very good Decision. Of course I will be keeping a good eye on my Stocks and if I need to Topslice or perhaps even Sell something then that is what I will do. Summer Markets can be a bit ‘funny’ so I am not willing to take on even more Long Side Risk - I have plenty thank you very much. Anyway, I have loads of other Projects in the fire which will be taking my attention……. New Motor I have tentatively been thinking about buying a silly New Car for several months now (I have a mate to blame because I was helping her buy a Vauxhall Cascada a few Months ago and the process of doing this got my taste buds going and led me down the slippery slope) and whilst the Markets were a bit miserable I have been less enthusiastic about spending Money but as things are perking up and I am feeling quite flush, it seems like I should take the plunge and get things moving. At the moment my ‘workhorse’ Car (I also have an old BMW Z3 2.2 convertible which is really my fun Summer Car) is a Seat Leon FR 2.0 DSG which is essentially a Golf GTI with 200bhp underneath and a much cheaper ‘top’ on it although personally I think it looks much nicer than the Golf and being a DSG it has the ‘Flappy Paddles‘ as well. Anyway, I have owned that one for about 11 Years having bought it from new and I love it to bits but it has struck me that I am not getting any younger and I just fancy a really ‘mental’ Car even though I drive like an old Granny. It is just nice knowing you have the Punch there if you need it and remember I used to be a Bike Rider so I do like a bit of welly in my Cars. Part of my thinking is that we must be nearing the End of the Line for Petrol Cars (there is no way I would have a stinky, rattly, Diesel !!) and this is probably pretty much my last chance to buy a Nutty Petrol Car and of course with Interest Rates on the floor I can borrow money very cheaply (my Bank is offering just over 3% to borrow £20k for 5 Years which is probably what I will do because I don’t want to use up my own Capital that I can probably earn 10% a Year or more on and it also makes things easier for me rather than having the hassle of trying to Sell Assets that I want to free up the Cash). So, to satisfy this silly and unnecessary urge, I am looking at buying a Seat Leon Cupra DSG 300bhp (the ‘Cupra’ is derived from ‘Cup Racer’ and this Car is pretty much a Golf R or Audi S3 but without the 4 Wheel Drive but unlike my old Leon the build quality inside is excellent) and I visited the closest Dealer to me down on the outskirts of Reading (near Caversham) on Friday and had a chat with them but I don’t think they can really get down to the Deal I am after. The List Price for the Spec I want is about £31k and the guys in Reading would go down to just under £29k but having used Carwow.com I have been quoted one for £26k which is an incredible price. Anyway, part of the catch is that the Deal is quite complicated because my existing Leon has Hand Controls (for Readers who did not know, I am a Paraplegic Wheelchair User after having a Motorbike Accident back in 1998) and of course I need to have Hand Controls put on the New Cupra which introduces some logistics challenges with the Car needing to get to High Wycombe where the work can be done. But just to complicate things more, because of my Disability I am allowed to buy the Car with the VAT off - which is wicked because it means I get 20% VAT off of the £26k which brings the Price right down to perhaps £22k or less - this is a huge saving but I really want to talk to the Dealer face to face about all this. The catch is that the Hand Controls will probably cost about £3k though so it is not as sweet a situation as I would like but that is partly my fault because I could have some basic Hand Controls which would cost around £600 but I don’t really get on with them and the far more expensive option suits me better. The £26k Dealer is based down in Tunbridge Wells which is about an hour away from where I live in Windsor so I will try to pop down there this Week and get things moving along. Anyway, my existing Leon has done only about 45k Miles and has a Full Service History and all that - so if you know anyone who wants it then give me a shout (you can email me on [email protected]). It needs 4 new Tyres but it has just been given a full Year’s MOT. I am hoping for about £3500 but would take any sensible Offer. I would like to sell it with the Hand Controls in place but they could easily be taken off and the Car would be pretty much back to ‘normal‘. It is in Silver and has a few marks here and there but it is overall in pretty good condition but it will need Car Tax because it has up until now been registered as a Disabled Vehicle which is exempt from Car Tax. Blog Slate So, this Project is going to take up a fair bit of my time in the next few Weeks so I might not be around on Twitter quite as much and I will be short of time to write Blogs - although I have got some decent Drafts ready which should mean I can keep the flow coming. Last Night (Saturday 12th May) I wrote a Blog Draft extolling the virtues and importance of Dividends and it is quite likely I will publish that one later this Week but I am also working on a Stock specific Blog and there is another Blog covering a few Stocks which is in the pipeline. I also have the one on ‘Patience’ which is half written. Right, let’s look at some Charts for goodness sake….. Dow Jones Industrials Index As always the Charts I will show in this Blog are taken as ScreenShots from the superb ShareScope software that I subscribe to and if you click on them then they should grow bigger so you can see some detail. If you have been reading my Charts Blogs of recent Weeks then you will know all about the Triangle between the Red Line (Red Arrow) and the Black Line (Black Arrow) on my Chart below. You may remember I have been quite nervous for ages because I was concerned that the Price would Break-down below the Black Support Line but as it happens, things have hugely brightened up for Bulls in the last Week with the Price Breaking out to the Upside of the Red Resistance Line (I am pointing at the Breakout with that ridiculously over-sized Green Arrow). This is a really Bullish event and it should mean we get more Gains. My Small Yellow Circle is capturing the White Up Candle from Friday and that looks really like a normal ‘Continuation’ Candle and implies more Gains to come. Note there is quite a bit of Resistance up above now particularly at 25000, 25400, 25800 but with a bit of chopping about I suspect it is very possible the Price will go higher. That Triangle Breakout is extremely significant. My Blue Arrow is pointing at the 50 Day Moving Average Line and note it was heading down towards the Lighter Blue Wavy Line which is the 200 Day Moving Average. If the 50 Day MA had crossed the 200 Day MA from above then that would give a Bearish ‘Death Cross’ but it looks possible that we can avoid this now - the 50 Day MA can turn up quite fast once the Price properly perks up.
In the bottom window on the Screen below we have the RSI (Relative Strength Index) for the DOW Daily. On a Reading of RSI 56 this has loads of room to move up and we could see quite a move on the strength of this evidence.
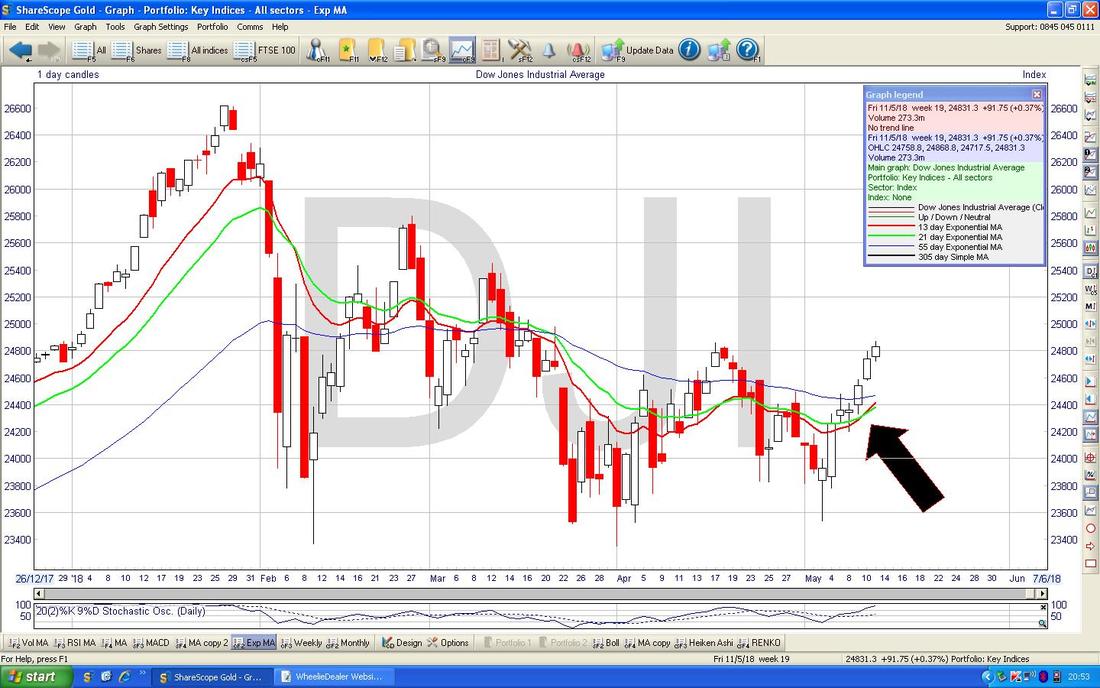
Next we have one of my favourite Indicators - my Black Arrow is pointing at where we have a Bullish ‘Golden Cross’ between the Red Line which is the 13 Day EMA (Exponential Moving Average - more recent Numbers are given a higher weighting so it is more ‘timely’ than a normal Moving Average) and the Green Line which is the 21 Day EMA. Such Crosses usually mean we are in for some Gains for a few Weeks.
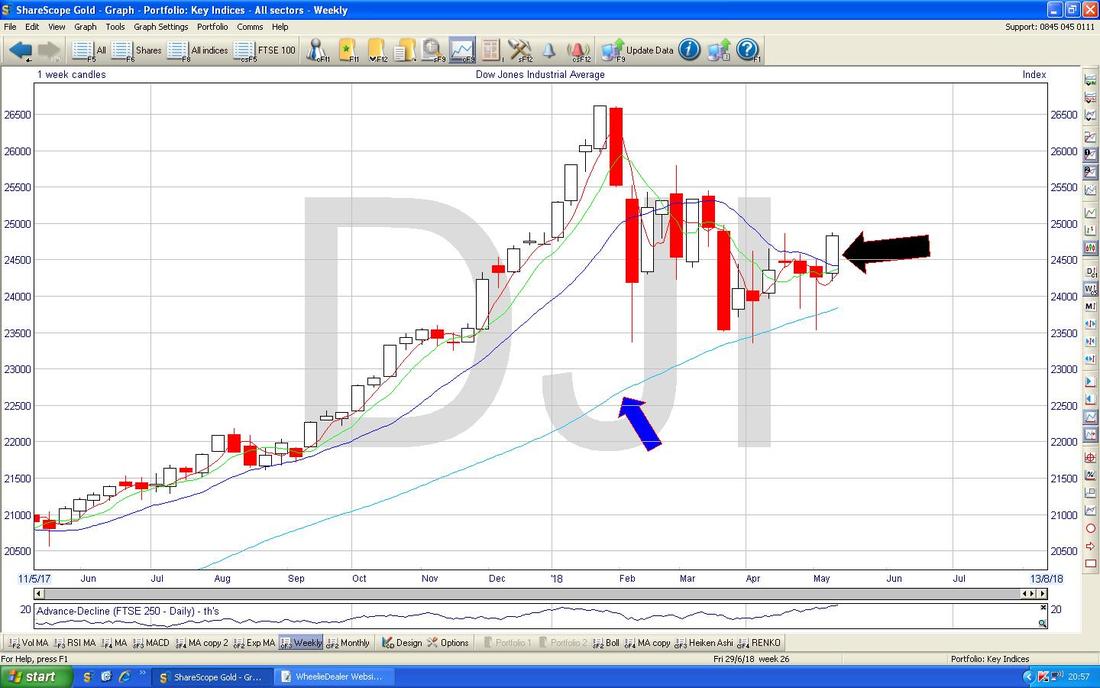
Now we have the Weekly Candlesticks for the DOW. My Black Arrow is pointing to a beautiful White Up Candle and note firstly how it turned up off a Hammer Candle from the Week before but it also has turned up off the 200 Day Moving Average which is marked with my Blue Arrow. Lovely, and suggests more gains.
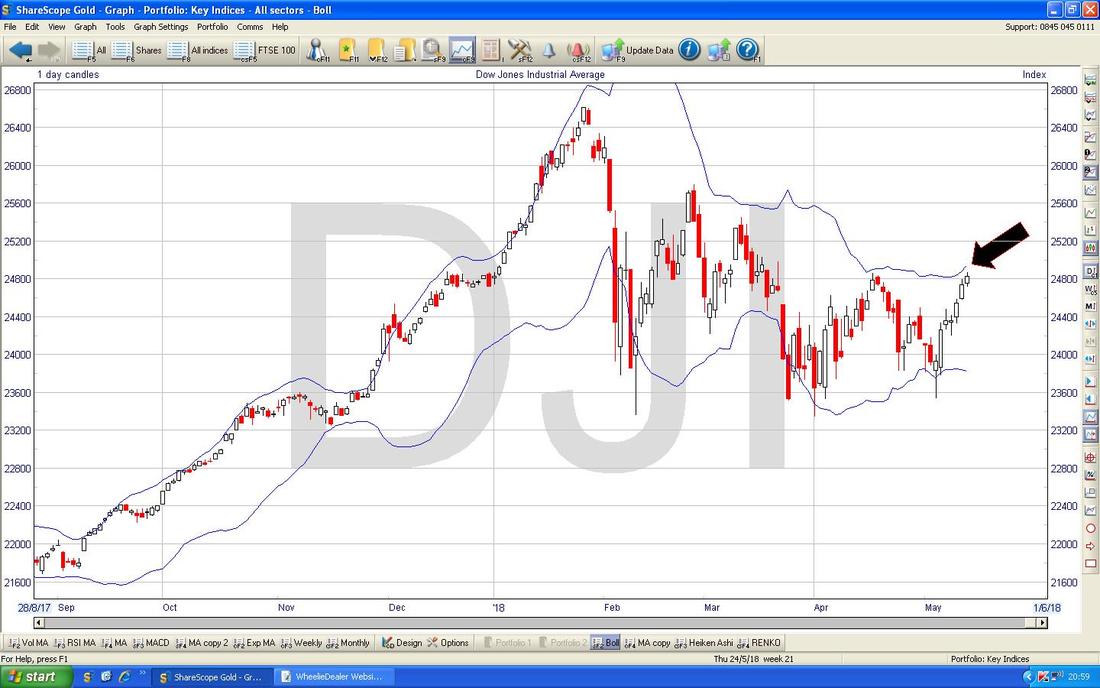
On the Chart below we have the Daily Candles for the DOW with the Blue Wiggly Bollinger Bands above and below. My Black Arrow is pointing to where the Candle from Friday got pretty near the Upper BB - this implies that we might hit Resistance here and have to turn down a bit but like with all Charting/Technical Analysis stuff this is not a definite prediction it merely shows what is most likely to happen and it is very possible that the Price can ‘hug’ the Upper BB and keep rising.
S&P500
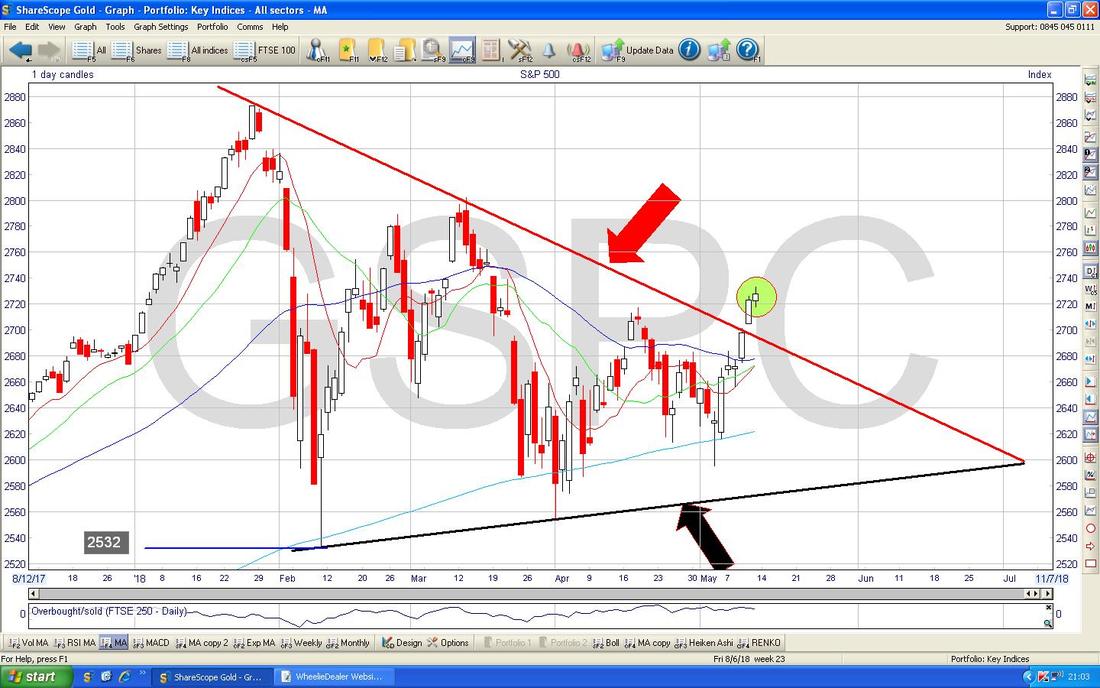
I was expecting the S&P500 to be pretty much the same as the DOW but there are some early signs perhaps that it does not have the upwards oomph that the DOW seems to have. On my first Chart we have a Triangle pretty much like the DOW but my Small Green Circle is highlighting what I call a ‘Cotton Reel Doji’ from Friday and although these are not always a Reversal Signal it could be hinting that the move up of recent Days is weakening. Of course it was generated on a Friday and those Days are the ‘funniest’ of the Week as far as I am concerned (hence you will mostly find me down the PUB that day !!). While we are on it, note how the Darker Blue Wavy Line 50 Day MA is levelling out here and looks better than the DOW.
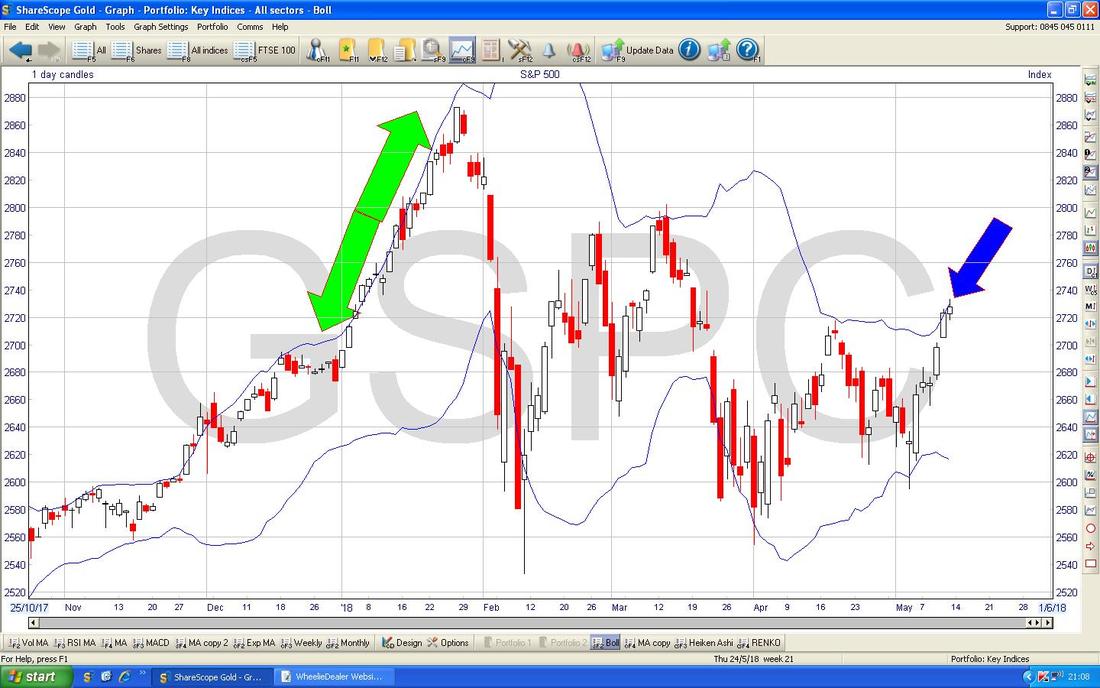
My Blue Arrow below is showing how the Price on the S^P500 is up at the Top Bollinger Band - this might mean it turns down or goes Sideways but like I mentioned on the DOW, where my Green Arrows are we have a great example of how the Price Candles can ‘hug’ the Bollinger Band and keep rising.
Nasdaq Composite Index
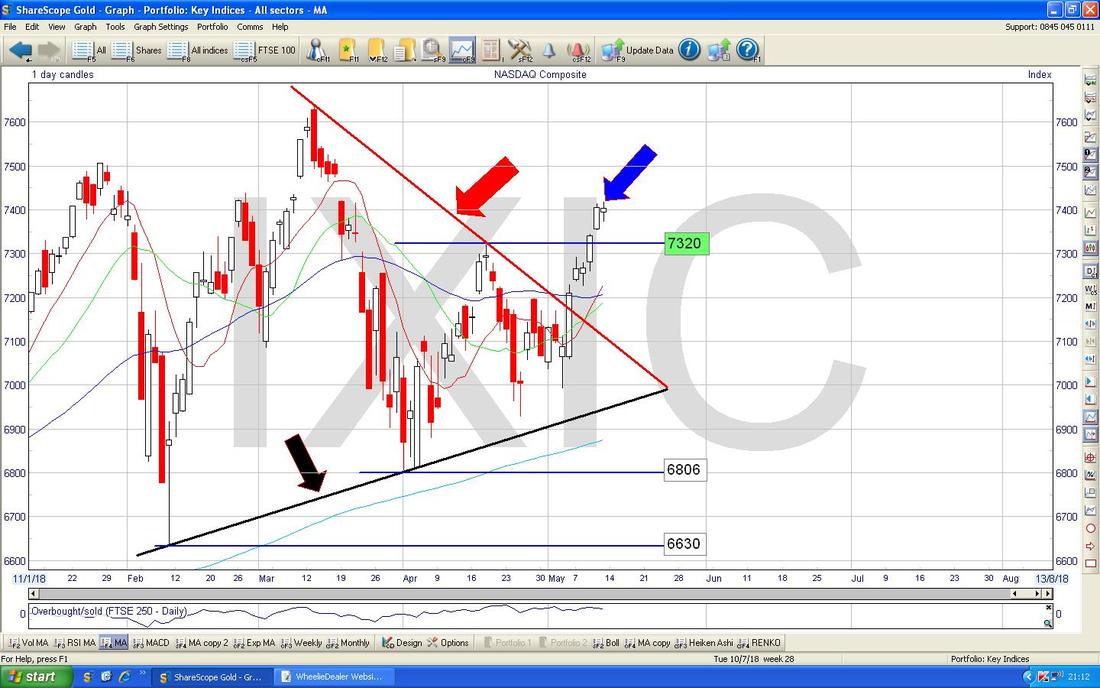
The Nasdaq is of course the US Tech Index and again we have the Triangle upside Breakout but where my Blue Arrow is we had a Small ‘Spinning Top’ Doji (my name !!) and this is ‘Inside’ the White Up Candle from Thursday so it is very possible that the Price turns down off this although it that does happen, it might just be a small Pullback which will find Support not far below, perhaps around the 50 Day Moving Average at 7200 ish and 7000 is a strong Psychological Support Level. For time reasons I won’t show it but the Price on the Nasdaq Comp is up near the Top Bollinger Band again.
French CAC40
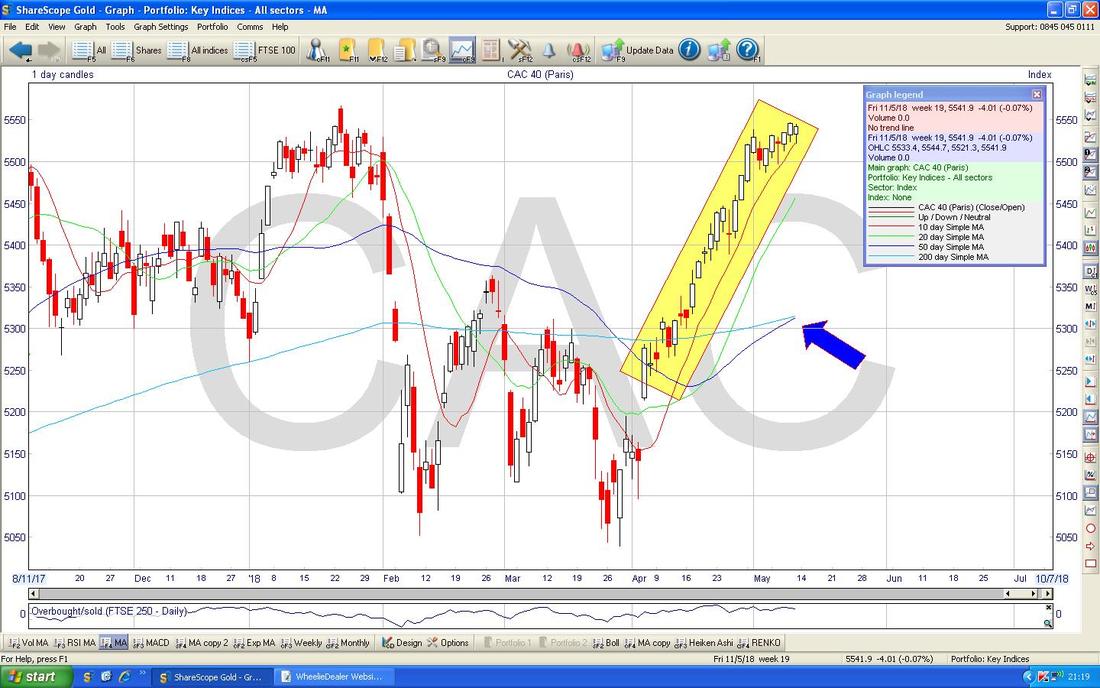
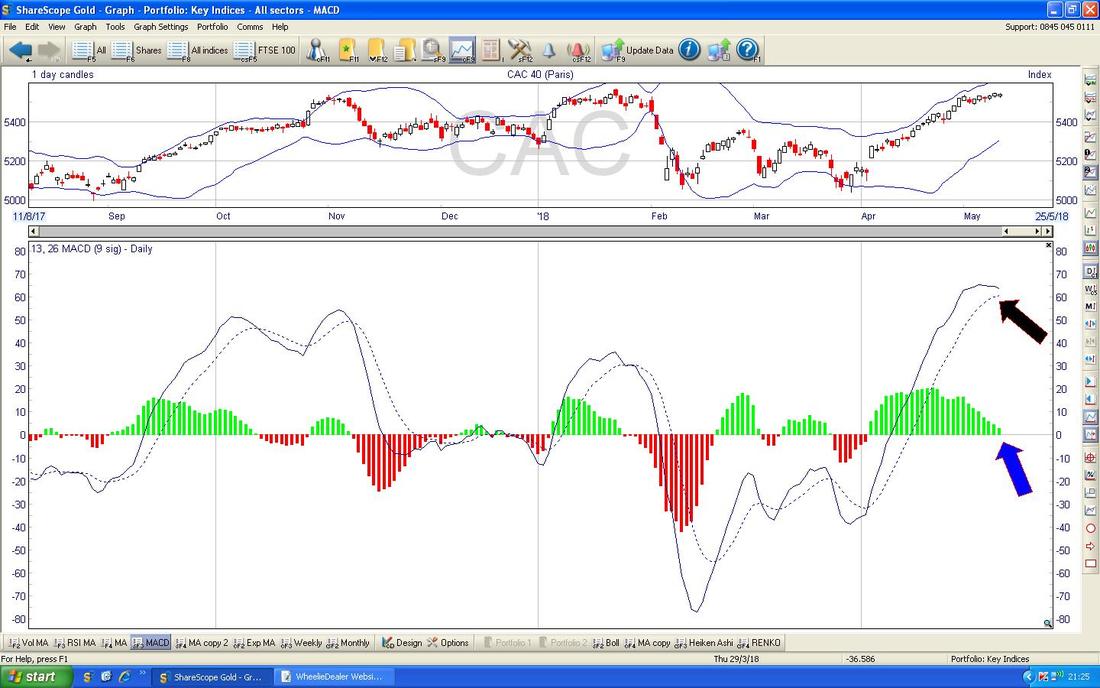
I don’t usually look at this one but I noticed something interesting and thought I would mention it as Readers might find it educational (so might I !!). On the Chart below note how the Price has had an amazing Run up lately which is captured in my Big Yellow Box but it is noticeable that in recent Days the force of the move Up is ‘flattening’ - this is what grabbed my attention. It makes sense because the Price is up near Resistance at about 5570. Note also my Blue Arrow is pointing to a Bullish 50/200 Day MA Golden Cross - this implies more Gains in coming Weeks/Months.
Where I said the force of the move Up seemed to be weakening on the Chart above, this is reflected on the Bottom Window on the Screen below which has the MACD (Moving Average Convergence Divergence) for the CAC Daily and my Black Arrow is pointing to where we are very near a Bearish MACD Cross on the Signal Lines format and the same negative thing is shown below where my Blue Arrow is in the Histogram Bars format (I prefer the Bars as it is very clear and easy to see and the ‘Humps’ help you see the moves).
If we get the Bearish MACD Cross then expect the CAC Price to drop but if it misses the Bearish Cross and ‘Skims off’ or ‘Glances off’ then that would be really Bullish.
FTSE100
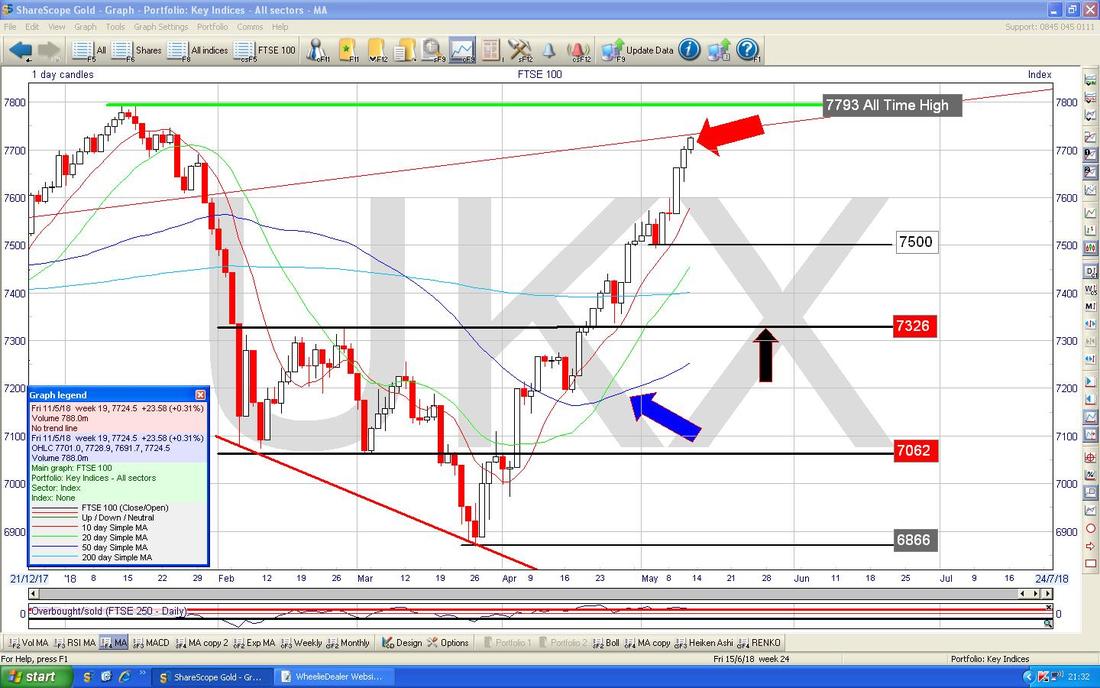
Of course the FTSE100 has been helped recently by a strong Oil Price driving up the Oil Stocks and a Weak Pound as the Dollar strengthens has also helped. On the Chart below my Red Arrow is pointing at a Small White Up Candle from Friday but the move up looks very stretched and we are so close to the All Time High at 7793 which is marked by the Green Horizontal Line. It seems likely we will get a Pullback soon and perhaps the Price will have a go at the ATH first before dropping back - but note there is Support at 7500 and then back down at 7326 where my Black Arrow is there is very Strong Support which is where the Resistance of the Top of the previous Range was broken out of and now becomes Support. The 200 Day MA at 7400 should also be good Support so we are well placed if another bout of weakness hits. My Blue Arrow is pointing to the Blue Wavy 50 Day MA Line which has turned up and if things stay buoyant we should get a Bullish Golden Cross soon with the 200 Day MA and this would implies Weeks/Months of gains ahead.
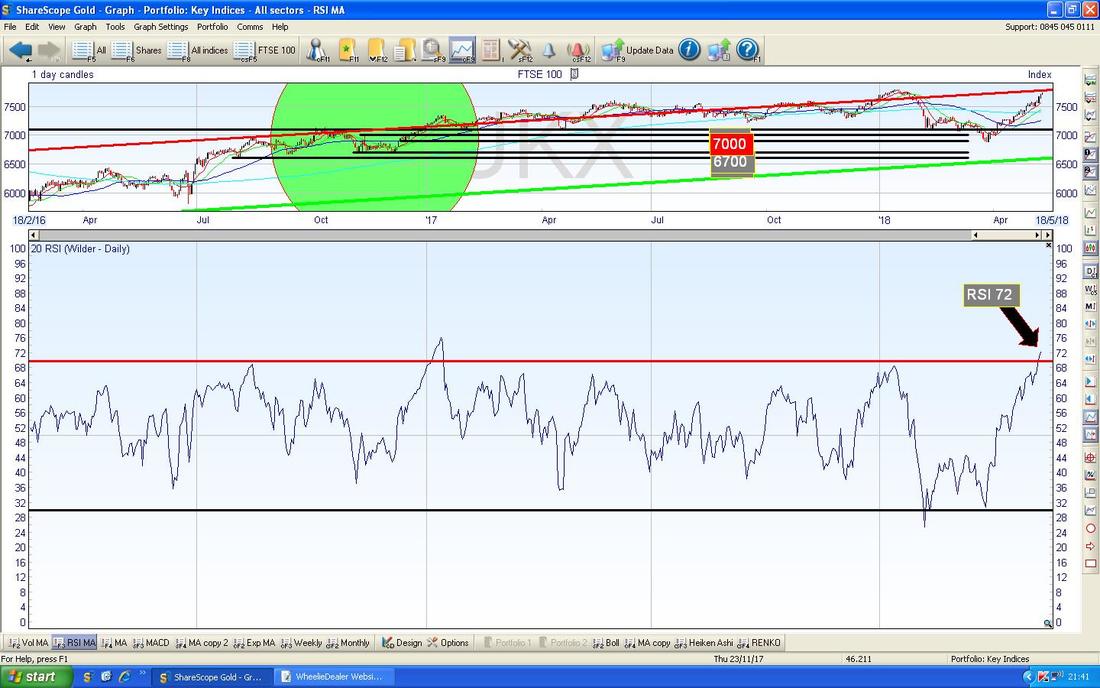
This is an interesting screen. In the Bottom Window below we have the RSI for the FTSE100 Daily and on a Reading of RSI 72 this is extremely high - this implies that the FTSE100 will either drop back soon or go Sideways but will struggle to rise much more. On the basis of this, I might look out for a Signal to Short the Index in coming Days.
For time reasons I won’t show it but the FTSE250 and Smaller UK Indexes look quite toppy as well but not as bad as the FTSE100. However, if the FTSE100 drops it usually takes the other Indexes down with it. I am not expecting a huge collapse here by any means but we might just get a bit of a Pullback soon.
Let’s do some Stocks.
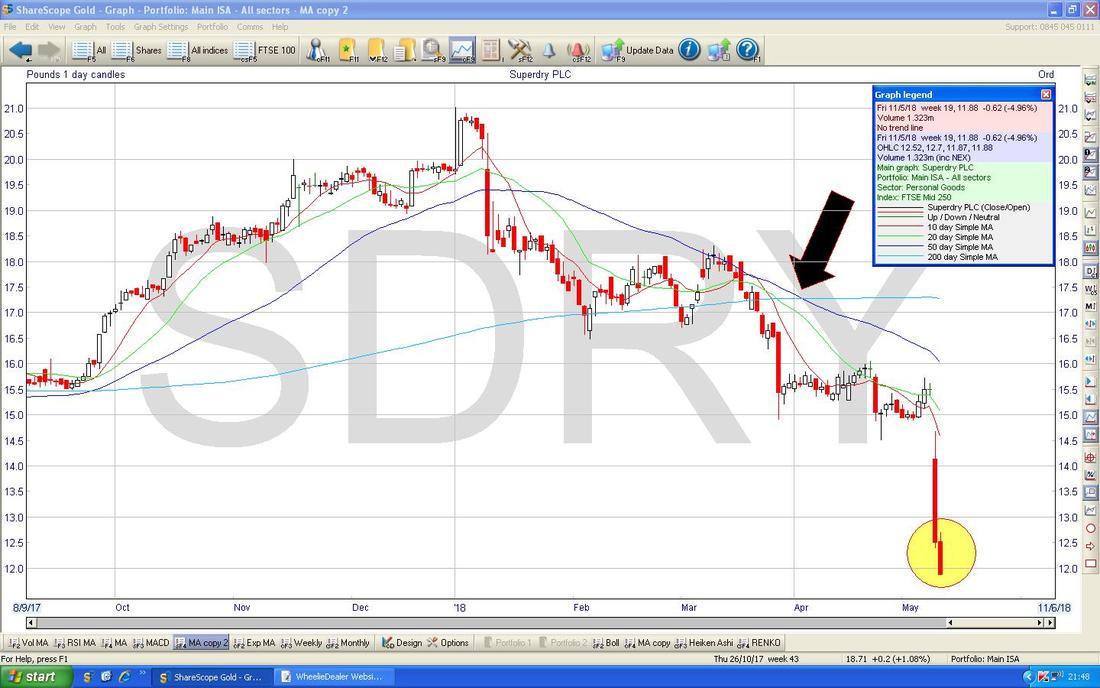
Superdry SDRY This one was a bit of a Shocker last Week and caused me some damage because I have quite a large Position in SDRY. However, I am not panicking and I think this looks a huge over-reaction to a Trading Update which gave Guidance which implies Sales and Profits are going to slow down a bit - but the Company is still really a Growth Stock. I like the Story here and I can see SDRY being a much bigger Business in a few Years and that is the Growth that I want exposure to - and the Valuation doesn’t look too bad to boot. At the last Year End SDRY had just over £71m of Cash and this is a sizeable chunk of the Market Cap which is now £970m. The Update came out on Thursday and I know some Analysts/Brokers amended their Forecasts but I am not sure if the Figures I have on ShareScope are totally up to date now. However, ShareScope has an EPS figure for ‘Apr 2019’ of 110.64p and if we amend that slightly to 105p to allow for some adjustment to the Forecasts, then on a Current Share Price of 1188p that gives a Forward P/E of 11.3. It would also be reasonable to strip out the Cash and calculate the Forward P/E which would mean we probably get nearer 10 (I think I have been conservative here). The Forecasts are for 3.16% Dividend Yield in 2019 and with the Cash Pile it is highly likely that will be paid out. For a Growth Stock that is cheap in my view and if my amendment to the EPS is overdoing it, then the Forward P/E is even cheaper. On the Chart below of the SDRY Daily Candles, my Yellow Circle is highlighting a Big Red Down Candle from Friday and as yet there is no evidence of a Reversal Candle of any sort. Such a Signal would be a Hammer or perhaps a 2-Day Harami Pattern which is the ‘Pregnant Lady viewed from the side’ one. I expect we will get some sort of Reversal Signal in the next couple of Days. My Black Arrow is pointing to a ‘Death Cross’ between the 50 and 200 Day MAs and that implies weakness for some time. Of course it is never good to buy a ‘Falling Knife’ and this has that look about it but for cautious Bulls who like the SDRY Long Term story, the wise thing might be to use the Drop as a chance to start Stake Building with a view to buying more as things develop.
ITV plc ITV
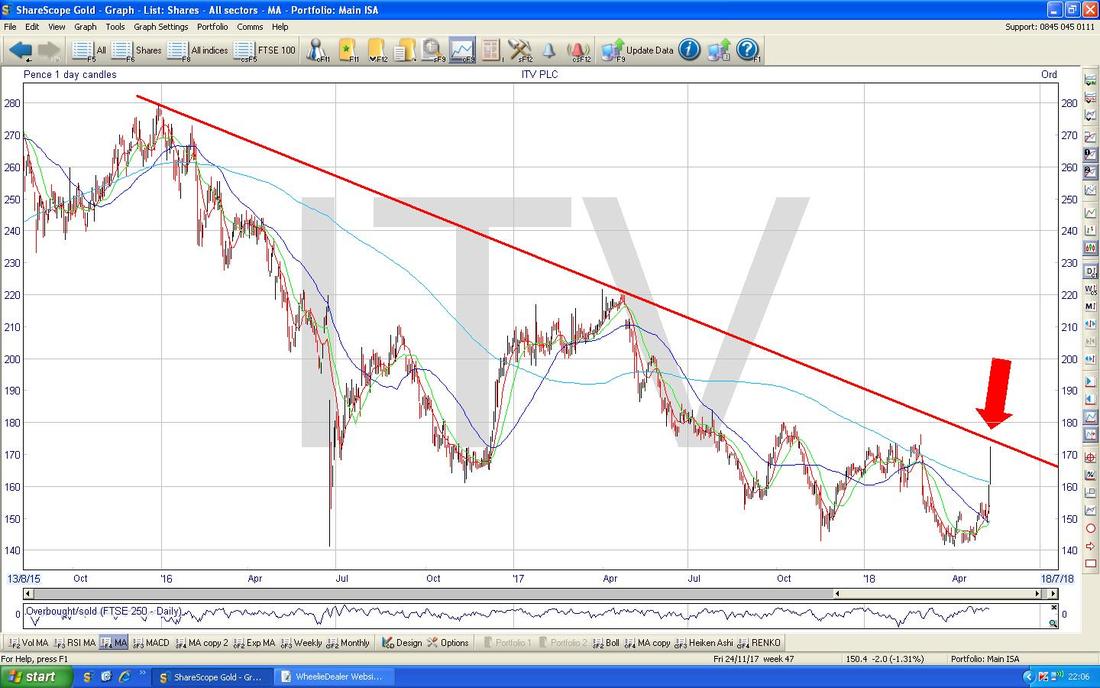
I don’t hold this one but it looks very good value to me. I hold lots of Entertainment One ETO and I see a fair bit of similarity between the two so I don’t want to hold both. The drag on ITV for pretty much 2 years has come from worries over Advertising Revenue which has been falling away as Ads move from TV over to the Internet and Mobile. However, a couple of Days ago ITV put out a very good Update and said that Advertising Revenues were actually rising again and with the Studios bit going really well and with Takeover potential as well, ITV looks very good. The new boss Carolyn McCall from Easyjet EZJ has a very good reputation. ITV is on a Forward P/E of 11 and has a Forward Dividend Yield of 4.9% which is bound to attract Income buyers. It has a fair bit of Debt but it is only a bit over 1 Year’s Profit Before Tax (PBT). On my Chart below you can see the Red Downtrend Resistance Line which is marked by my Red Arrow. As yet the Price is still inside this Line but when it Breaks-out that would be a really Bullish Sign and a move up over 180p would signify that such a Breakout has properly happened. Buyers who really want ITV should get buying a bit of their Stake pretty much straightaway and then if it Breaks-out that would be the time to Buy more. Cautious Souls should wait for the Breakout because before the Breakout happens there is a risk that the Price can fall back again. Right, I better leave it there. Good luck for the Week ahead, Cheers, WD.
2 Comments
Paul Hunt
14/5/2018 11:20:15 am
Go for that car and enjoy it and spend less time on your charting and go for your share picks which are top notch researched so it doesn't matter if the indexes are showing up / down or round the corner. Good quality shares will always outperform in the long run. Spend your quality time out driving and down the pub - but not sat the same time!!!!!!
Reply
Damo
15/5/2018 11:54:34 am
Thanks again Pete , I hold ITV so am happy to see that perking up . I see why its called a resistance line tho ☺️. I've had another go at SDRY as it owes me 0.25% from previous attempt . Glad I got rid of sqz now , it cost me but a lot happier with the sipp now.
Reply
Leave a Reply. |
'Educational' WheelieBlogsWelcome to my Educational Blog Page - I have another 'Stocks & Markets' Blog Page which you can access via a Button on the top of the Homepage. Archives
May 2024
Categories
All
Please see the Full Range of Book Ideas in Wheelie's Bookshop.
|


