|
THIS IS NOT A TIP OR RECOMMENDATION. I AM NOT A TIPSTER. PLEASE DO YOUR OWN RESEARCH. PLEASE READ THE DISCLAIMER ON THE HOME PAGE OF MY WEBSITE. IF YOU COPY MY TRADES, YOU WILL PROBABLY LOSE MONEY.
You might have noticed that I picked up some more Sainsburys SBRY shares on Monday 16th November at 242p for my Income Portfolio - so they now make up about 10% of the Income Portfolio exposure. I had been weighing up whether or not to buy more SBRY for a while and was sort of dithering because obviously the Sector faces some challenges at the moment. However, my Decision was forced a bit because I wanted to buy more Shares in something following the Terrorist Attacks in Paris on Friday 13th November - because if everyone Sells when the Market re-opens after the Weekend then we are letting them scare us and surrender to their vile intentions.
I had a look through my Stocks on Sunday Evening and I was faced with only a few Shares that I wanted to top up on (as I already have loads of most of them) and SBRY stood out as a pretty good opportunity to be buying. As ever, all the Charts and Tables I include in this blog are as per the situation facing me when I made my Decision to Buy more on Sunday Night.
Bull Case It’s probably a bit strong to call it a ‘Bull Case’ - in reality, it is more a ‘Tortoise Case’ or something like that because there is no way I am expecting fireworks here - especially not in the Short Term anyway. In summary, my buying reasons are as follows:
http://www.j-sainsbury.co.uk/investor-centre/investor-news/rns/
Bear Case
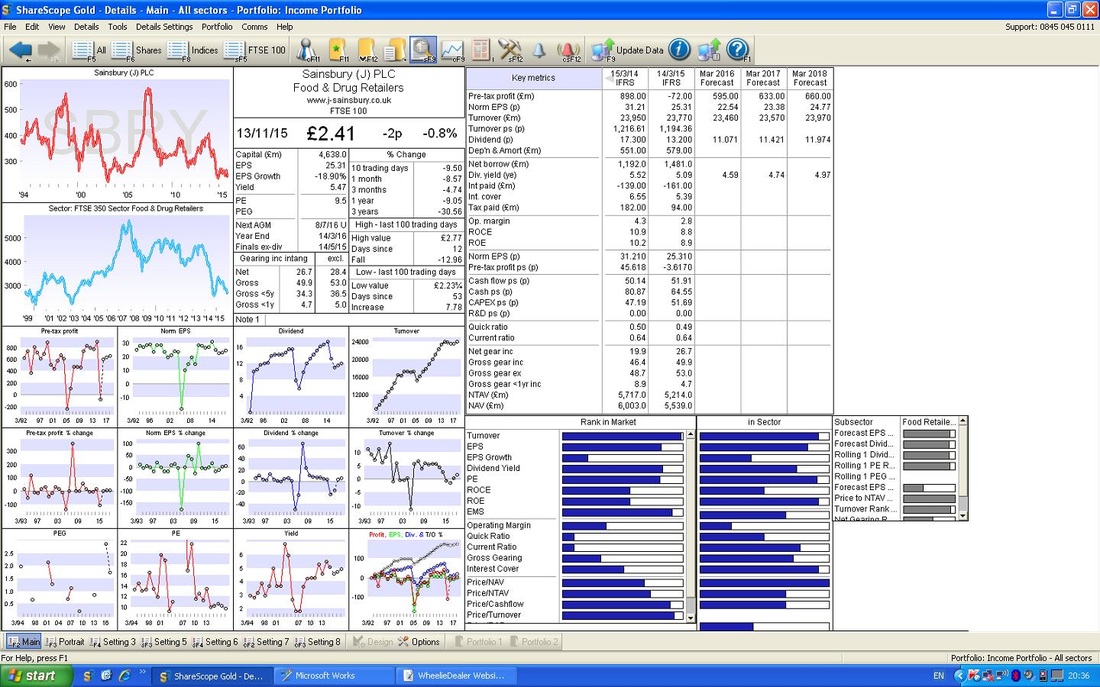
Valuation and Target Please look at the ShareScope screenshot below which shows the ‘Details’ screen as it looked to me on the evening of Sunday 15th November 2015. If you look in the Top Right Hand corner, you might see ‘Norm EPS (p)’ for ‘Mar 2017 Forecast’ of 23.38p. At my Buy Price of 242p, this gives a Forward P/E (Price divided by Earnings) Ratio of 10.4 (242p divided by 23.38p) - this strikes me as pretty good value (obviously this assumes that Consensus Broker Forecasts are about right - but if anything there must be scope for SBRY to beat these figures). In terms of the Dividend, the expected Payout for next year is 11.421p which means a Forward Dividend Yield of 4.7% on my Buy Price of 242p. Note: I always work out these P/E and Divvy Yield figures myself using the numbers provided. Never trust printed P/E and Divvy and PEG figures etc. Always get your calculator out. Because I hold this in my Income Portfolio and I am mainly after a steady Dividend Stream year in, year out, I am not overly focused on a Target Price to sell at. However, I would think that the recent highs around 400p must be possible in a couple of years with a lot of patience. I told you this was not an exciting Investment !!
Technicals
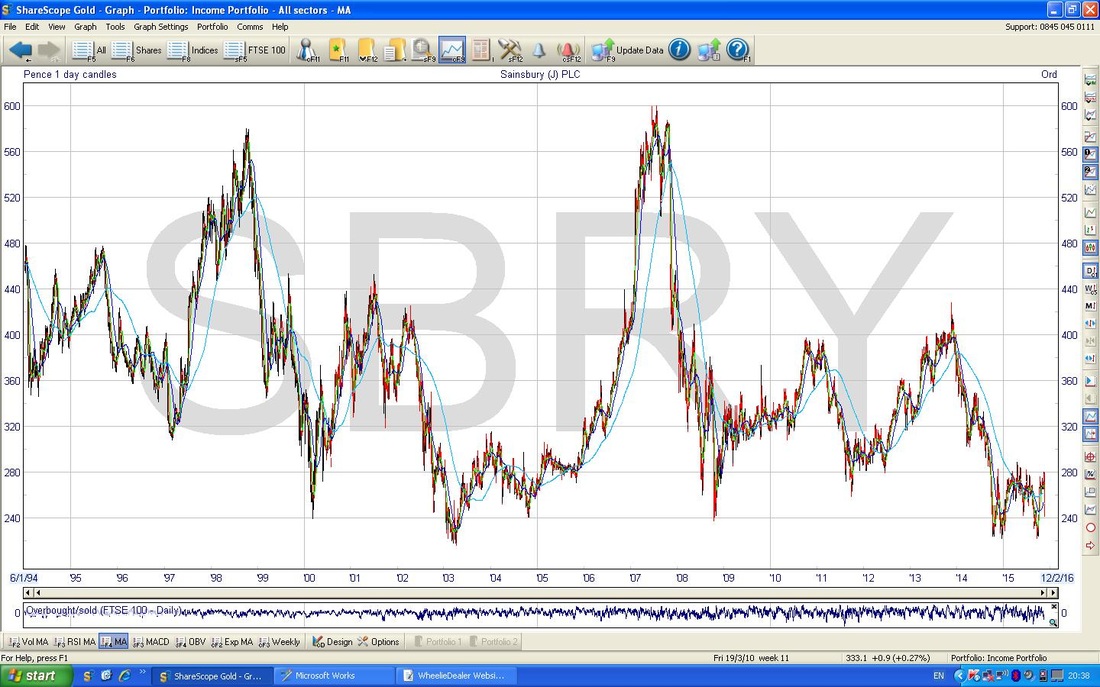
The Chart below shows something like a 20 year view for SBRY - the standout for me here is that it has really been in a huge Range - with the Floor down around 220p and the Ceiling up around 600p. What is really attractive for me now is that it is down on the Floor - this will not have escaped the notice of the majority of Stockmarket Observers.
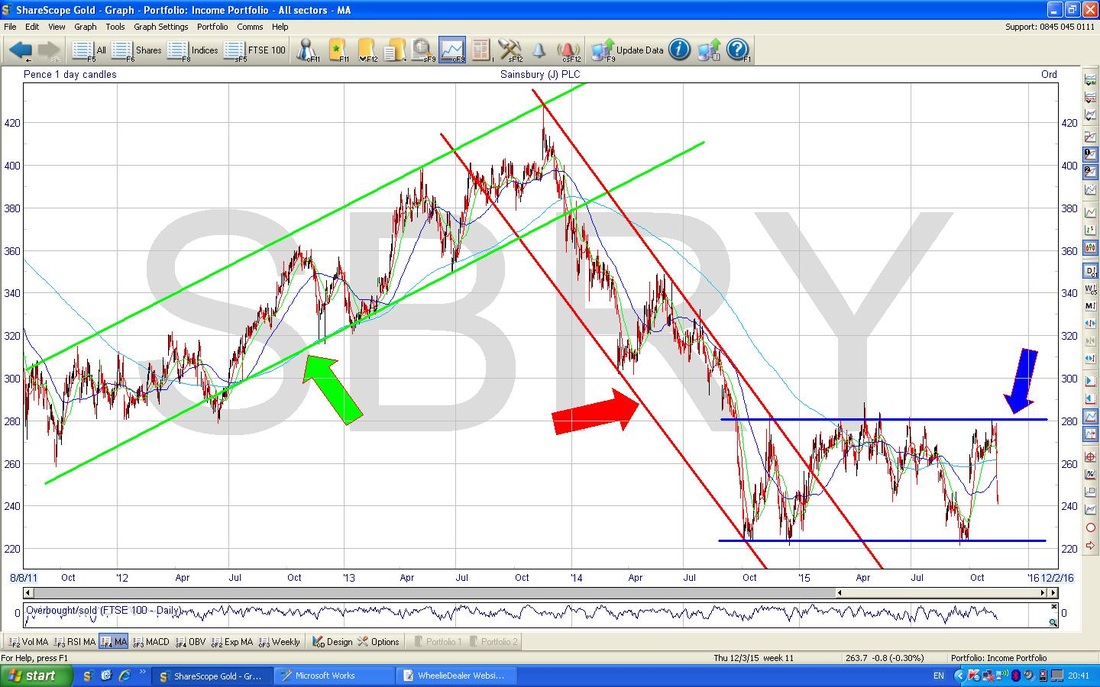
The Screen below shows the Chart over about the last 3 years and I have chosen this because it shows 3 distinct phases (if you read my recent Blog on Quantum Pharma QP. you should be reminded of the Phases I talked about on that Chart).
In this case, we start off with an Uptrend Channel which I have marked with the 2 Parallel Green Lines (and I have stuck a handy Green Arrow to point at it); and then it goes into a Downtrend Channel which I have marked with the Parallel Red Lines (and Red Arrow); and then we get the current Phase which is a Sideways Range which I have marked with the Blue Lines and Blue Arrow. Note: This kind of Chart Pattern is followed by nearly every Stock - if you want more Returns and less Risk then don’t buy in the Downtrend bit and when it breaks up out of the Sideways Range, buy loads more.
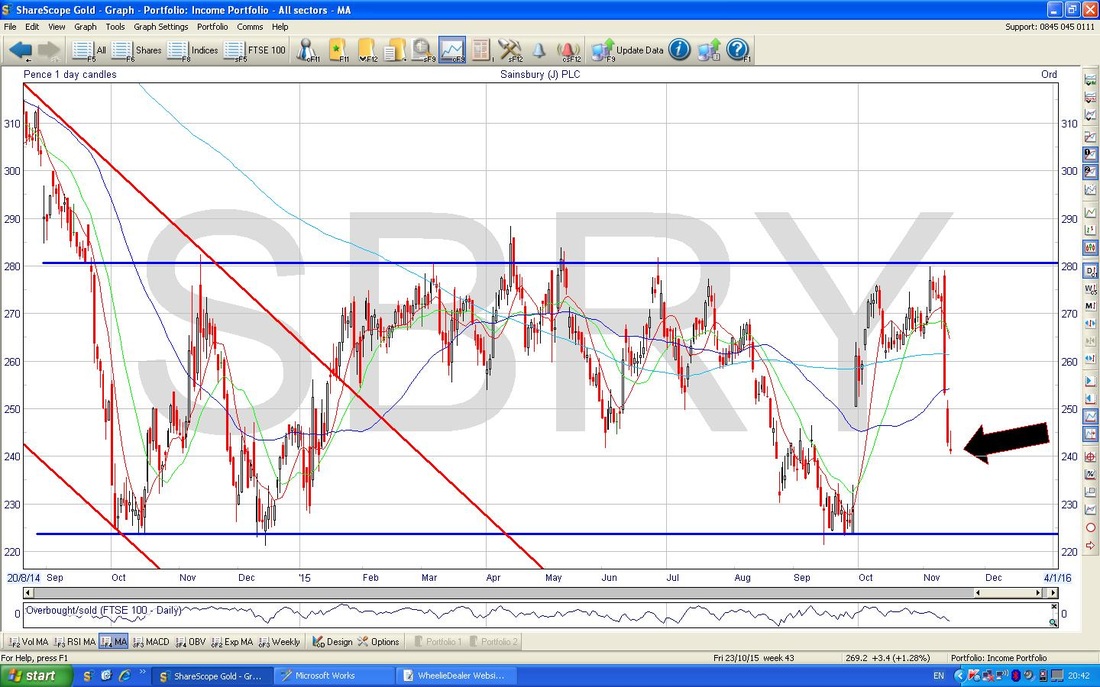
On the Screen below I have zoomed in to the last year or so. This shows the Sideways Range and my Black Arrow points to where the Price is now - and you should see it is pretty near the Lows at 225p ish. I am a bit ahead of where I would ideally buy, but it was forced on me by the Paris Attacks.
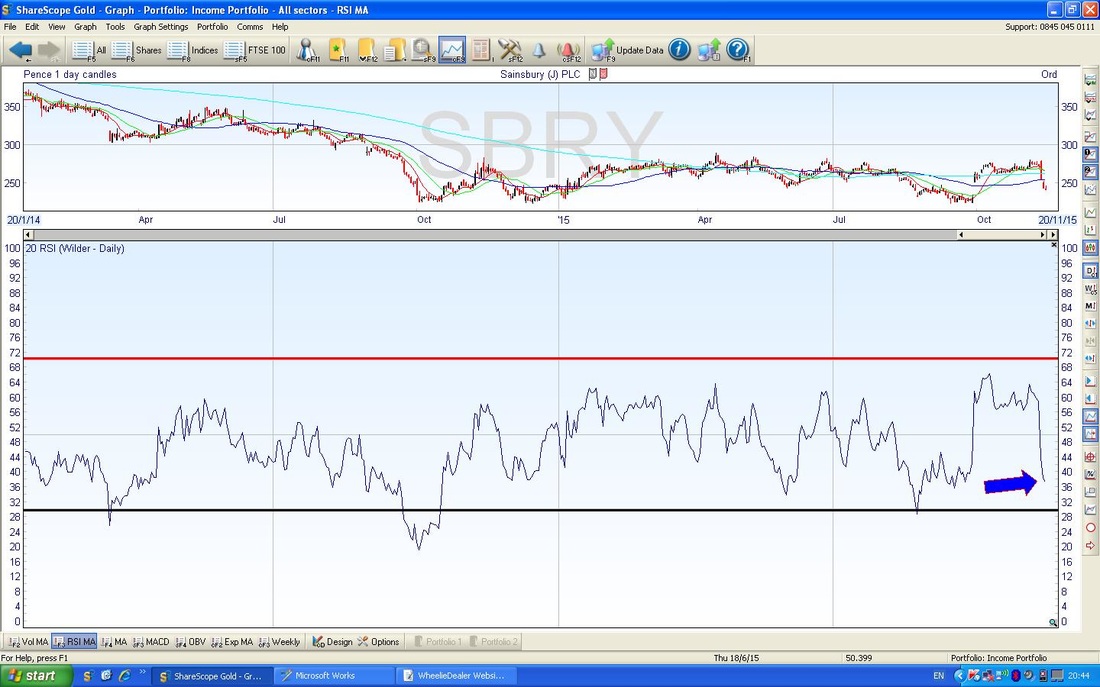
If you look in the Bottom Window on the Chart below, you should see the Relative Strength Index (RSI) and my Blue Arrow points to where it was when I made my Buy Decision with a Low Reading around RSI 38. If you look to the left, you can probably see that the Low RSI readings correspond with the Lows on the Price Chart up above.
Right, that’s the spiel on SBRY, WD
0 Comments
Leave a Reply. |
'Educational' WheelieBlogsWelcome to my Educational Blog Page - I have another 'Stocks & Markets' Blog Page which you can access via a Button on the top of the Homepage. Archives
May 2024
Categories
All
Please see the Full Range of Book Ideas in Wheelie's Bookshop.
|


