

|
educational blogs |
|
THIS IS NOT A TIP OR RECOMMENDATION. I AM NOT A TIPSTER. PLEASE DO YOUR OWN RESEARCH. PLEASE READ THE DISCLAIMER ON THE HOME PAGE OF MY WEBSITES.
This morning I sold about 2/3 of my RCDO position (held via Spreadbets only) and this is a very quick summary of why I made this decision last night after the markets had closed. I think RCDO is a World-Class business and of the utmost quality - however, it has just run up quite a bit and I am nervous on the Markets in general and happy to bank some profits and reduce Risk. As I only hold this as a Leveraged Position, I am running a Higher Risk on it than if I had normal Shares.
The first factor that triggered my Decision is valuation. If you look at the ShareScope screenshot below, you can see that the Forecast EPS (Earnings Per Share) for Next Year (2016) is 48.02p. At my Selling Price of 856.8p that gives a Fwd P/E of 17.8. Strip out the Cash of around £12m and this would fall to around 17 ish I guess. This is not all that high and this is part of the reason that I have held on to a third of my Position - I would be very happy if the Price can fall quite a bit and give me the chance to Buy in again. As I said above, this is a Class Act and I think in time it may even attract a Takeover Bid.
Please note all the screenshots are taken from the Closing Position last night (Monday 11th May 2015) when I made my Decision to Topchop. Sorry to repeat myself, but I always like to make Decisions outside of Market Hours when I am Calm, Rational and Objective. I have not rushed into this Decision and have been thinking of TopChopping it for a few weeks. 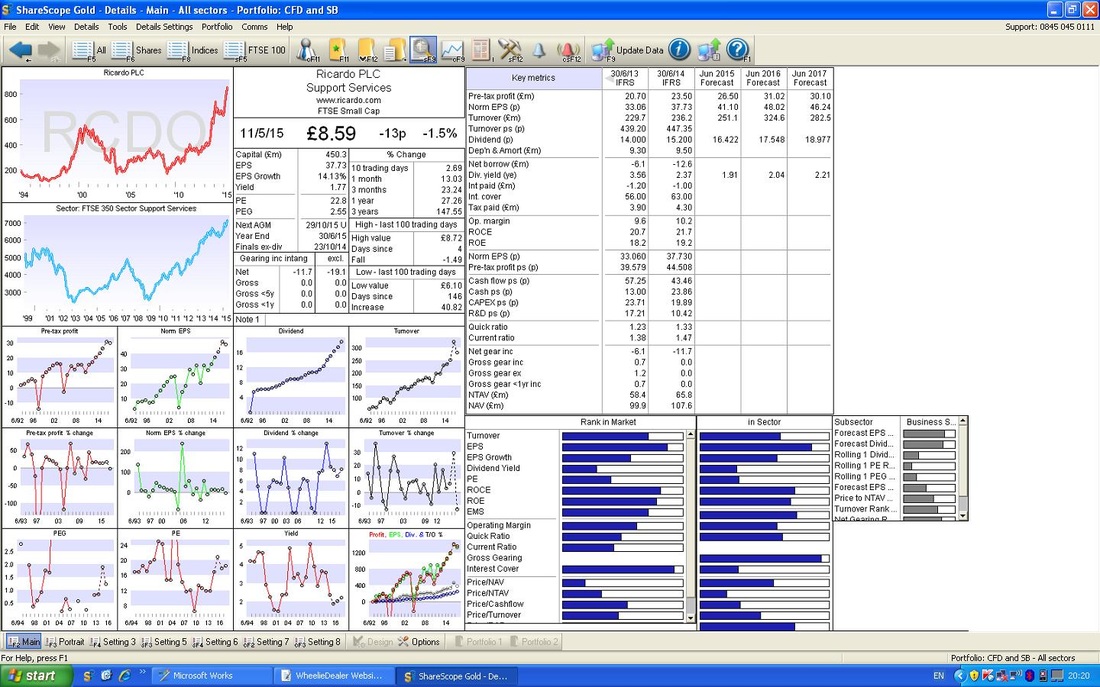
If you look at the screenshot below, you should see quite a long timeframe - about 5 years ish. Note how I have drawn in some Parallel Lines to get a feel for how the Chart tends to move within Channels - and as you can see where the Blue Arrow points, the Price is looking like it is at the Top of the Upper Channel. The Blue Wiggly Line is the Sector line - you can ignore this if you fancy.
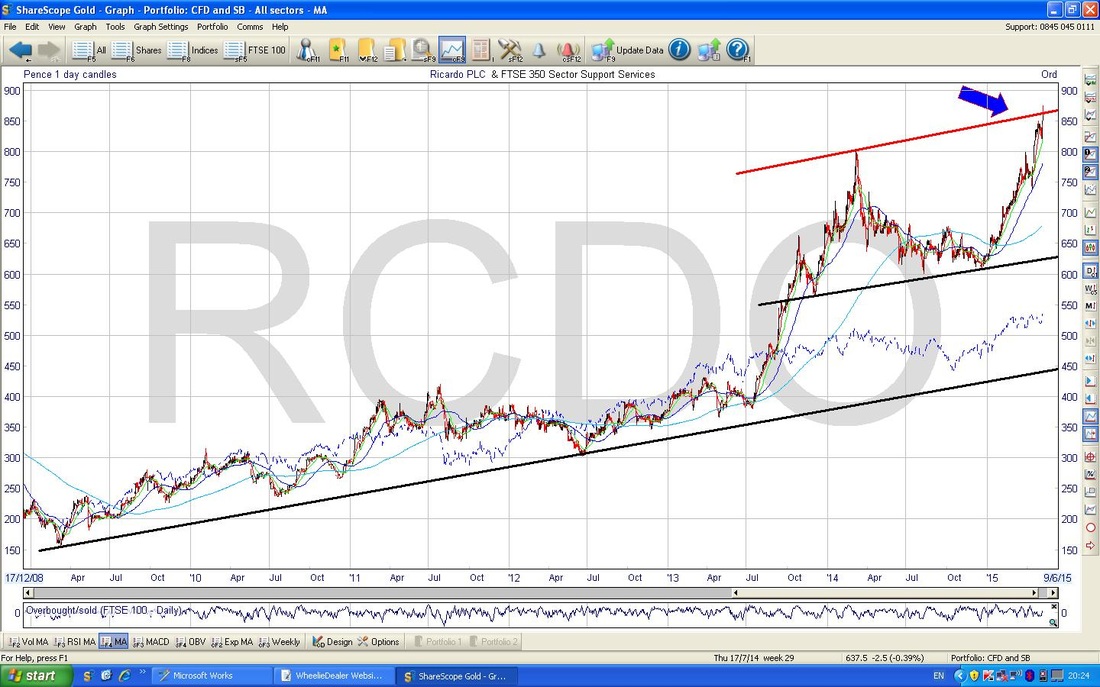
On the Screenshot below, please note in the Upper Window where I have marked with Black Arrows that the Price has moved a long way up from the Blue 200 Day Moving Average Line - there tends to be a lot of ‘Mean Reversion’ in Stock Prices where the Price moves back to its Averages - in this case it looks very stretched away from its Long Term Moving Average.
In the Bottom Window, you should see the RSI (Relative Strength Index). The General Rule here is that you buy a Stock when the RSI is down around 30 and you sell when it is up around 70 - as you can probably gather, it is a Short Term Timing Indicator but it works very well. In this case, where I have marked it with a Red Arrow, the RSI is dropping down from 70 - this suggests that the Price will fall further in the Short Term. 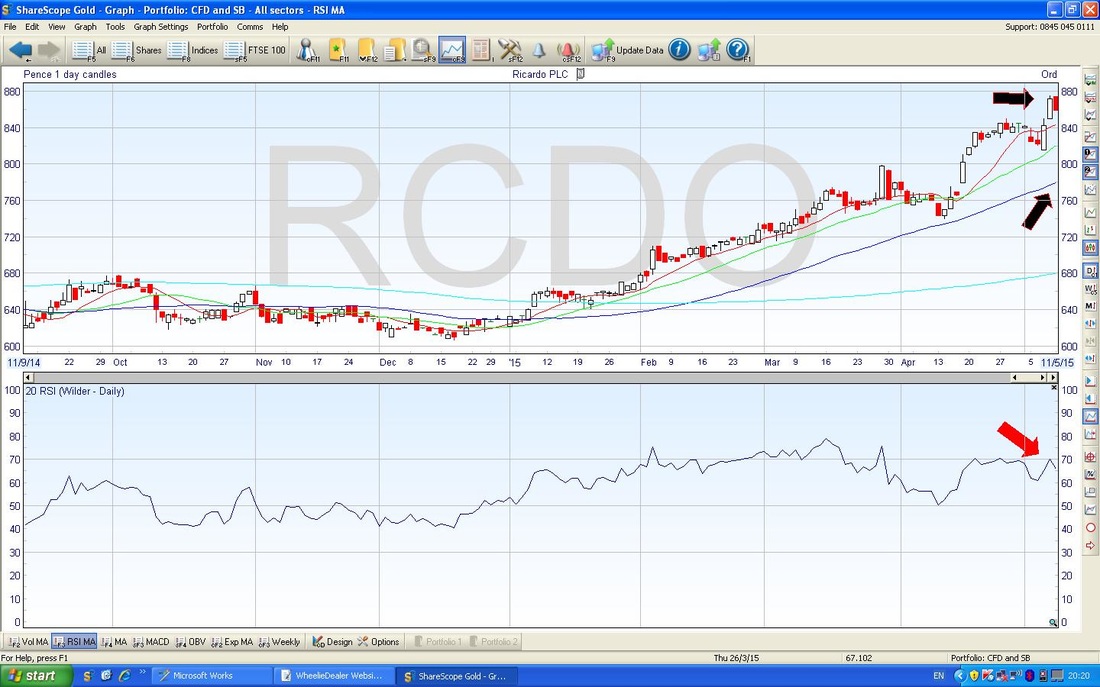
On the Chart below, please look at the Upper Window where you should see the Bollinger Bands - the Blue lines around the Price Line. In this case, my Black Arrow points out where the Price is up near the Top line and probably not far off moving downwards.
The Blue Arrow in the Bottom Window points to where the MACD (Moving Average Convergence Divergence) Continuous Blue Line has sort of ‘bounced off’ the Dotted Blue Line - this is interesting because the usual rule here is that the Price is likely to go higher - so this is contrary to my Sell Decision. As with all things in Technical Analysis, it is imperfect and you have to make decisions based on several Indicators and you have to decide which to overlook. However, by only Topslicing and keeping some Exposure, I am still in the game if it does go higher. 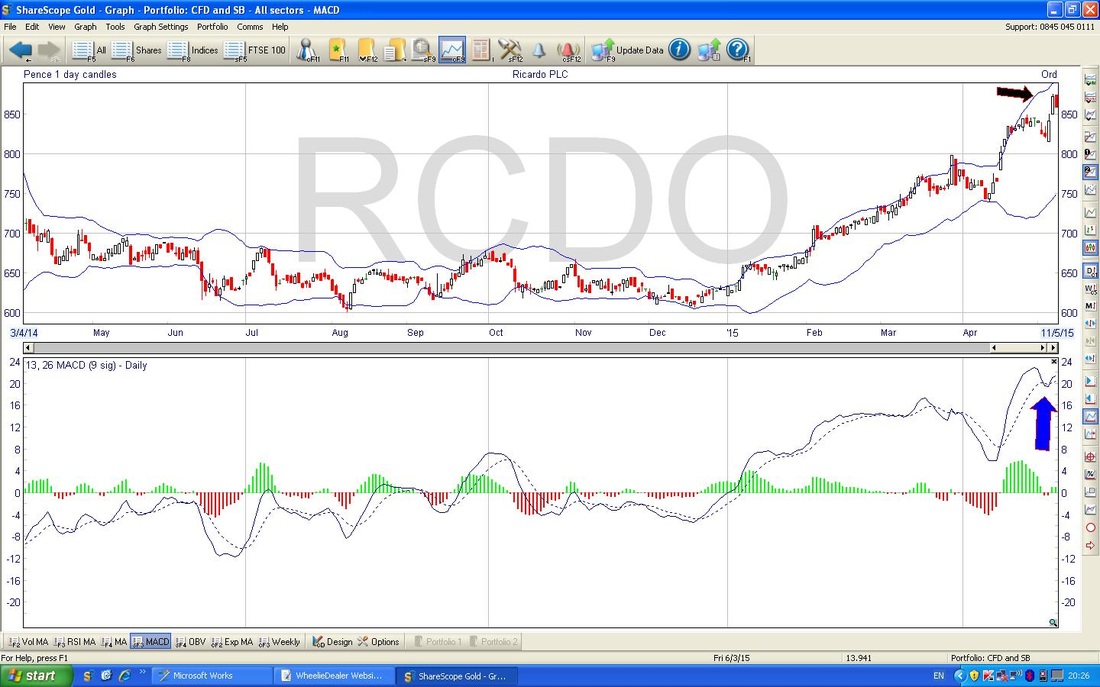
The Black Line in the screenshot below is the 305 Day Moving Average (roughly 10 Months). My Blue Arrows are pointing out how the Price has got very extended up above this Moving Average - note a similar occurrence a while ago which I have marked with the Red Arrows - it is clearly getting stretched.
Right, that’s enough. Laters, wd 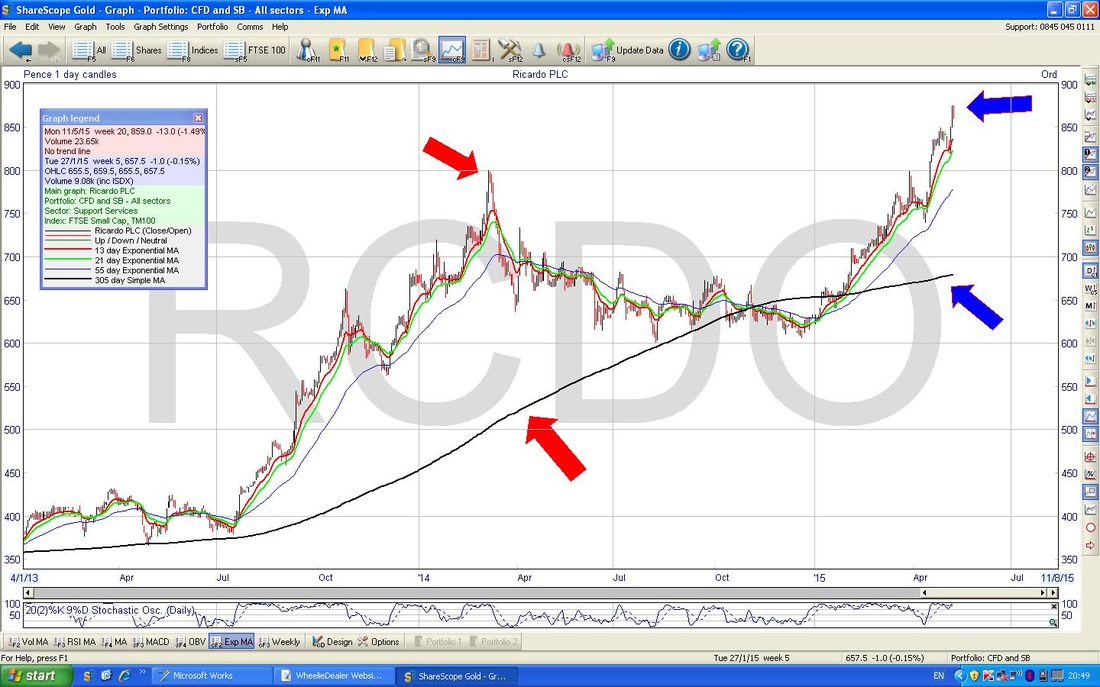
2 Comments
LLG
13/5/2015 07:19:46 am
I'll get a cold towel and read this in the cool of the evening with a strong coffee. It looks v interesting
WheelieD
13/5/2015 04:29:07 pm
Hi LLG, you really made me giggle with that one - hope you're managing to stay cool even after reading it !! Leave a Reply. |
'Educational' WheelieBlogsWelcome to my Educational Blog Page - I have another 'Stocks & Markets' Blog Page which you can access via a Button on the top of the Homepage. Archives
May 2024
Categories
All
Please see the Full Range of Book Ideas in Wheelie's Bookshop.
|
