|
We’ve had rather a change in the Weather this Weekend and it has been a bit frustrating for me because I am in the final stages of sorting out the Paintwork on my BMW Z3 but with really strong winds yesterday and rain today there was just no way I could get the final bit of preparation done and the spraying on of the Lacquer Topcoat which then just needs leaving for 2 Weeks before I can finish the job off.
At least I have been able to finish the Front Bumper though and if you see my Tweets you might have spotted my handywork. I am very pleased because I felt that my work on the Bumper had gone OK but the most recent stage was to spray the Lacquer on and I wasn’t too happy with it because it seemed ‘dusty’ or ‘rough’ (bit like Sandpaper really) and I think this might be because the Weather was too hot when I sprayed it on. Anyway, the problem was that I couldn’t know if this was a problem or not until 2 Weeks had gone by which gives the Lacquer time to ‘cure’ and then I could attack it with T-Cut which is described as a ‘Rubbling Compound’ and I like to see it as a sort of extremely fine Wet n’ Dry Paper that comes in a liquid form a bit like a Polish. It is really gentle especially in the ‘Metallic Paint’ form I need to use and it takes ages but with loads and loads of elbow grease I finally managed to get a shine into the Paintwork and it looks really good. It is amazing how good the T-Cut is because when you run your fingers over it now it is super smooth, unlike the ‘Dusty’ feel it had before. I suspect the finish was not a problem it just meant that I needed to do more Polishing work with the T-Cut to make it decent - as always if I was to wait for the perfect Weather conditions then I would never get the job done.
I’m really happy because now I know for sure that I am doing things the right way and that the remaining 4 bits on the Car that I am working on should turn out pretty good - although where the Dent was above the Boot Lid is probably not as good as I would like because doing the Filler and stuff was very difficult (it is hard for me to reach it and of course Sanding down something you cannot reach very easily is not gonna work all that well !!). Once those bits are done there is one large area behind the Passenger Door that I could attack - it is not crucial because it is not likely to Rust or anything but it looks rubbish and I know that I could tart it up a lot. I will see how the weather is and how I feel with regards to whether or not I will make a start on that bit.
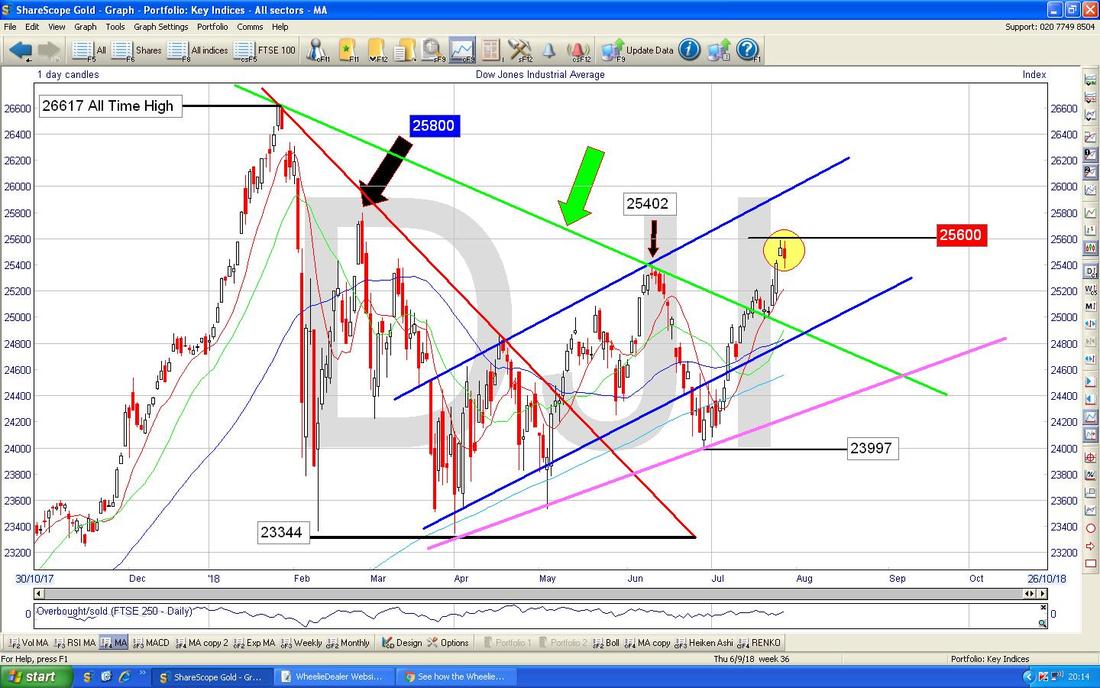
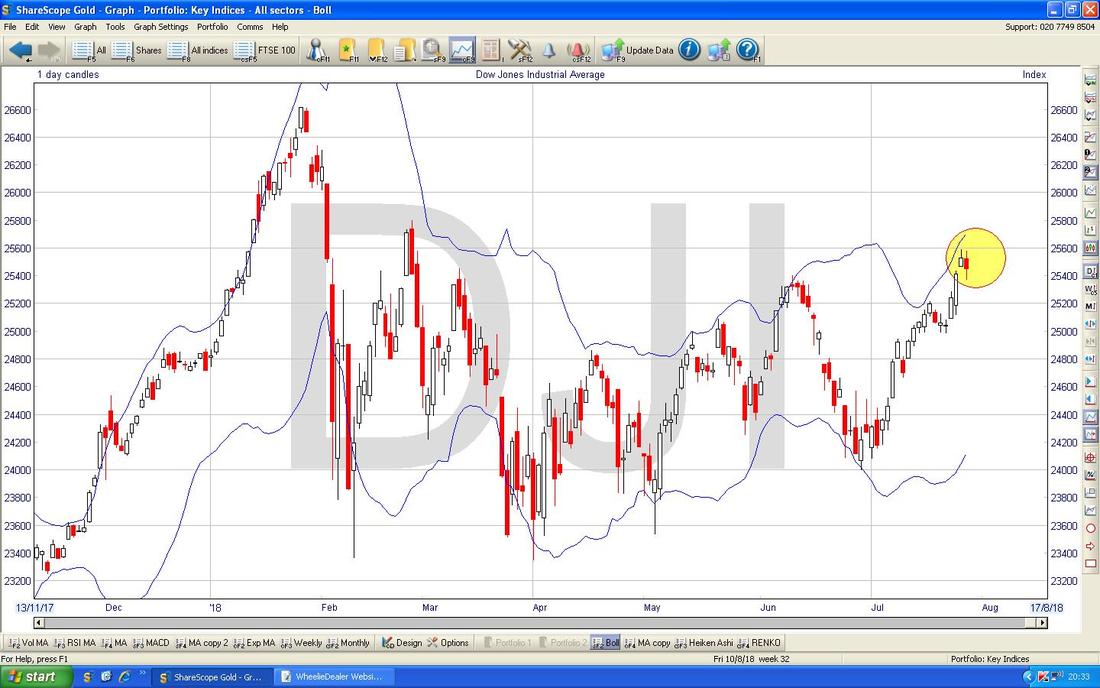
Last Week The continual grind of recent Weeks continued for me Last Week and my Portfolio overall took a hit of 0.5%. It doesn’t sound much but with the constant drip, drip, drip of Losses in recent Weeks it means that my Portfolio is barely in positive territory and it is only the Overseas Unit Trusts (mainly US Tech and Health) that are saving the day. I haven’t checked my Income Portfolio for a couple of Weeks and my hunch is that it is pretty much the same as it was and doing pretty well - but sadly that is only a small bit of my Overall Stockmarket stuff and doesn’t really move the dial much (I do not include the Income Portfolio in the figures I put out on Twitter or in the 0.5% hit I mentioned a few seconds ago). To help understand my Numbers, check out this old Blog: http://wheeliedealer.weebly.com/blog/reporting-end-of-day-numbers-and-the-advfn-app Later in the coming Week I think we have the possibility of a Bank of England Rate Rise and the talk is of Quarter of 1 Percent. I find this strange really because with the Brexit Fiasco and a sluggish Economy and little sign of Inflation, it seems unnecessary. I think the logic is that it would be a step towards ‘Normalising’ Rates but with the potential disaster of a Messy Brexit looming, it strikes me as unwise. We shall see of course, but I guess it is not that much of a hike and it probably wouldn’t make a lot of difference. On Friday we have the US Non-Farm Payroll Numbers again - these usually come out at 1.30pm UK Time and the expectations are around 200k Jobs being created. This tends to cause some big fast swings around the Release of the Numbers but in the Bigger Picture I am not sure how big a deal it is. The US Economy is clearly growing strongly and the Jobs Number will probably be pretty good. I covered August in last Weekend’s Blog I think but in essence it said that a Typical August is pretty average and run of the mill (it is the 7th Best Month) and usually the first Weeks are poor but then it recovers. My Strategy is staying the same - I am not doing much at all and if anything my bias is towards Selling and building my Cash. I am happy with most of the Positions I hold and in no rush to Sell out entirely of stuff but I will be taking opportunities to TopSlice if they arise. In an ideal world I would get some Takeover Bids and that would trigger the Selling for me !! With the potential for screw-ups around Brexit and the chances of a difficult Autumn for the Markets very high, I cannot see myself changing this ‘Do Nothing’ Strategy for some time and it might be the default stance right through to March 2019 when we are due to escape the tyranny of the EU (although of course if the UK’s Exit is anything like the T May Chequers Plan then we won’t be properly leaving at all). I am keeping my eyes wide open for New Stocks to invest in but am in no rush to do any Buying. Perhaps if I can shift a couple of Positions in coming Months so I have spare ‘Slots’ then I might be tempted to buy something new but only in Small Size - we shall see and it would need to be a Very Special Stock to make it worth the effort/risk. Of course I will be alert for Opportunities to Short the Indexes if need be as a bit of a Hedge. WheelieBash I just wanted to throw in a Reminder about the WheelieBash which will be taking place on Saturday 15th September 2018 just outside Windsor. It is an informal chance to meet up with loads of other Investors and Traders and in recent Years the response and the feedback from the Events has been superb - there is no pressure or anything and it is just a chance to meet up with loads of the People you probably see on Twitter and suchlike. It is Free to attend and you can come and go as you please. There are more details on the Homepage and I have yet to confirm the Venue but it will most likely be The White Hart Pub at Winkfield which is where we did it last Year. I expect to confirm that in a few Weeks as I am due to go there and I want to make sure the Landlord is able to accommodate us - if he is unable to, I have another Pub just down the road lined up. If you want to join us then please contact me so I can add your name to the List - it is just to keep track of the numbers because we can probably do about 60 at most. Blog Slate This Week I put out the final Part of the Series which in effect was a Review of Robbie Burns’ (The Naked Trader) Book ‘Trade like a Shark’ - this contains loads of excerpts from the Text and is well worth a read. This coming Week I intend to issue the first of the Guest Blog Series on Short Term Trading and I think Readers are gonna really enjoy this - even if you are more Long Term in your focus. Last Night I finished off a Blog about different Investing Styles such as Momentum, Value and Defensives etc. and this adds to several other ones I have in very good shape so I am very confident that I can keep the Blog Flow going over the Weeks ahead, whilst at the same time having a very lazy Summer and also managing to sort my Car out !! Time Travelling…….. From the huge Blog Archive (if you go to the ‘Useful Links’ page then the ‘Blog Index List’ lives here and you can see all the Blogs that have ever been produced and this is becoming a very big Source of useful info if you are new to the whole WD thing or perhaps if you have a particular Subject you wish to learn more about), I have chosen the following one for this Week’s look at Blogs from the past: http://wheeliedealer.weebly.com/blog/how-many-stocks-should-an-investor-hold-are-you-drowning-in-stocks-or-is-there-a-drought-in-your-portfolio I am amazed this one dates back to June 2015 - that is 3 Years back and it really doesn’t seem like that long ago that I wrote it. Even more shockingly it will soon be 4 Years that I have been doing the WheelieDealer Website etc. - that is nuts. Mind you, talking of how time whizzes past, I actually hit a significant Milestone earlier this Week when I realised it has now been 20 Years since I had a rather Life-Altering Crash on a Honda VFR750F which wasn’t too keen on going around Roundabouts and preferred to try jumping them !! Shame by Back Vertebrae didn’t agree with the approach…… Right, let’s get Charting……. DOW Jones Industrials The Chart below is similar to what I have shown in recent Weeks but I have cleaned it up a bit before then ‘soiling’ it again with loads more Text Boxes and Arrows etc. !! As always the Charts are from the superb ShareScope Software that I use and of course you can customise it to show the same Charts set-ups that I have. If you use SharePad then you can do the same and most Charting Packages (even the Free ones on Websites) should be able to show you the same stuff I have on mine. If you click on the Charts they should get bigger so you can see more detail. On the Chart below it is still an important factor that the DOW Price Candles managed to Breakout of the Green Downtrend Line marked by my Green Arrow. If you look at my Yellow Circle which is capturing the 2 Daily Candlesticks from Thursday and Friday then it is clear that there is Resistance at 25600 which I have put in the Red Text Box and a move above this Level would be very Bullish but then we come up against more Resistance at 25800 which I have shown somewhere else on the Chart in the Blue Text Box. It is probably hard to see it on this Scale but the Candle from Thursday was a bit of an Inverted Hammer which could mark a Turning Point from which the DOW falls - such a fall started on Thursday but during the Day the Price recovered a bit and found Support at 25370 - if that Level fails, then expect more downside short term. There is good Support below though so I doubt we are in serious trouble yet - overall this is still a very Bullish Chart with the 50 Day and 200 Day Moving Averages rising nicely (these are the Dark Blue and Light Blue Wiggly Lines).
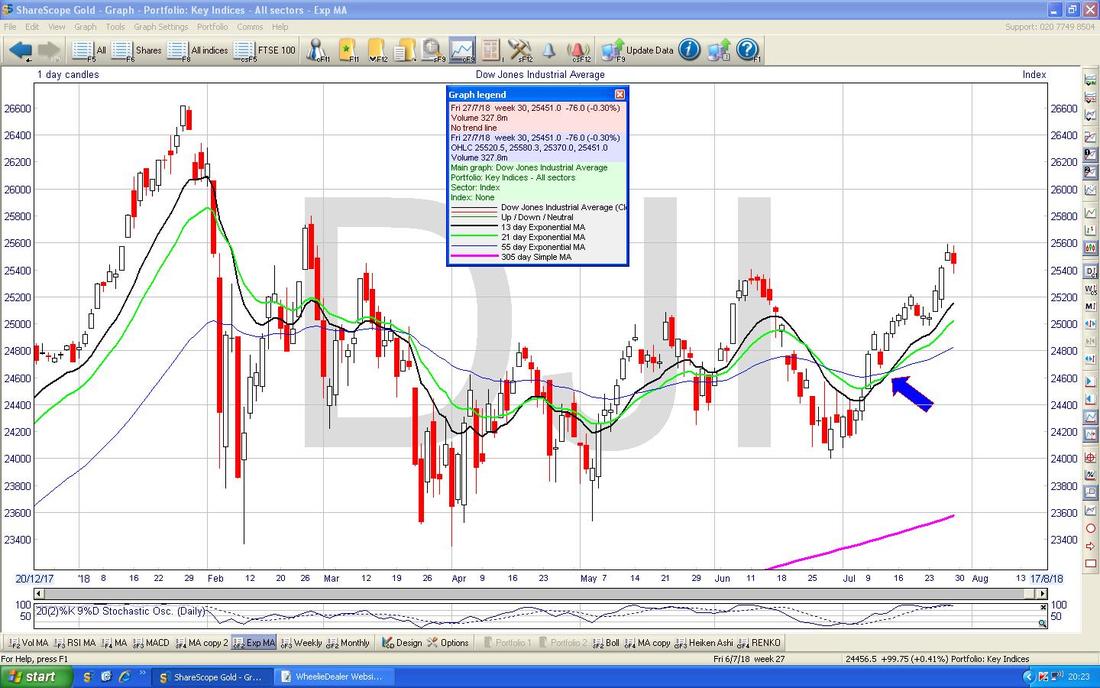
Readers who often read my Blogs (see how I avoided the use of ‘Regular’ there and avoided the need for the All Bran quip?), will know that I adore the 13/21 Day Exponential Moving Average Crosses and the Chart below where the Blue Arrow is shows just such a ‘Golden Cross’ which is still ‘in force’ as we have not had the opposite ‘Death Cross’ yet and there is no sign of it at this point in time.
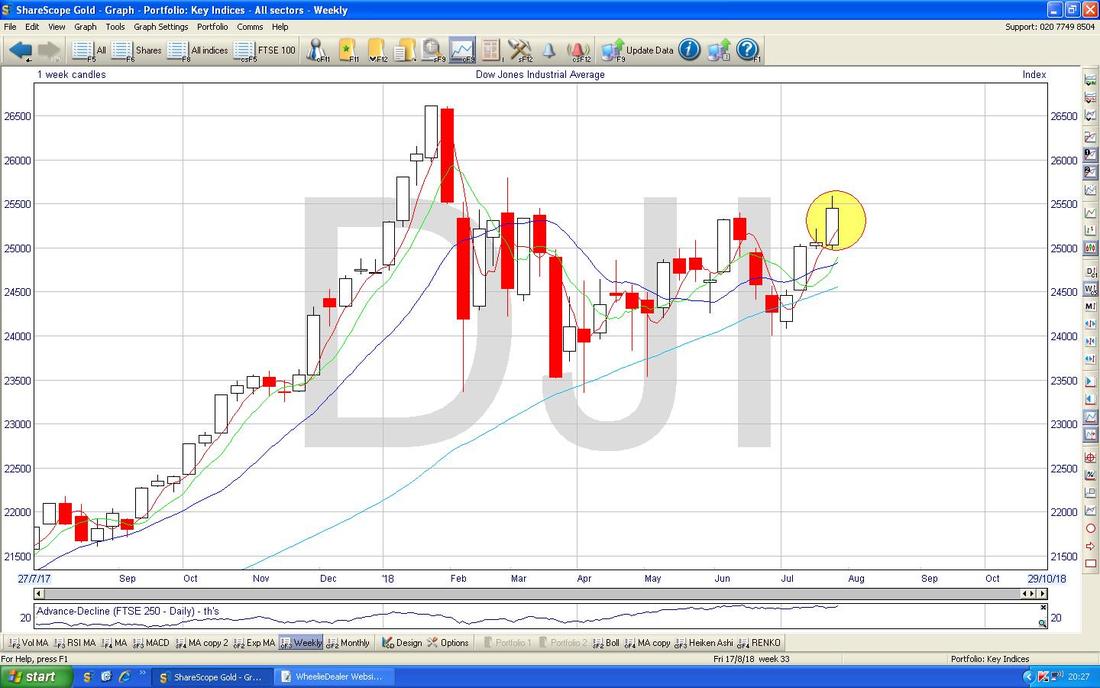
Next we have the Weekly Candles for the DOW. My Yellow Circle is showing a Big White Up Candle and this is obviously Bullish. Note it does have a bit of a small Wick at the Top which perhaps is hinting that the force of the move up is weakening.
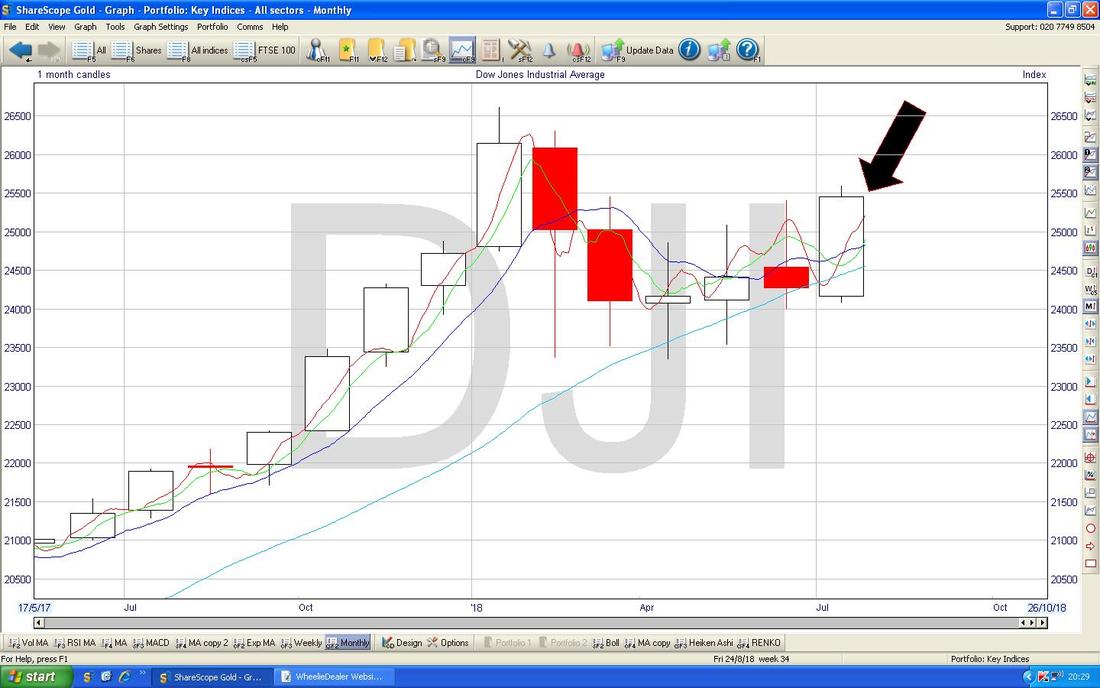
Next we have something to watch over the next 2 Days. This is the Monthly Candles and the one I am pointing at with the Black Arrow is what is forming up for July but note this is not yet valid because we have 2 Days left of July. However, barring a sudden Market Collapse (oh god, what have I just said !!!), it looks like we will get a Big White Up Candle for July and this is Bullish.
Remember, an important concept with Charts is that Longer Timescale things dominate over Shorter Timescale things, so Monthly Candles dominate over Daily Candles and the Monthly one is more important.
Now we have the Daily Candles with the Blue Wiggly Bollinger Bands above and below. Where my Yellow Circle is it could be that the Price is turning down from the Upper Band - that is something to watch early next Week.
Nasdaq Composite Index (US Tech)
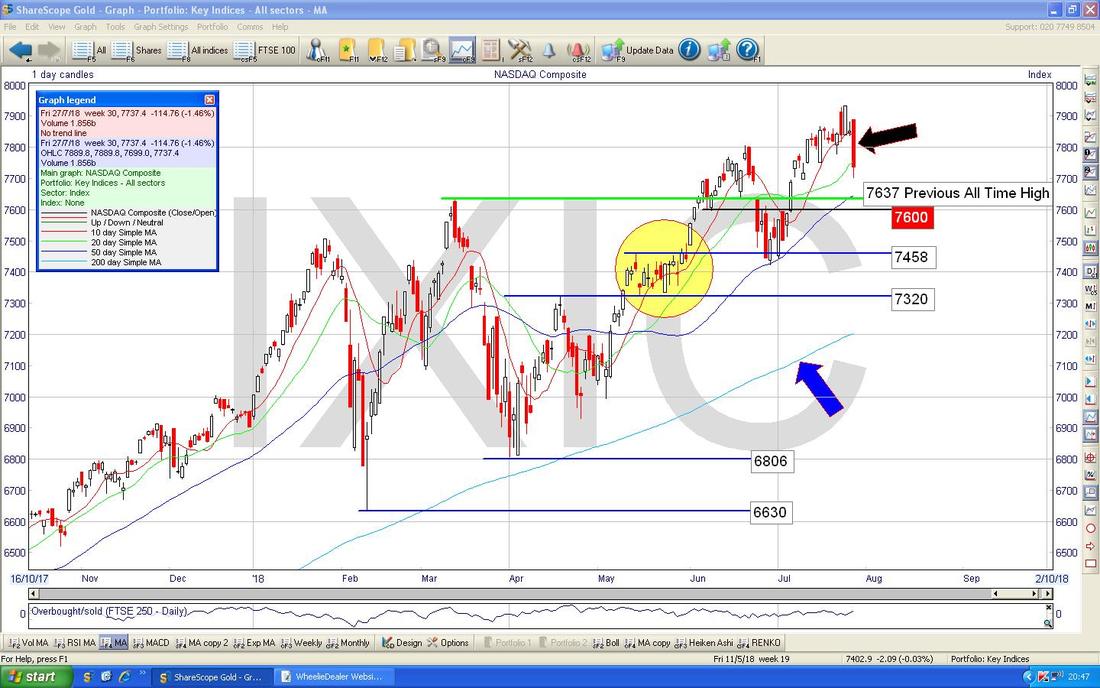
This one took quite a hit on Friday and of course the ‘Usual Suspects’ are talking about “The End of Tech and FANGS” and all that drivel, so let’s see what the Charts are telling us. Below we have the Daily Candles and after just hitting a New All Time High this is clearly a Bullish Chart in the Big Picture. This is supported by the 200 Day Moving Average which I have pointed at with my Blue Arrow and this shows a Long Term Bullish Uptrend. My Black Arrow is pointing to the Big Red Down Candle from Friday and this obviously looks negative but note that it Closed slightly up off the Lows of the Day. If we do get more falls, then there is good Support at the Previous All Time High which is the Green Line at 7637 and then much below this where my Yellow Circle is there is a lot of Support in a Zone. It is worth remembering as well how Bullish Tech has been of late - any pullbacks have been pretty quickly bought so the idea that this is the End of the Bull Run for US Tech is probably not correct.
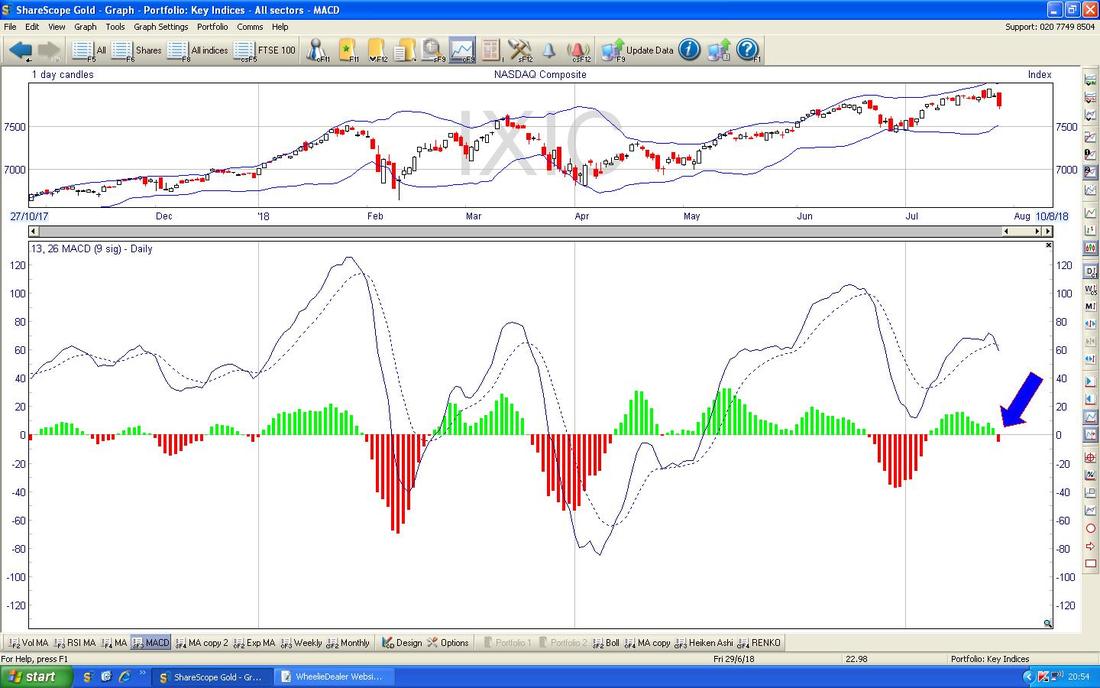
In the bottom window on the Screen below we have the MACD (Moving Average Convergence Divergence) for the Nasdaq Comp Daily and where my Blue Arrow is we are being ‘treated’ to a Bearish MACD Cross on the ‘Histogram Bars’ format. The same thing can be seen in the ‘Signal Lines’ format above.
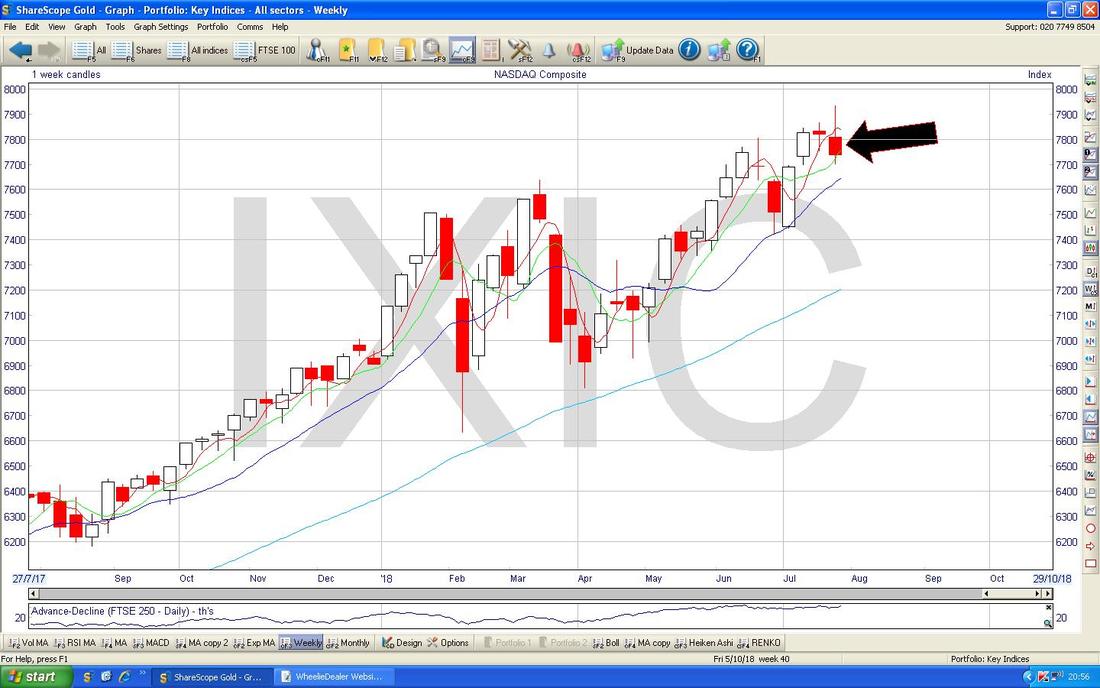
On the Weekly Candles for the Nasdaq Comp we have a pretty Bearish looking ‘Inverted Hammer’ where my Black Arrow is. This suggests more downside but of course it could easily be just a Pullback before we resume the Long Term Uptrend.
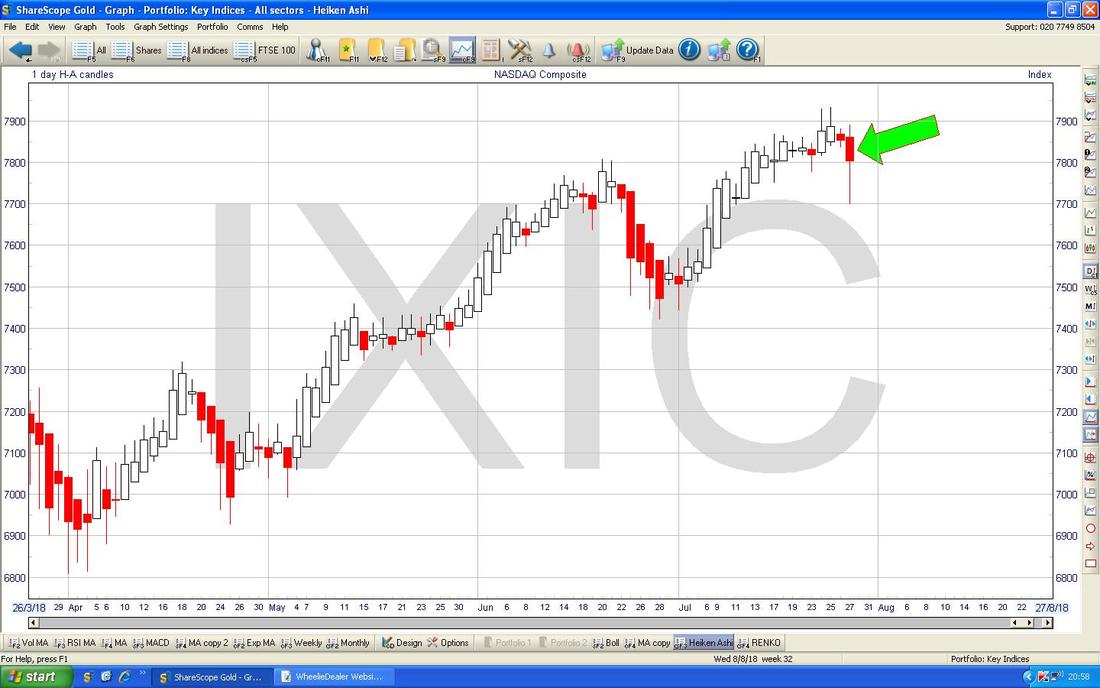
Next on the Daily Heiken Ashi Candles things look pretty Bearish. My Green Arrow is pointing to a Big Red Down Candle and the way these HA things work (they are utterly different to ‘normal’ Candles), this suggests more Falls to come.
I won’t show the S&P500 for time reasons. As usual, it is really a mix of the DOW and the Nasdaq and at the moment it looks likely to turn down a bit but it is not looking like panic stations !! The Nasdaq looks by far the worst of these Charts but only from a Short Term Pullback sort of occurrence.
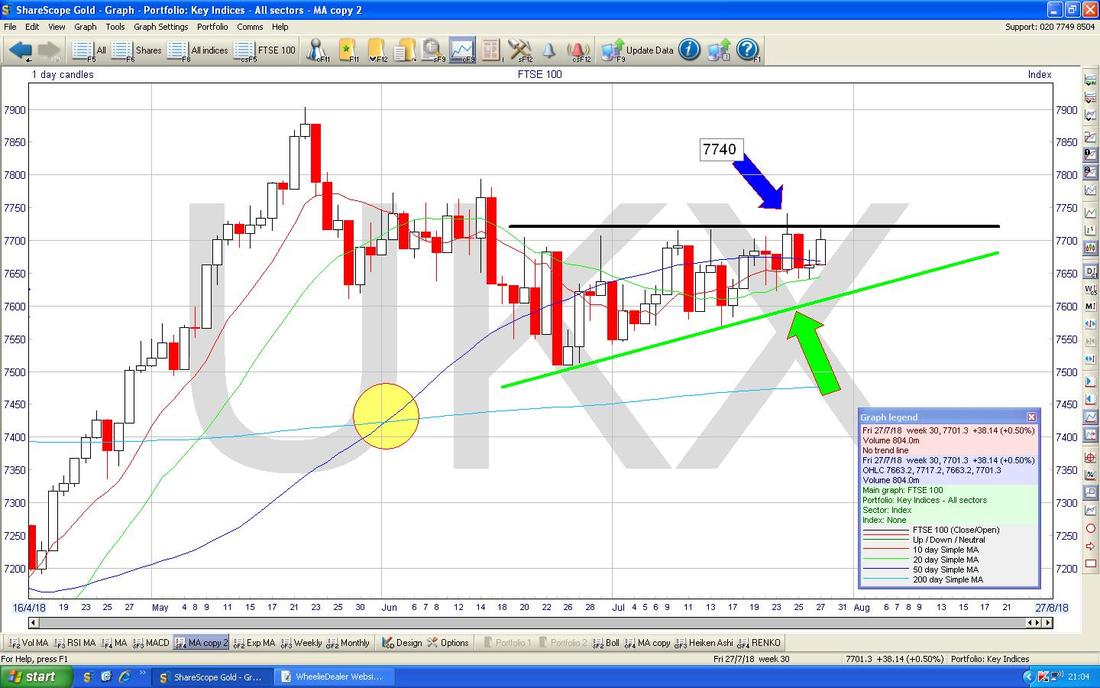
FTSE100 Regular Readers (No !!!!!! The All Bran !!!! Arghhhhhhh !!!!) will probably recognise this Chart as it is well worn now and looking a bit tatty….. We are still within my infamous Triangle between the Green and Black Lines below. The FTSE100 made an attempt to escape about 4 Days ago but couldn’t manage it by the Close of the Day but I think this is hinting that a Break Higher will come. The key now is to crack that Black Line and then to get over 7740 - a move over this Level on an End of Day Close basis would be a Buy Signal and suggest we will soon be taking on the All Time High at a shade over 7900. My Yellow Circle is marking a Bullish ‘Golden Cross’ between the 50 and 200 Day Moving Averages - this suggests gains in the Months ahead (hard to believe with Brexit but of course the Charts can be very wrong at times - having said that, a Weak £ from a ballsed up Brexit could boost the FTSE100). A move below the Green Line of the Triangle would be Bad.
There’s not much else to show on the FTSE100 - it is all about that Triangle and which direction it resolves in - if we Breakout to the Upside, then expect more gains. A break to the Downside, implies more falls. Simples.
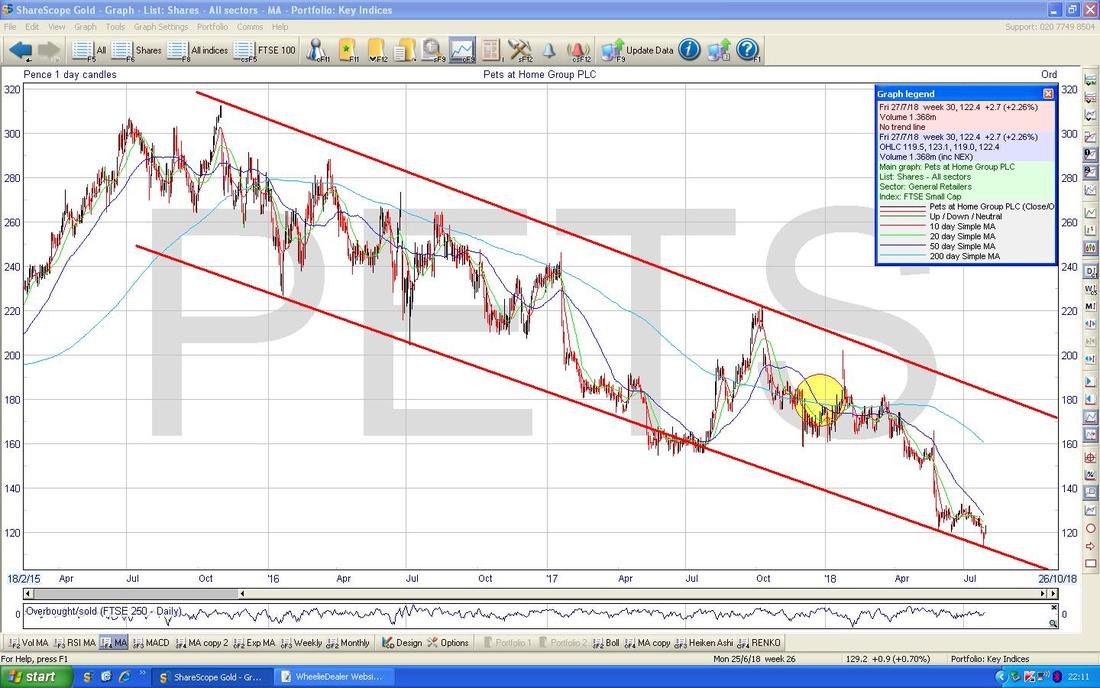
Let’s do some Stocks now. Pets at Home PETS This one has come up a lot on Tweets recently and it is either a superb opportunity as a Value Play or a potential disaster area - hard to know of course. First off we have the Long Term picture for PETS and the clear story here is the Major Downtrend as shown by the sort of Parallel Red Lines on my Chart below which designates the Downtrend Channel. My Yellow Circle is highlighting a Bearish ‘Death Cross’ on the 50 and 200 Day MAs and this clearly predicted further falls as you would expect.
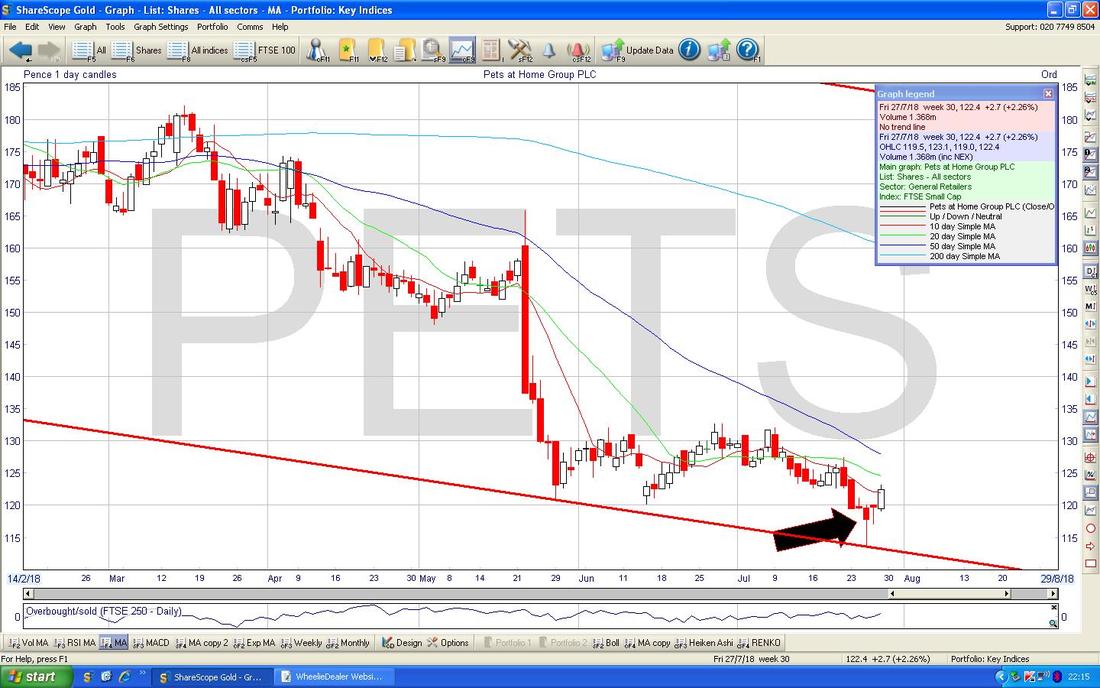
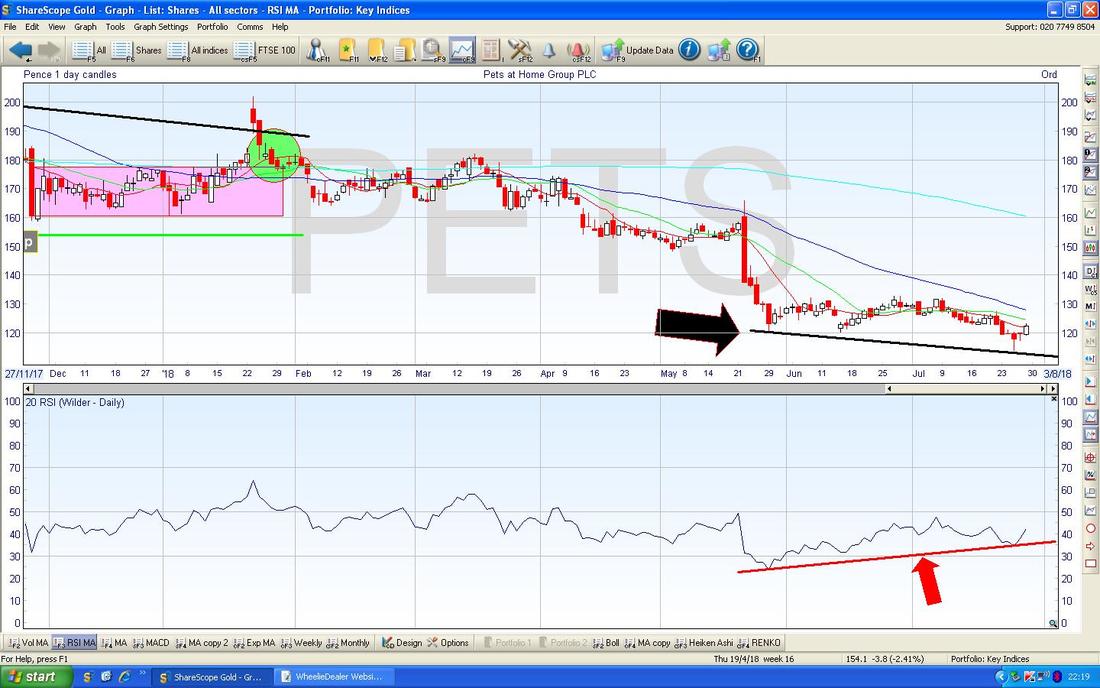
I have now zoomed in a lot to just a few Months and my Black Arrow is marking a Hammer Candle from 3 Days ago and on Friday we got a Big White Up Candle. This suggests we could get a bit of a Rise now but with such a Negative ‘Big Picture’ at best I would expect PETS to just go Sideways really and at the worst we could see more falls.
The Low of the Hammer at 113p ish is now important Support and if this fails, then it is likely we will see 100p tested as a Psychological Support Level.
This next Screen is important for Bulls. What we have here is a ‘Bullish RSI Divergence’ which means that the Red Line (Red Arrow) in the Bottom Window which shows the RSI Readings (Relative Strength Index) is rising whereas the Price Line in the Window above is falling as per my Black Line (Black Arrow).
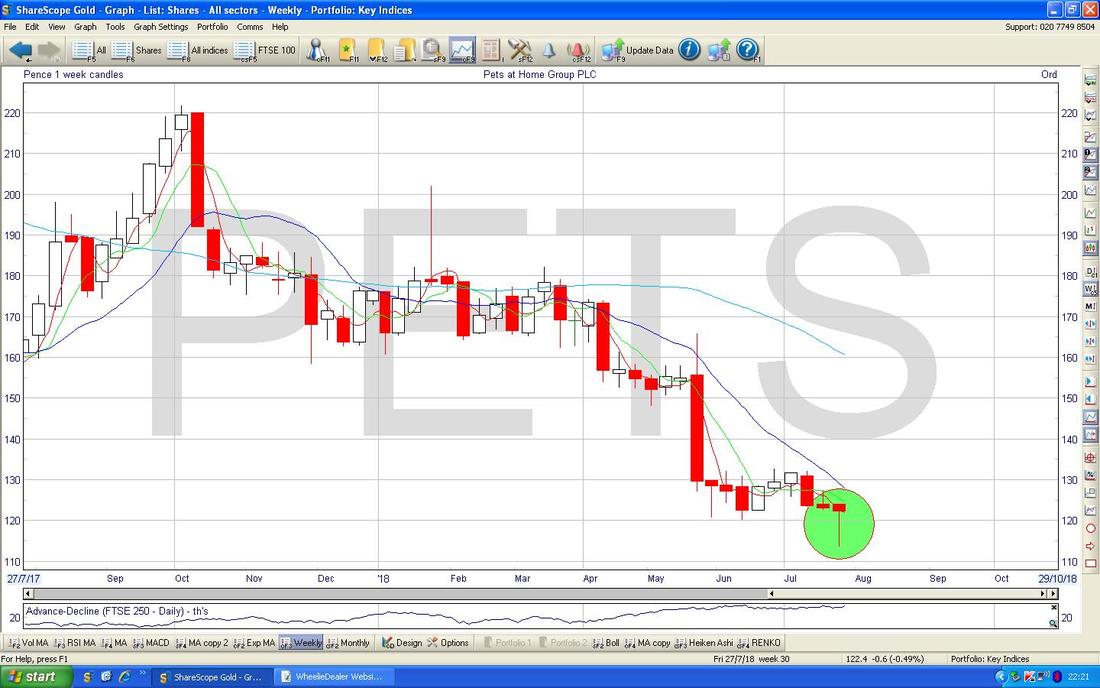
The Chart below has the Weekly Candles for PETS. My Green Circle is highlighting a Hammer Candle and this suggests it might turn up.
St. Ives SIV
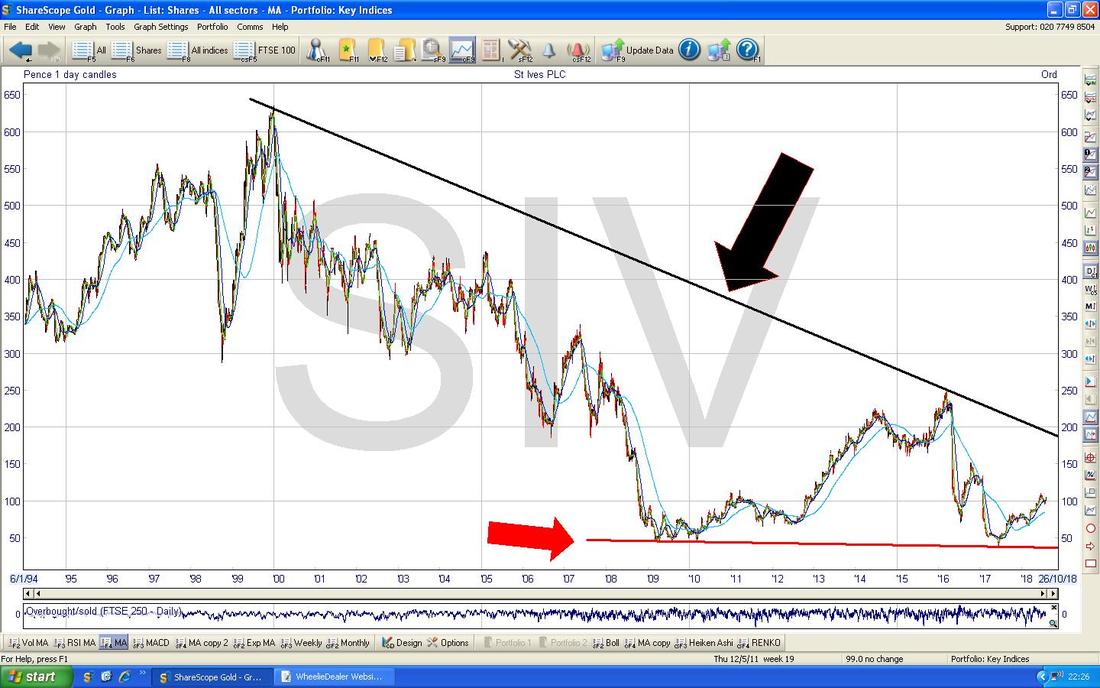
I am showing this one because it strikes me as pretty Cheap and the Chart looks good. It sits on a Forward P/E of about 10 and recently sold off the Legacy Printing Business which was a drag on performance. It has a fair chunk of Debt and that is where the Risk is really. As always we start with the ‘Big Picture’ as that is the way Charts should be interpreted - start Big and drill inwards. My Chart below goes back like forever and my Black Line (Black Arrow) is the Major Downtrend Line which must be got over to really get some big gains and at the Bottom my Red Line (Red Arrow) marks very good Downside Support.
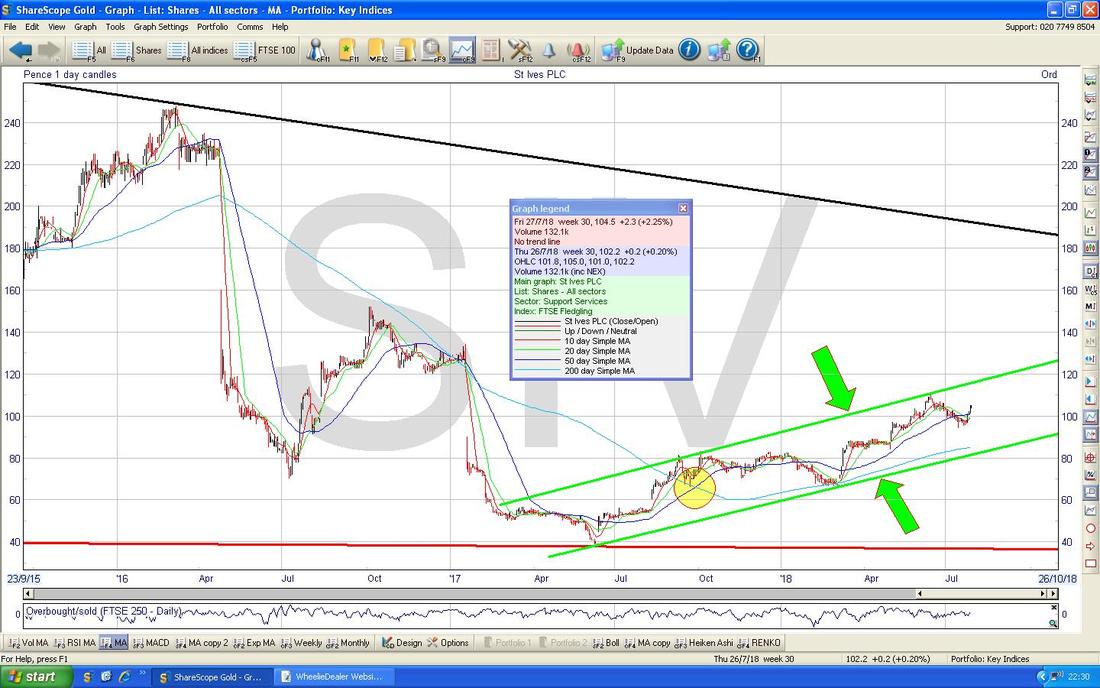
Now I have zoomed in a lot and we have a Clear Uptrend Channel as marked by my Parallel ish Green Lines (Green Arrows). My Yellow Circle is marking a Bullish ‘Golden Cross’ between the 50 and 200 Day Moving Averages - note how this predicted the gains. Makes me laugh when People say Technical Analysis is nonsense……(what they mean is that they don’t understand it and can’t be bothered to learn about it !!).
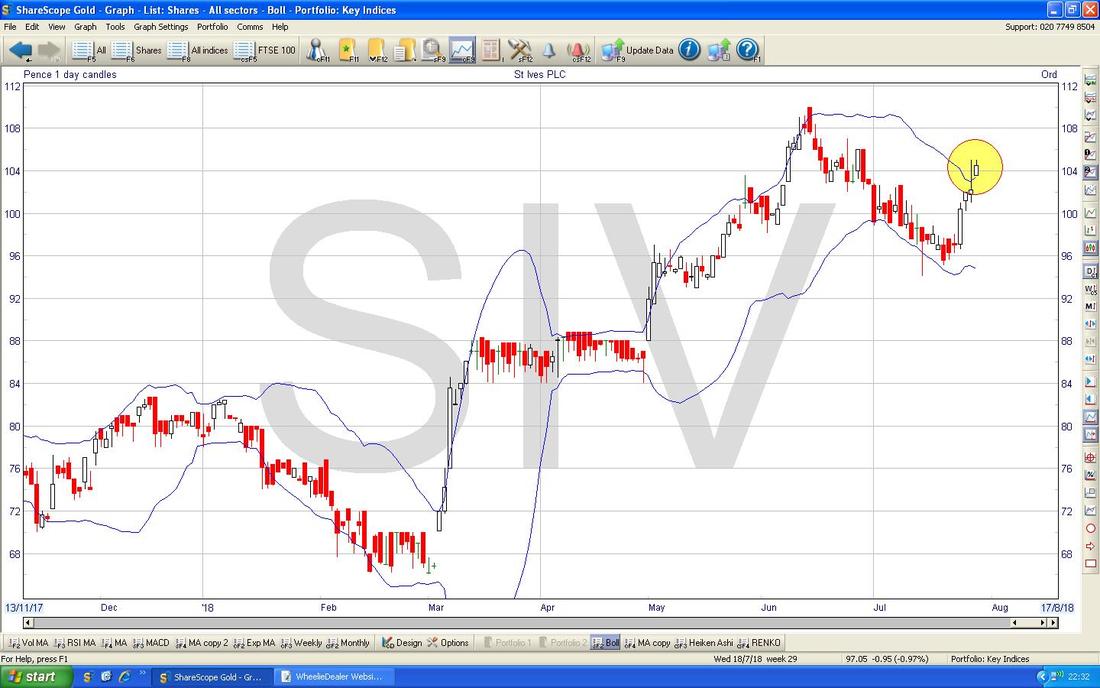
On the Chart below we have the Daily Candles for SIV with the Bollinger Bands above and below. Where my Yellow Circle is we have gone above the Upper BB which suggests we might go Sideways or ease back a bit after the recent push up. However, there should be Results soon so we might see more Upside pretty quick (last year there was a Trading Update on the 10th of August).
OK, I will leave it there. Good Luck in the coming Week and be careful out there (this applies to the Markets, to the Rain and to the Sun later in the Week - for these you will need to keep your Wits about you, have a Brolly to hand and have some Suncream at the ready……) Cheers, WD.
0 Comments
Leave a Reply. |
'Educational' WheelieBlogsWelcome to my Educational Blog Page - I have another 'Stocks & Markets' Blog Page which you can access via a Button on the top of the Homepage. Archives
May 2024
Categories
All
Please see the Full Range of Book Ideas in Wheelie's Bookshop.
|


