|
THIS IS NOT A TIP OR RECOMMENDATION. I AM NOT A TIPSTER. PLEASE DO YOUR OWN RESEARCH. PLEASE READ THE DISCLAIMER ON THE HOME PAGE OF MY WEBSITES.
Back on Thursday 14th May 2015 I added to my existing Holding in Quintain Estates (Epic Code QED) because it still looks good value and is due to produce Final Results on Friday 22nd May. I expect the Shares could rise in the days running up to the Announcement (this often happens) and it is worth noting that the Share Price appears to have Broken Out of a Sideways Range as I will explore in the Technicals bit. All the ScreenShots where taken at the Close of Play on Wednesday 13th May 2015 - so these are the Charts I was looking at when I made my Buy Decision that night. As regular readers will know, I try to make all my Buy and Sell Decisions outside of Market Trading hours as it removes a large element of Intraday Emotion.
Quick Company Overview
Due to time limitations and my eagerness to work on another Blog, I will not go into any great detail here - to be honest, it’s a pretty straightforward Business and Readers can have a dig around in the usual places. QED is in essence a ‘Mixed Use Development’ Property Business which also happens to run a small Asset Management arm and a small Portfolio of London Commercial Property. These 3 bits are as follows:
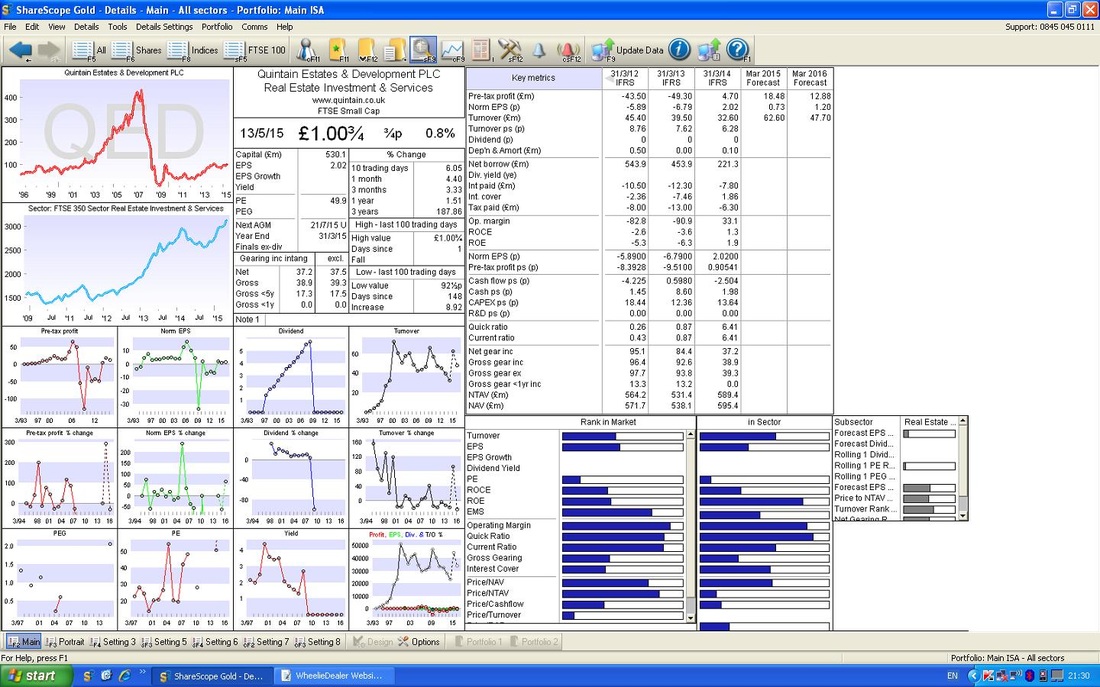
The Company’s website can be viewed at: www.quintain.co.uk Valuation If you look at the ShareScope ‘Details’ screenshot below, at the bottom of the big block of Numbers on the Right Hand Side, you should find a figure for NAV (£m) of 595.4. If you then look at the top sort of in the middle, just below the big number £100.¾, you should see Capital (£m) 530.1.
So, this means that the Company’s Assets are worth £595.4m and the Market Capitalisation on Wednesday Night was £530.1m. So, the Company is valued by the Market at less than its Assets are worth - this is a Discount and it is a good thing !!
So, to work out the Discount, we subtract 530.1 from 595.4 which is 65.3 and we then divide that into 595.4 and express the result as a percentage as follows: 65.3 / 595.4 x 100% = 11%. Therefore, QED Shares are trading at a 11% Discount to their Net Asset Value. For information, Property Companies tend not to be Valued using normal Valuation Metrics like p/e, PEG, Dividend Yield etc. The standard method is to use Discount or Premium to Net Asset Value (NAV). In the case of QED, the Earnings per Share (EPS) is tiny and there is no Dividend Payment. This is not a problem, unless you are more focussed on Income. Target If you look at most London Property companies now, they are trading on Premiums to NAV, although QED is higher Risk because it is primarily a Developer and should be rated lower than something which is really a Rental and Asset Improvement kind of Property Company, like British Land (BLND) or Land Securities (LAND). However, if the Discount was to close to zero, that would be around 10% Upside from my recent Topup Buy Price at 101.5p which would be a Target around 110p. I am informed that Broker Forecasts expect the NAV to rise such that QED is really on a 20% Discount to Forward NAV - this means a Target of around 115p might be possible. However, I am a Long Term Investor, and I expect to hold these Shares for some time and it seems sensible to me that the NAV could rise quite fast as London Property is very hot and Residential Property is especially in demand. Throw in a tightening of the Discount to NAV and I think a sensible Target is 130p in a couple of years. That is 28.5% Upside from my Buy Price of 101.5p so it is a nice Diversifier in my Portfolio and should give a reasonable Return. Of course, there is the outside chance of a Takeover bid. Risks Being a Property Developer there are many Risks to do with Project Management and suchlike, however, there are really 2 big Risks that need consideration and any Investment at this time has to be comfortable with these:
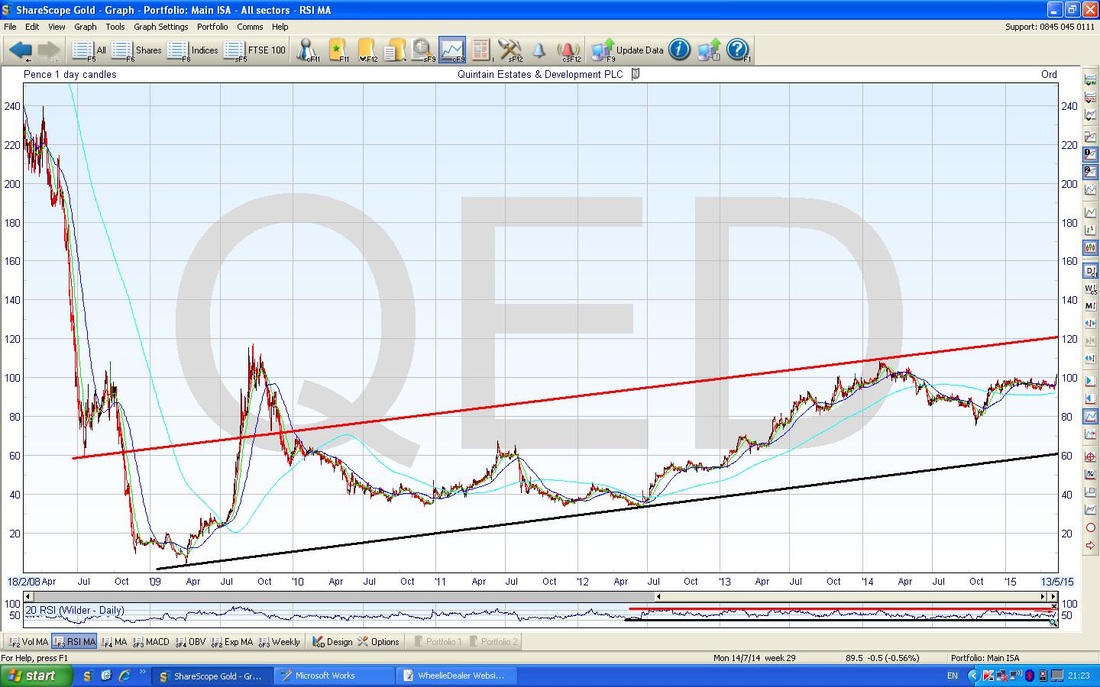
Another Risk has recently gone away. A Labour government could have been bad news for QED as they intended impose all sorts of Taxes and Regulation, especially on Retail Property in London. It looks like the New Administration will be stable and here for the full term of 5 years. Technicals As usual, I will run through the usual Charts and Indicators I always use - to get more detail on these, please see my Blogs on OPAY which you can find using the ‘Categories’ filter or by looking at the ‘Blog Index List’ under the ‘Beginners / Useful Links’ tab of this Website. As always, I decide what Stocks I want to buy first by looking at their Fundamental aspects and then I use the Technical Chart Factors to try to time my Entry well and I also use the Charts for Exits combined with some Valuation Factors etc. This is a slightly unusual one in that I did not really get Perfect Technical Buy Signals as I will demonstrate below, but part of my Buy was based on wanting to get in before the Final Results on Friday 22nd May - so I was prepared to accept a less than perfect Technical landscape. If you look at the Chart below, you will see the Longer Term picture - as ever, I try to always start with a Long View as established Trends tend to dominate over the Short Term. In this case, we have a lovely clear Uptrend Channel going back to 2008, which I have marked with a Black Line at the bottom and a Red Line at the top. The Price is currently about half way up the Channel as you should see.
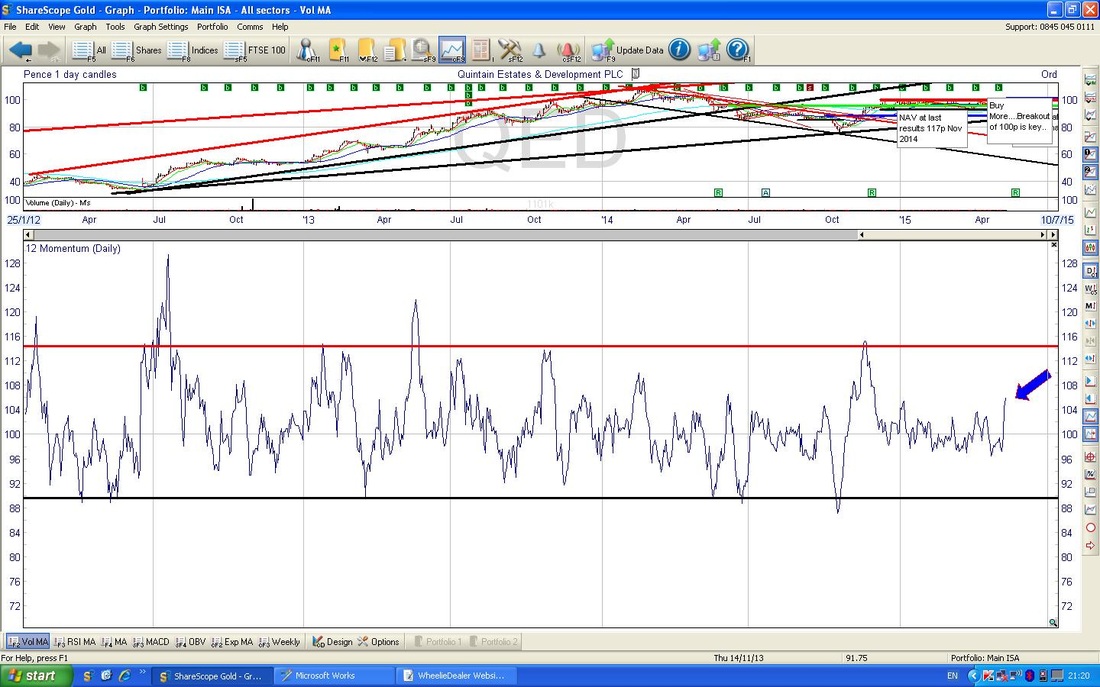
The Screenshot below shows the very Short Term Momentum Indicator (MI) - I have put in lines to mark where it tends to Reverse - the Peaks are when you should Sell and the Troughs are when you should Buy, on a very Short Term view (just a few days really).
The Blue Arrow marks where the MI currently is - you should be able to see that it is moving up and still has some way to go before we reach the point where the Price usually turns down again.
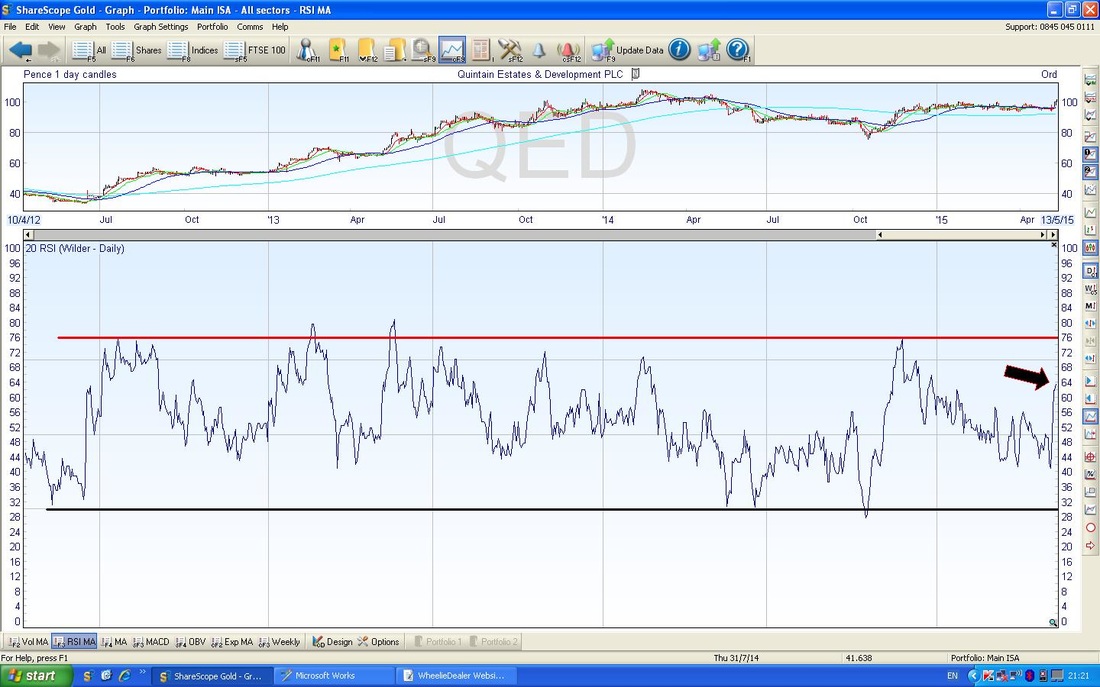
The Chart below is quite similar to that above. In this one, the bottom Window is a much longer Timeframe and shows the Relative Strength Indicator (RSI). This is one of my favourite Tools and is very reliable. The logic is that when the RSI is down at 30 or below you Buy and when it is at 70 or above you Sell. Lovely and simple, but as ever there are some nuances that you learn with practice - I will let you discover these yourself !!
Please note that the RSI is a ‘slower’ indicator than the MI - the latter is very Short Term (valid for days) whereas the RSI tends to be over a longer period - weeks even. The RSI is the better one to use if you want simplicity. My Black Arrow points out where the RSI was when I made my Buy Decision on Wednesday Night - it is at about 64 and has room to move up as the Price tends to Peak when the RSI gets up quite high - as much as 76 even.
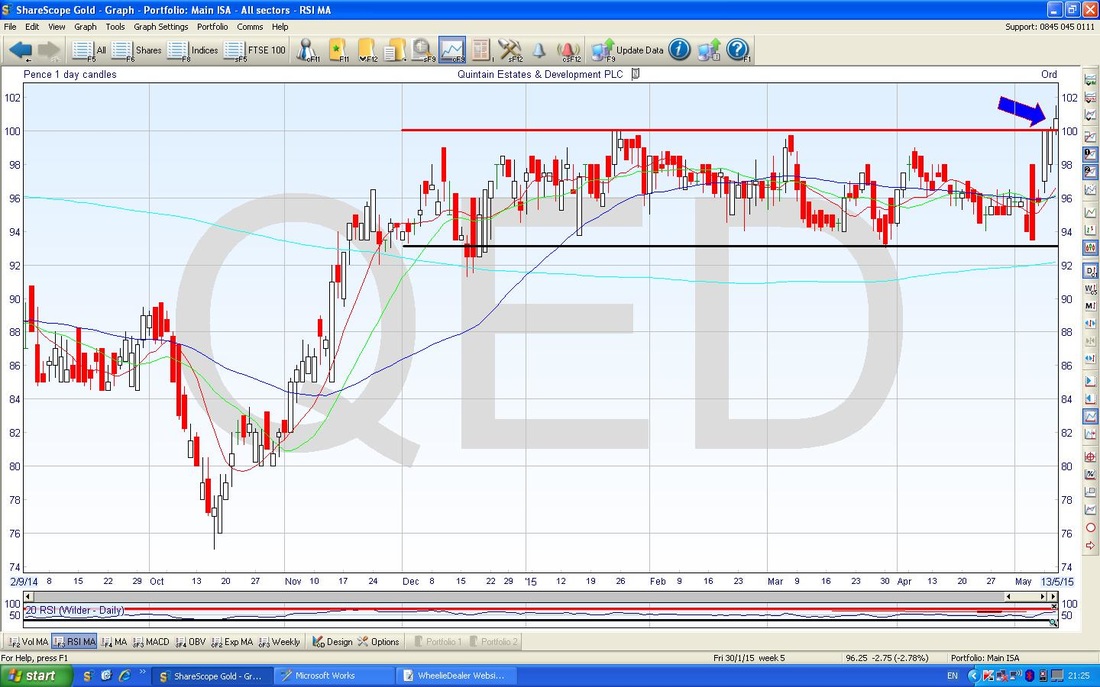
The Chart Below is really the key one - I have been deliberately holding it back although it really is what made my Decision to Buy. You should be able to see that the Price has been moving in a fairly tight range for about 5 months - in fact for all of 2015 so far - between about 93p and 100p as I have marked on the Chart with the Horizontal Lines.
This is a classic ‘Consolidation’ phase where the Price has been in an Upmove and has then got to the point where neither the Bulls nor the Bears have the upper hand. So, for 5 months both sides have fought viciously with tooth and claw, but finally the Bulls have got their Horns out and charged through to the Upside and we got the Breakout - this tends to be a great signal that the Price is going to continue moving up quickly and such Breakouts are well worth looking for. My Blue Arrow marks the Breakout which happened on Wednesday.
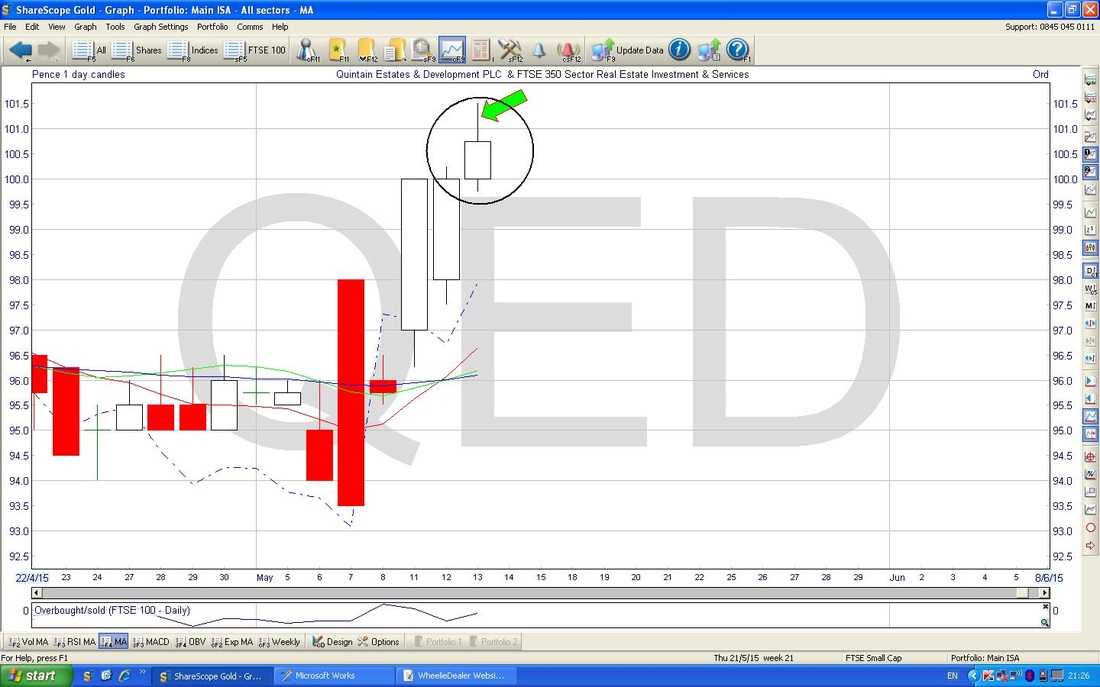
Ah, but all is not perfect. If you take a look at the Chart below, I have zoomed in on the last few Candles that were generated over the last 15 days or so. What I want to show is that even though we got the Breakout on Wednesday, the Candle was not the Perfect Strong Up one I would have liked, but it actually failed to hold the Highs of the Day.
I have Circled the Candle produced in Wednesday’s Trading and the Green Arrow points to the ‘Wick’ or ‘Tail’ where the Price moved up to a Peak during the Day but then fell back - this is not ideal. I would have liked it to have closed at the High of the Day. Anyway, this is not ideal but the bottom line is that we got the Breakout and the Results are on Friday 22nd May and I was keen to get in before these. I expect the Net Asset Value to be up a lot and the Market should like this. The way my Target Price will be reached is via a combination of rising NAV and a lowering of the Discount to NAV - a lovely dose of ‘Double Whammy’ if it pays off. That’s it, wd
0 Comments
Leave a Reply. |
'Educational' WheelieBlogsWelcome to my Educational Blog Page - I have another 'Stocks & Markets' Blog Page which you can access via a Button on the top of the Homepage. Archives
May 2024
Categories
All
Please see the Full Range of Book Ideas in Wheelie's Bookshop.
|


