

|
educational blogs |
|
Last week we saw more rises on the FTSE100 and European Indexes although the US ones didn’t really do a lot. Markets in general look very toppy to me and I have big Short Positions in place to hedge my Long Portfolio of Stocks as we come into the usually difficult Autumn period - September has a reputation for being the worst month and we are not far away now.
Historical Context According to the UK Stockmarket Almanac 2016, for the coming Week (w/c 15th August 2016), the FTSE100 tends to be up for 65% of Years with a Positive Return of 0.2%. So the backdrop is favourable. It is worth noting also that the following week tends to be strong.
FTSE100
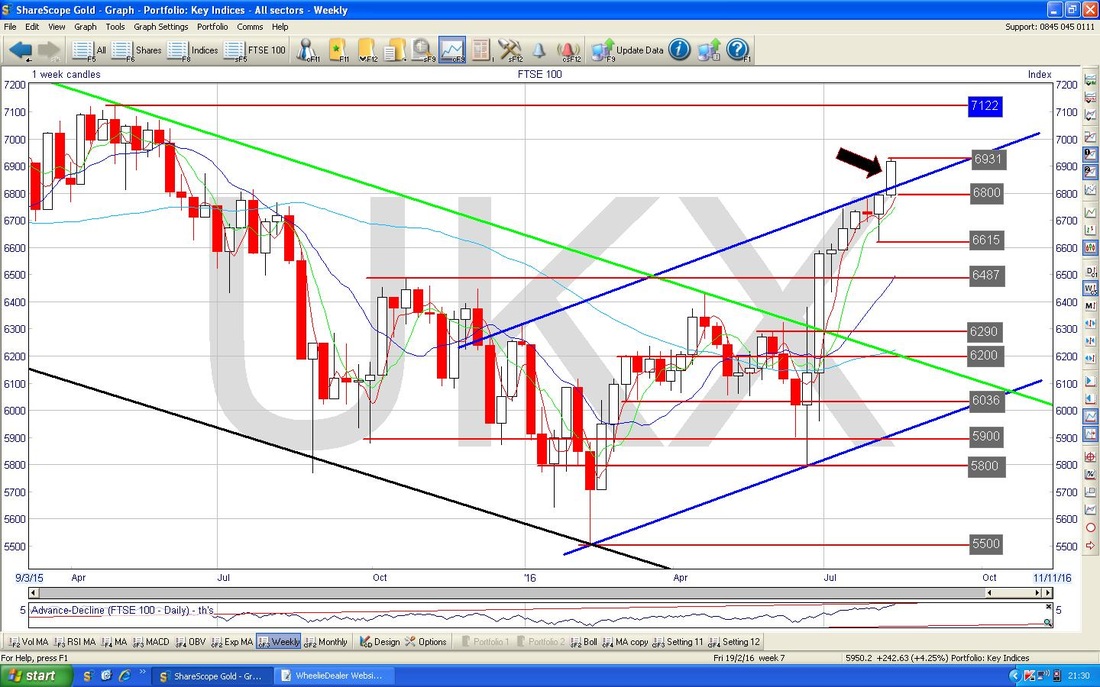
Some Big Picture stuff first because in technical terms there is a critical development here. This Chart (as usual from the brilliant ShareScope software that I use as my ‘workbench’), has the Daily Candlesticks going back about 4 years. Note my Black Arrow which is pointing to the Black Line which is the bottom of an Uptrend Channel for the Bull Market which ran from the 2009 Credit Crunch low point. Note how the FTSE100 Price fell out of that Uptrend Channel in late 2015 and then we had the crazy lurches down of early 2016 and then we have seen an immensely strong rally since the Brexit Vote. The important thing here is that my Blue Arrow is now pointing to where we closed on Friday 12th August 2016 at 6916 (as per the Blue Textbox) which is bang on the Black Uptrend Line. What the Price does from here is critical. For the Bulls it must now get above this line and move back into the Uptrend Channel and for the Bears it must bounce down off the Black Line. I suspect the most likely outcome here is that the Price bounces down because this is a very strong Resistance Line. My Yellow Circle is highlighting an Area of Resistance which the Price needs to wade through - it has done very well so far, but I suspect this will be tough. Note 7122 is the All Time High (ATH) and a break above this would be a very Bullish development. I think this is very possible later in 2016 but the Market seems over-extended in the Short Term and I suspect it will need a pullback and a period of calming down before it can make headway. Having said that, I do think Valuations are very stretched but Prices can still rise despite this - especially with all the Monetary Manipulation being undertaken by Central Banks and Governments. 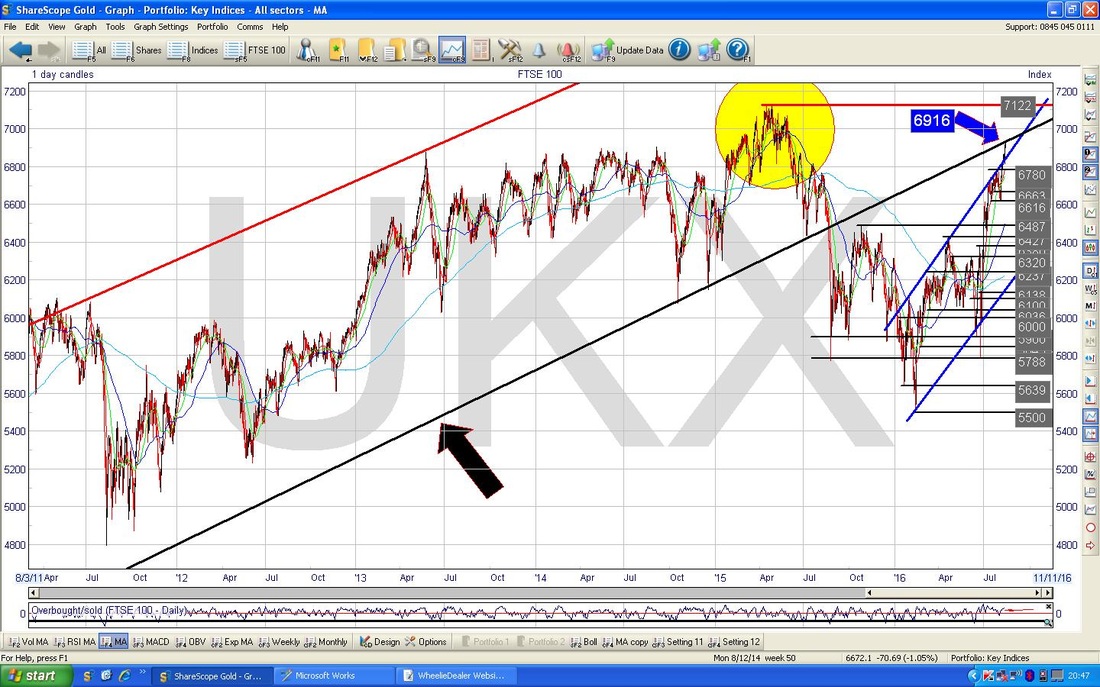
The Chart below zooms in to about the last 3 months ish. My small Green Circle highlights a Doji Candle which was formed on Friday and in the context of so many gains of late, this could mark a Reversal - if it doesn’t it is at least indicating to us that the move up is tired and could Reverse soon.
Note how the Price has broken out over the top of my Blue Lines Uptrend Channel (you can see this Channel more clearly on the previous Chart) and this is pretty bullish behaviour. Resistance is now clearly at the 6916 Level I mentioned earlier and immediate Support is at 6900, then just above 6800. 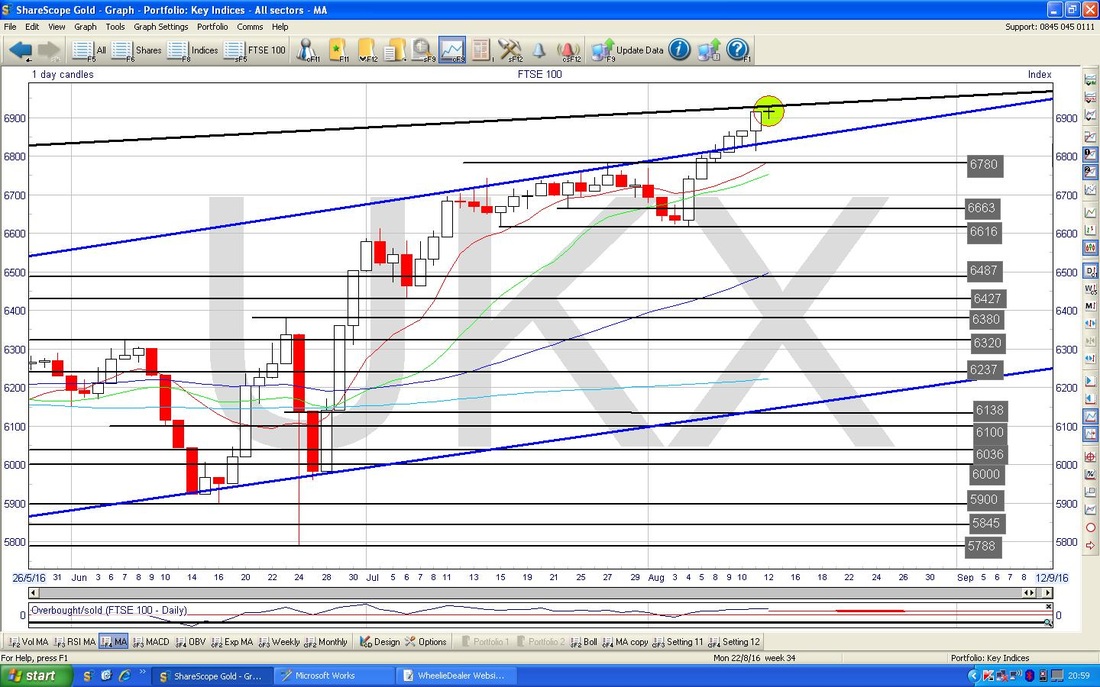
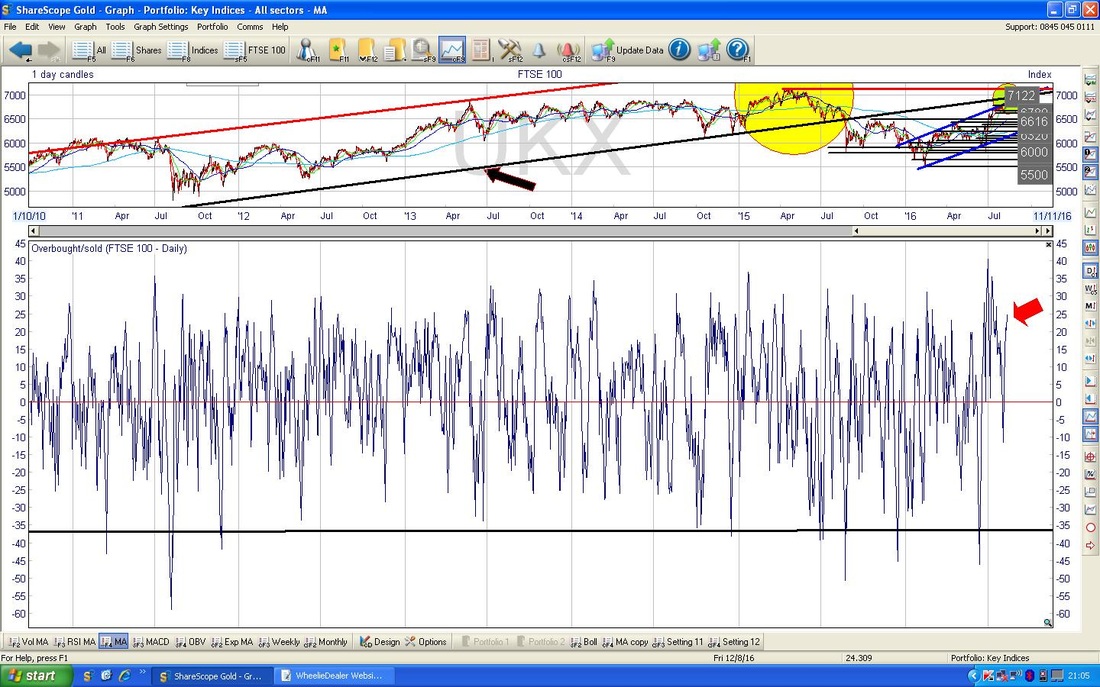
In the bottom window of the ScreenShot below we have the Overbought/Oversold Oscillator thing for the FTSE100 Daily. My Red Arrow is pointing to where it is now - as you can see, it is very high and it could easily turn down at this level. This is a very short term indicator.
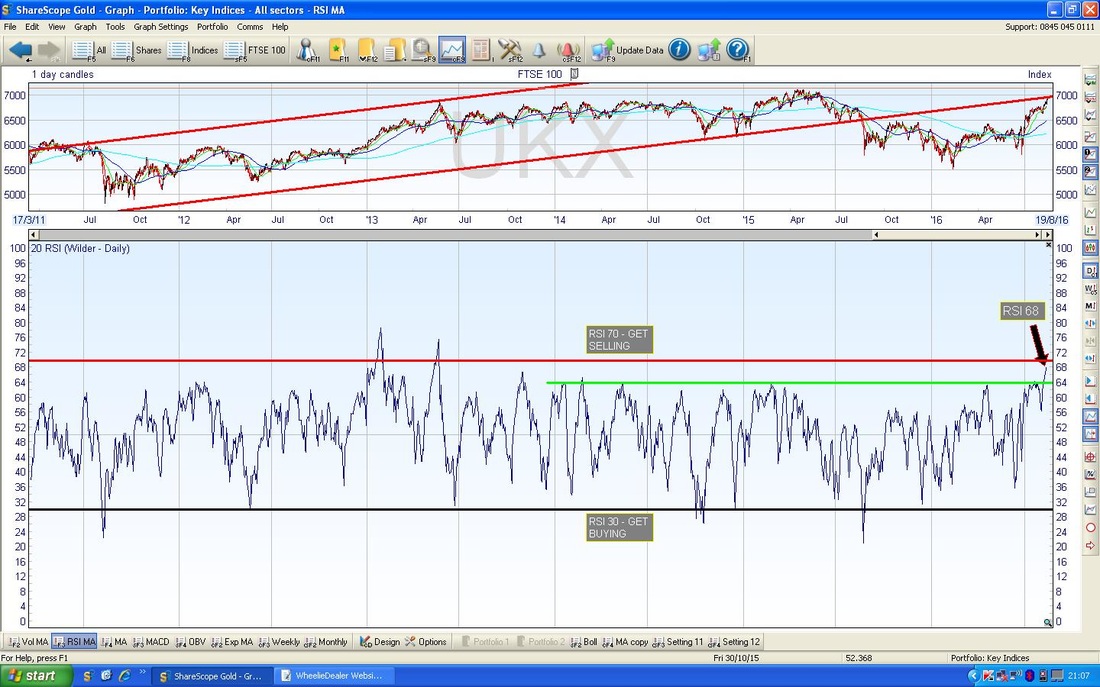
In the bottom window on the Screen below we have the RSI (Relative Strength Index) for the FTSE100 Daily. Note the current reading where my Black Arrow is which is at RSI 68. This is a very high level - RSI 70, where my Red Horizontal Line is, tends to be the standard ‘Overbought’ level and look at how the FTSE100 has very rarely gone over this level in the last 5 years. In fact, going back about 20 years I can only see 5 times where it went over this level of RSI 70. Clearly we are toppy.
In the top window on the ScreenShot below we have the Bollinger Bands for the FTSE100 Daily. My Yellow Circle highlights how the Price is hugging the Upper Band - this is not a problem and shows bullishness but obviously it does not go on like this forever.
In the window at the bottom we have the MACD (Moving Average Convergence Divergence) for the FTSE100 Daily. My Blue and Black Arrows are pointing out how we had a Bullish MACD Cross 2 days ago. 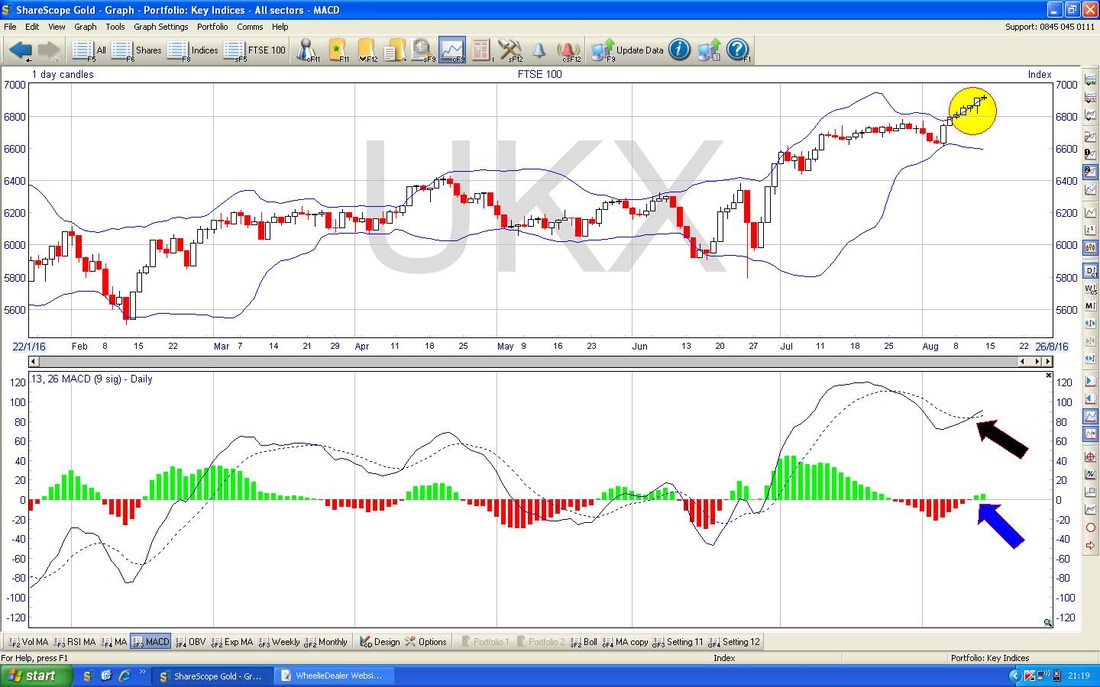
The Screen below has the Weekly Candles for the FTSE100. My Black Arrow is pointing to a nice Big Bullish Up Candle from last week - and note how it got up above the Upper Line of the Blue Lines Uptrend Channel. Note also the 7122 All Time High (ATH) in the Blue Textbox - this is the key level to get over.
DAX (German)
There has been a Bullish Breakout on the DAX last week - the Chart below shows an Uptrend Channel which goes back to the Credit Crunch Lows in 2009 and I have included the last 3 years or so. My Blue Arrow is pointing to a Blue Downtrend Line which has been in place for about 1.5 years (Regular Readers will probably recognise this from recent weeks) and my Green Circle shows the last 5 days of Candlesticks where the Price has broken out of the Blue Line to the Upside. This is bullish behaviour. 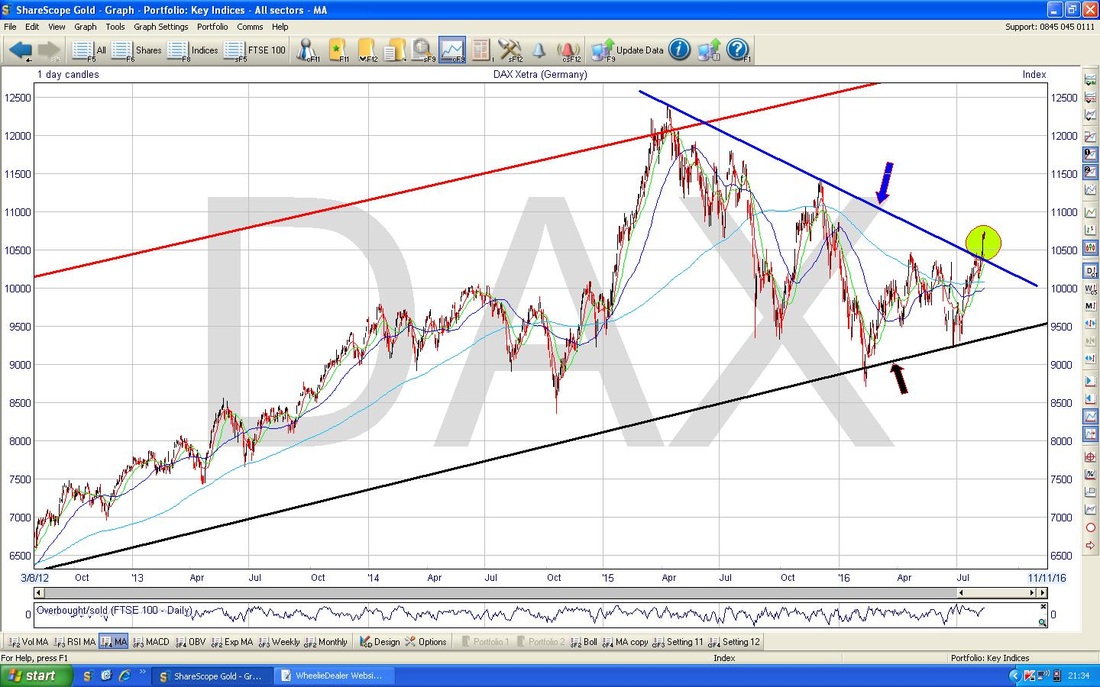
On the chart below I have zoomed in on the DAX Daily Candles to about the last 4 months. You can more clearly see the Blue Downtrend Line breakout here and my Yellow Circle highlights the Candlesticks which were formed on Thursday and Friday last week. The thing to note here is that we had a big White Up Candle on Thursday and then on Friday we had a ‘Star Doji’ which was ‘Inside’ the range of the White Candle from Thursday. The point here is that we need One more Day to tell us what is most likely to happen in the coming week - if we have a Down Day on Monday then this will form a ‘3 Inside Down’ 3-Day Candle Pattern (will most likely mean more falls) and it we rise on Monday, then it is a ‘3 Inside Up’ Pattern (leading most likely to more gains).
To a large extent I suspect that the DAX will follow the other Major Global Indexes, particularly those in the US. 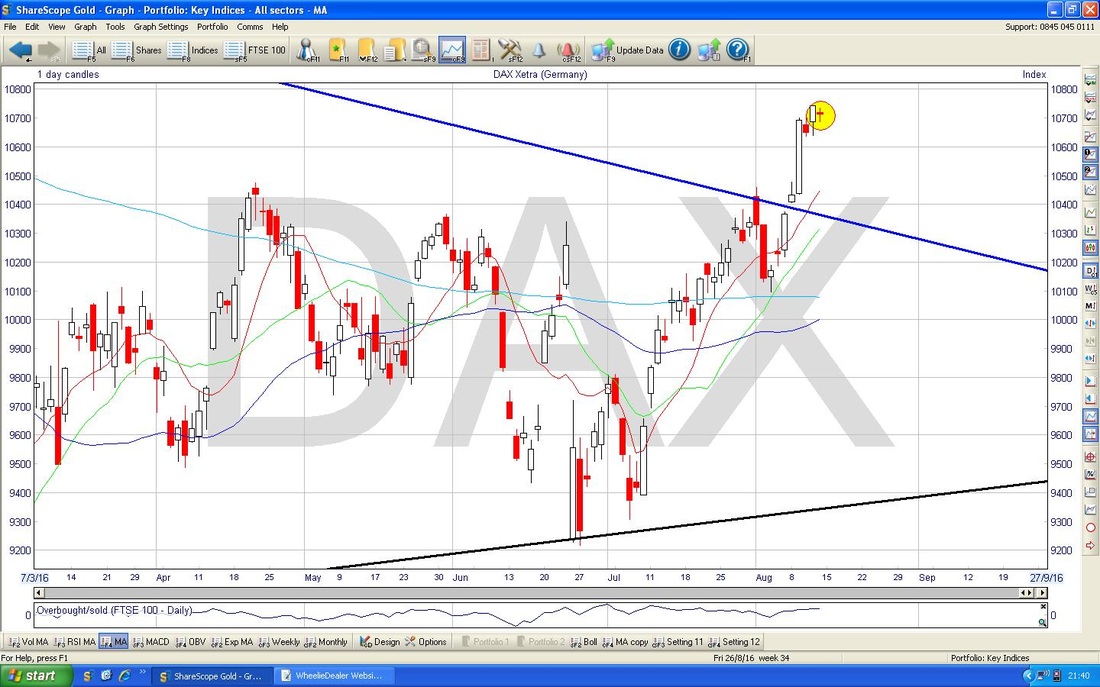
S&P500
My Chart below shows the Weekly Candles for the S&P500 - the most important US Index in my view (although arguably the Nasdaq100 is more important for me as I have a Short on it !!). My Black Arrow is pointing to a Doji Candle which was produced last week which basically shows that the S&P500 went nowhere last week and in the context of the recent gains, this could mark a Reversal or at least show that a turn is coming soon. We are continually seeing new ATHs here and the latest Level to get over is 2188 as per my Blue Textbox. 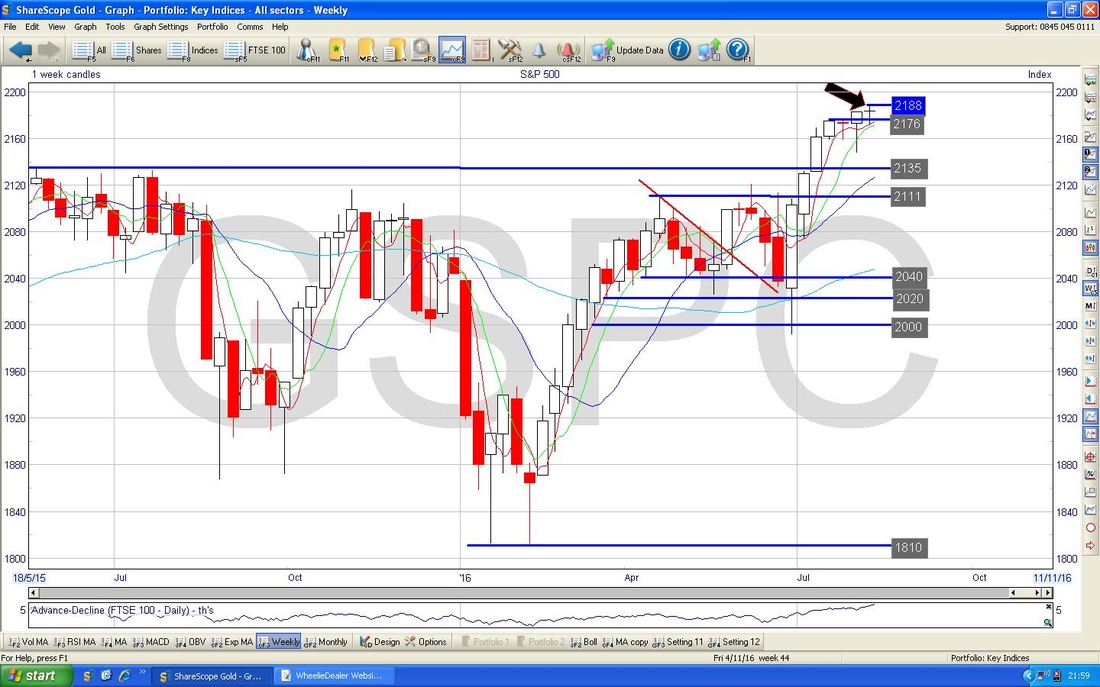
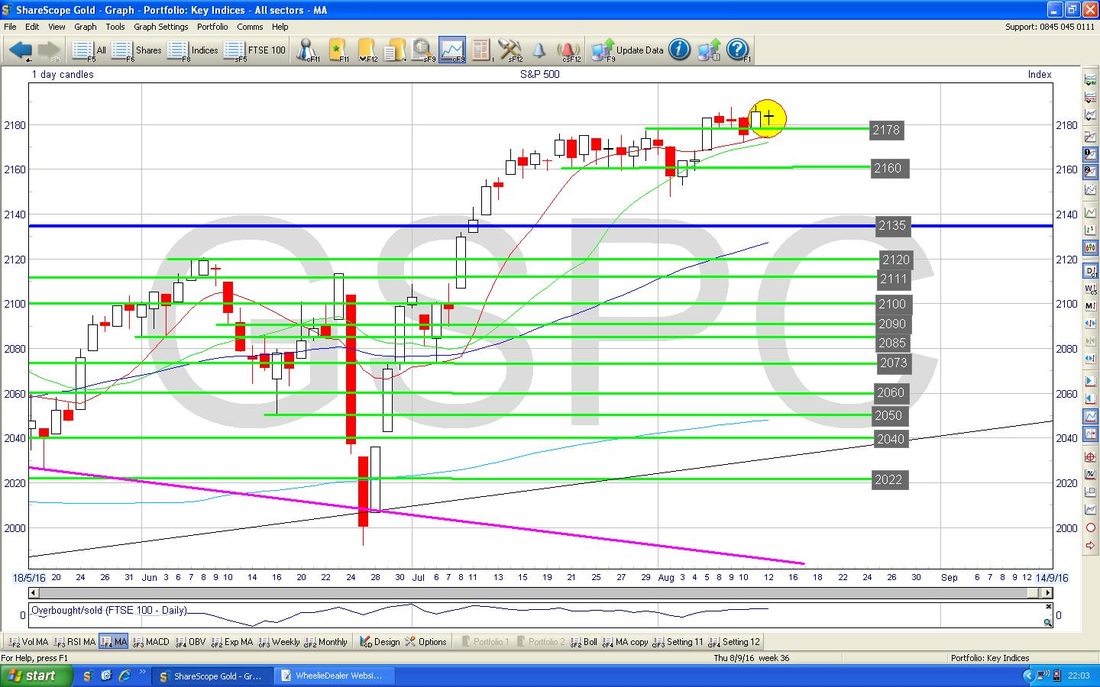
The Chart below has the Daily Candles for the S&P500 and I have zoomed in close so it is clear to see the Candles from the last 2 days. I have highlighted these with the Yellow Circle and you can see we have a similar ‘Inside Day’ type setup as with the DAX - so whether we are Up or Down on Monday 15th August will create a 3-Day Candle Pattern which could indicate the direction from here.
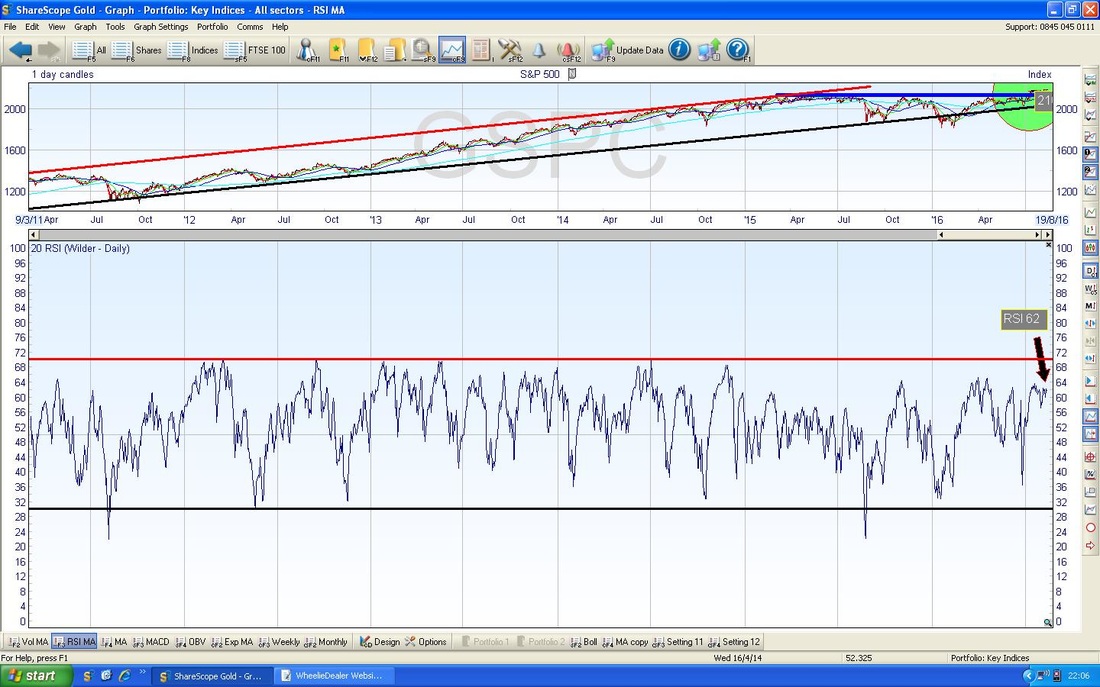
The bottom window below has the RSI for the S&P500 Daily. At RSI 62 it is not particularly high so there is room for the S&P500 to rise a bit - however, note it very rarely gets over RSI 70 (my Red Horizontal Line) and it is currently dropping from recent Highs at RSI 64/65. It is pretty slight, but this might be seen as a Bearish Divergence as the Price Line has been rising.
Nasdaq100 (US Tech Index)
The Chart below has the Daily Candles for the Nasdaq100 going back about 3 months. My Black Arrow is pointing to a small Up Candle from Friday after a Doji on Thursday where a New ATH was banged in at 4813. Up Candles are sort of Bullish but when they are small like this it is not so great. Just last week we were treated to a succession of Doji Candles where the Price moved in a very tight range. Obviously the Bullish Signal here would be a move up above the New ATH at 4813. I have a Short position on the Nasdaq100. 
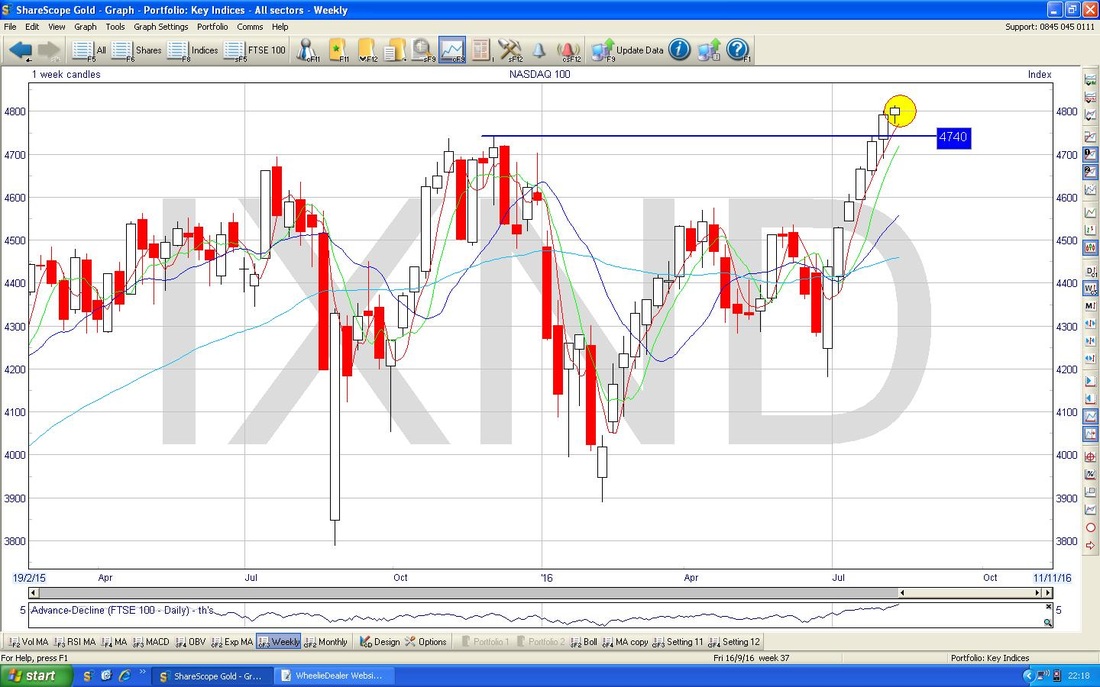
The Chart below has the Weekly Candles for the Nasdaq100. My Yellow Circle is highlighting a Doji Candle which may Signal a Reversal - after 7 Up Weeks some kind of pullback would not be a surprise - and in many ways it might be positive because things do look a little overheated here.
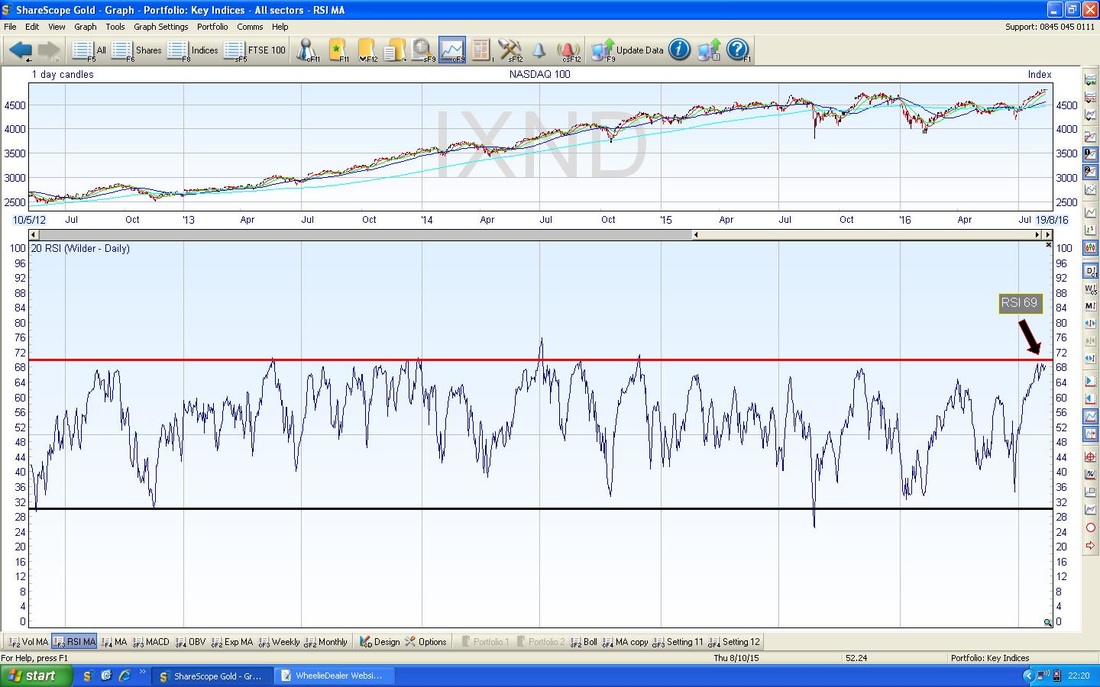
In the bottom window below we have the RSI for the Nasdaq100 Daily. With a reading of RSI 69 it is clearly toppy.
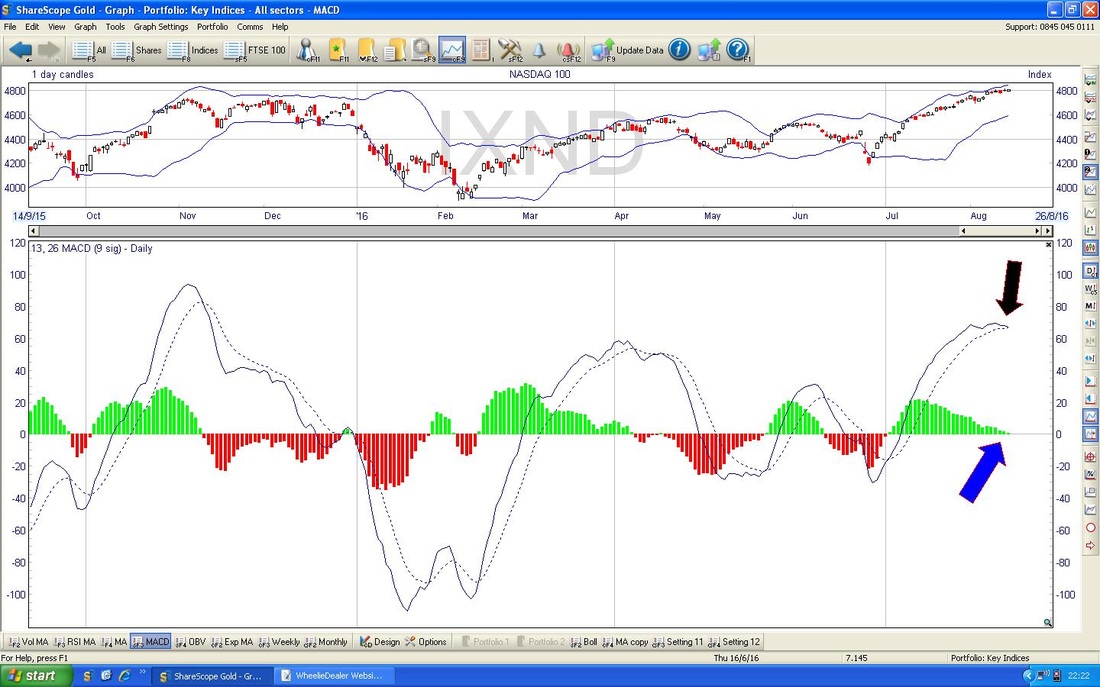
In the bottom window on the Screen below we have the MACD for the Nasdaq100 Daily. My Black Arrow and Blue Arrow are showing different representations of the same thing - we are on the Verge of a Bearish MACD Cross.
Brent Crude Oil
My Chart below has the Daily Candles for Brent going back about 4 months. The key thing here is that we are still in the confines of the Downtrend Channel marked by my Green Parallel Lines. We need to see the Price over $48 really to get any sense that things are getting more Bullish and the Downtrend might be broken. 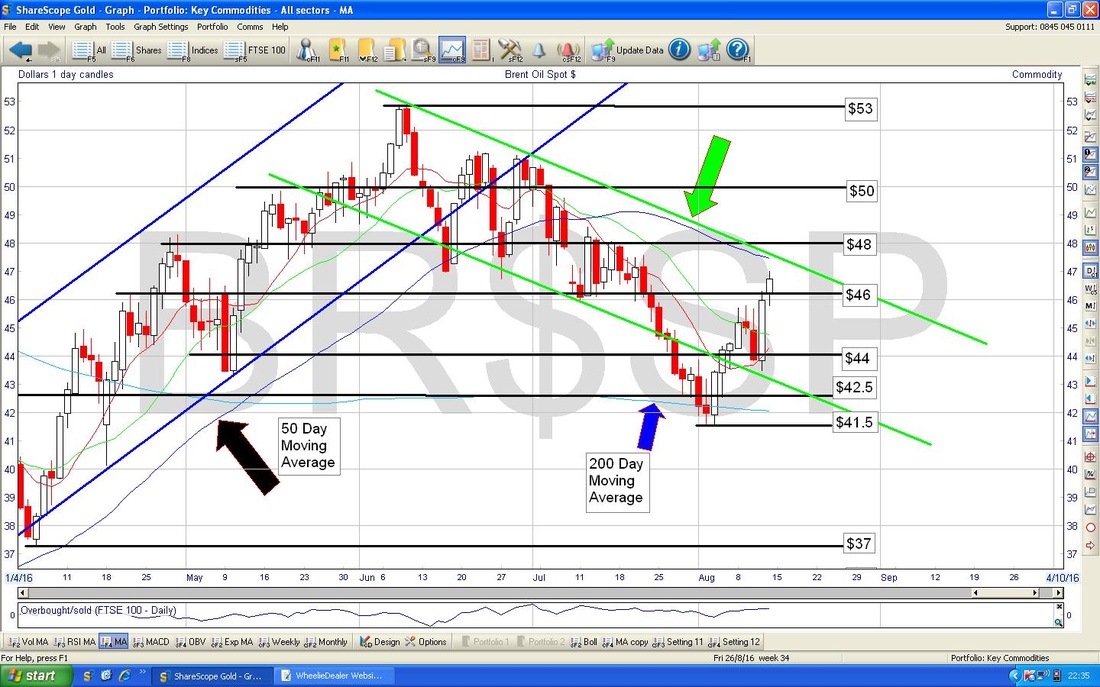
Gold
The Chart below has the Daily Candles for Gold (Spot). My Black Arrow is pointing to a Hammer Candle which was produced on Monday 8th August 2016 and note how the Price moved up after this culminating with an Up Candle on Friday which I have marked with my Blue Arrow. However, we seem to now be in a bit of a Range between $1329 and $1360 - how this resolves, either breaking out to the Upside or Downside of the Range may tell us the future direction. Right, that’s it, I hope the coming week is Prosperous and Pleasant for all !! Cheers, WD. 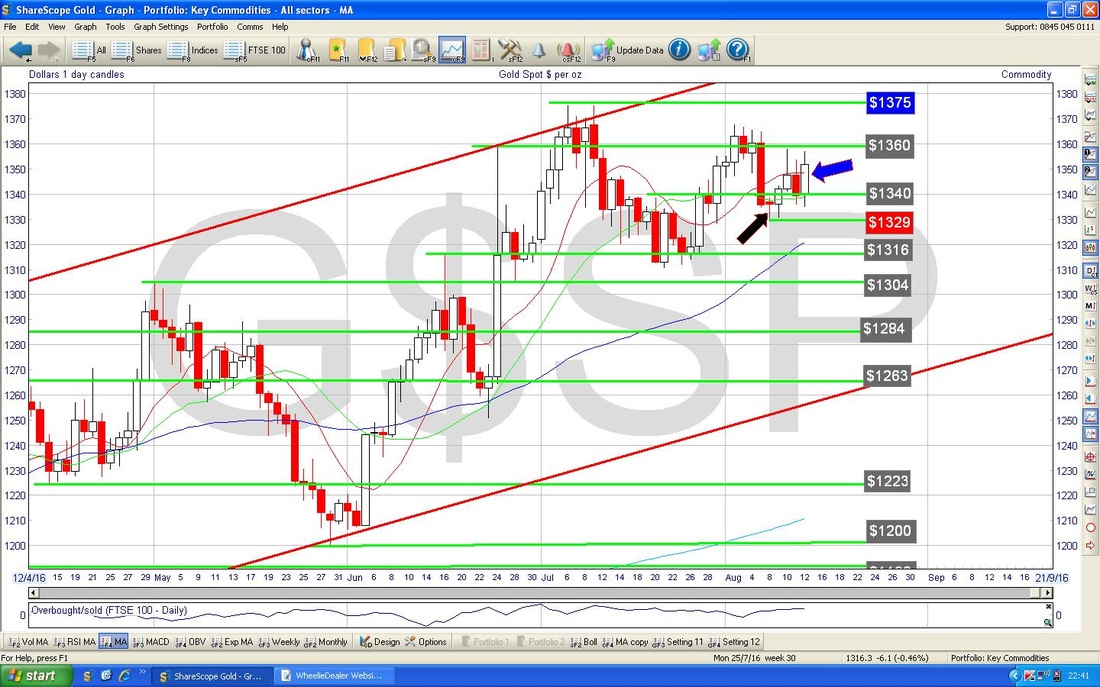
4 Comments
mr catflap
15/8/2016 12:05:12 pm
"The FTSE100 has very rarely gone over a RSI of 70 in the last 5 years. In fact, going back about 20 years I can only see 5 times where it went over this level of RSI 70. Clearly we are toppy."
WheelieDealer
19/8/2016 09:55:01 pm
Hi mr catflap, I think you are right that an RSI can keep going up after the FTSE100 hits RSI 70 but it tends not to go much higher and in any event that probably only means a couple more days of upside. The crunch is that once the FTSE100 gets up near RSI 70 then any Rally will be getting tired.
Ed
15/8/2016 06:58:06 pm
A very logical summary wheelie but the markets seem anything but logical these days. I suspect when the first sellers start, everyone else will start doing the same. Just a matter of when.
WheelieDealer
19/8/2016 09:59:54 pm
Hi Ed, That's a great observation - Markets really seem quite baffling at the moment and any rational thought concerning them will conclude that complacency is rife and a Pullback is needed to calm things down a bit. However, as you suggest, Markets can stay bizarre for long periods of time, but of course, things like Valuations don't matter until they suddenly DO matter !! (these things can turn on a sixpence). Leave a Reply. |
'Educational' WheelieBlogsWelcome to my Educational Blog Page - I have another 'Stocks & Markets' Blog Page which you can access via a Button on the top of the Homepage. Archives
May 2024
Categories
All
Please see the Full Range of Book Ideas in Wheelie's Bookshop.
|
