

|
educational blogs |
|
THIS IS NOT A TIP OR RECOMMENDATION. I AM NOT A TIPSTER. PLEASE DO YOUR OWN RESEARCH. PLEASE READ THE DISCLAIMER ON THE HOME PAGE OF MY WEBSITE. IF YOU COPY MY TRADES, YOU WILL PROBABLY LOSE MONEY. I HAVE A LARGE PORTFOLIO AND I USE DIVERSIFICATION TO SPREAD RISK ALONG WITH TRICKS LIKE HEDGING AND OCCASIONALLY BY THE USE OF STOPLOSSES - IF YOU BUY ANY STOCK YOU REALLY SHOULD FOCUS ON HOW IT FITS IN YOUR PORTFOLIO AND KEEP RISK MANAGEMENT AT THE FOREFRONT OF EVERYTHING YOU DO. BE AWARE THAT ALL INVESTORS/TRADERS GET THINGS WRONG AND MANY STOCK SELECTIONS WILL WORK OUT BADLY.
If you have not yet had a chance to read Part 1, then you can find it here: http://wheeliedealer.weebly.com/blog/primary-health-properties-php-buy-rationale-part-1-of-2 Valuation At the time of writing this Blog the Mid Price in the Market is 114p - I will use this Number for the purposes of this Valuation Section but of course in practice the numbers change as the Price moves up and down. Normally when I write these ‘Stock Buy Rationale’ Blogs I tend to use the actual Buy Price that I paid and that is obviously logical and relevant. However, in this case I am so late in getting the Blog published that I think it might be more useful for Readers if I use a Price closer to the prevailing Price at this point in time. Having said that my Buy Price was about 112p so it is not wildly different anyway.
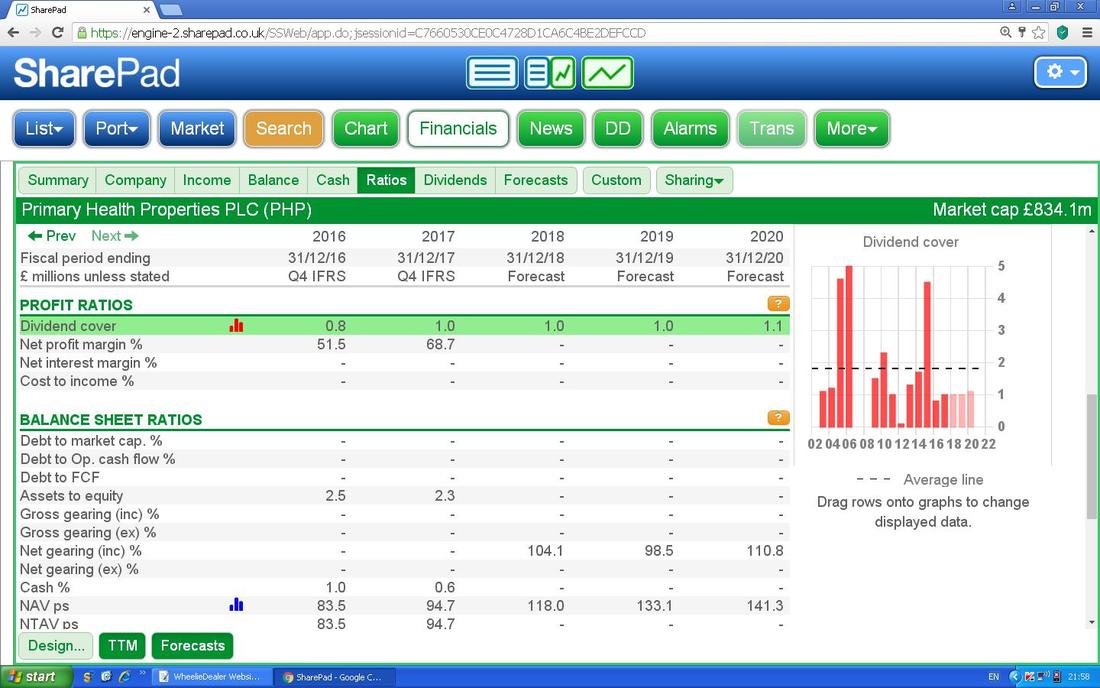
On the ScreenShot below I have used the SharePad ‘Ratios’ page and then with CTRL+ I have zoomed in so that the Text is larger in the hope that Readers can just about make out the numbers. Anyway, this is extremely useful because on the Green Horizontal Highlighted bit we have the ‘NAV ps’ which is obviously the Net Asset Value Per Share and the great thing is that SharePad has automatically put in the Forecast figures. One thing I do notice though is that I cannot find a Line which has the Premium or Discount to NAV - I am sure it is in there somewhere but it is dead easy to work it out so I will just take that approach.
Therefore, on the Latest NAV Actual Value (as opposed to a Forecast) of 94.7p from 31/12/17, PHP is trading on a Premium to NAV of 20.3%. On the Forecast NAV of 118p for 21/12/2018 (that is just over 6 months time), PHP is on a Forward DISCOUNT to NAV of 3.4% and for 21/12/2019 PHP is on a Forward DISCOUNT to NAV of 14.4%. I do however find these NAV Forecasts slightly strange - they seem rather high. I am not overly concerned as I am buying PHP for its reliable and growing Dividend Yield but it is something Readers might want to investigate further. By the way, on the SharePad Screen I have dragged that Line of Information in the Green Highlight and plonked it in the Graph area to the Right Hand Side so that the Graph with the Red Bars you can see is that NAV Line in a Bar Graph format. Impressive or what? You can graph any of the Lines in these tables in the same way in SharePad. 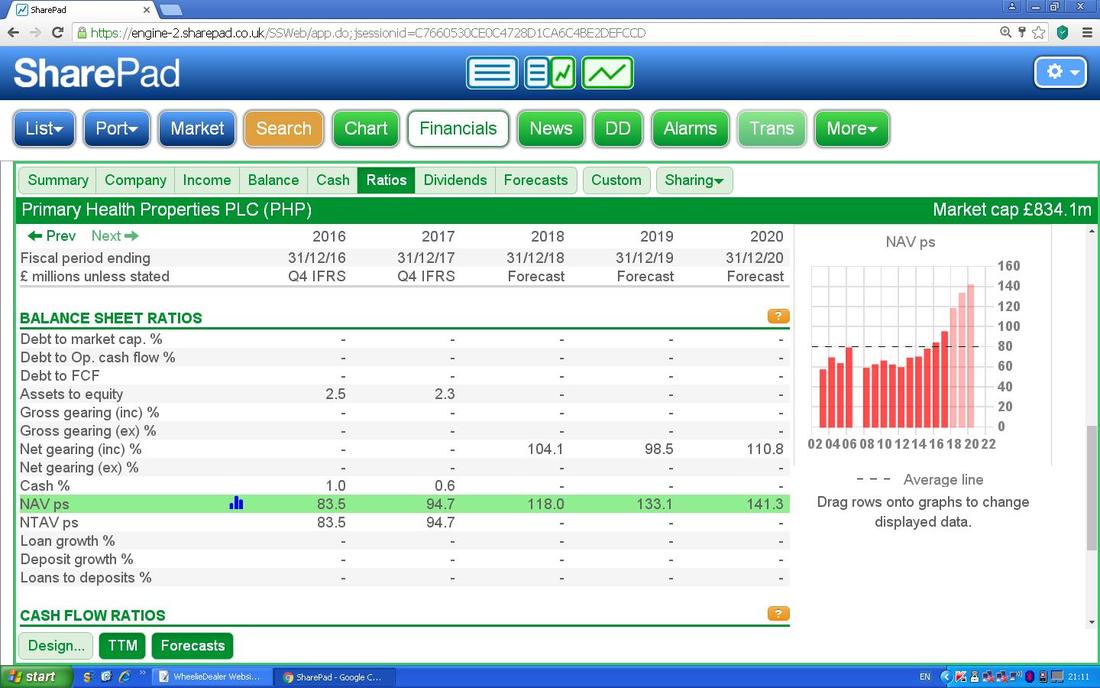
On the Screen below I have moved to the ‘Income’ tab and what I am interested in here is the bit in the Green Highlight marked ‘EPS norm. continuous (p)’ which is of course the Earnings Per Share. Again I have graphed it in the Red Bar Chart but what I am interested in here is the P/E Ratios. On the Current Price of 114p, the Forecast of 5.7p for 2019 gives a Forward P/E of 20 (114p divided by 5.7p) and for 2020 we have a Forward P/E of 18.1 based on Forecast EPS of 6.3p.
On the face of it these are not particularly ‘bad’ numbers but in truth it is pretty irrelevant because using a P/E Ratio on a Property Stock (REIT) is not really the done thing - the Premium or Discount to NAV is much more useful because that is what Analysts etc. are more likely to use as their Yardstick. And of course as we will see in the next Section, I am more focused on the Dividend anyway and the Dividend Yield in itself can be a useful Valuation tool. 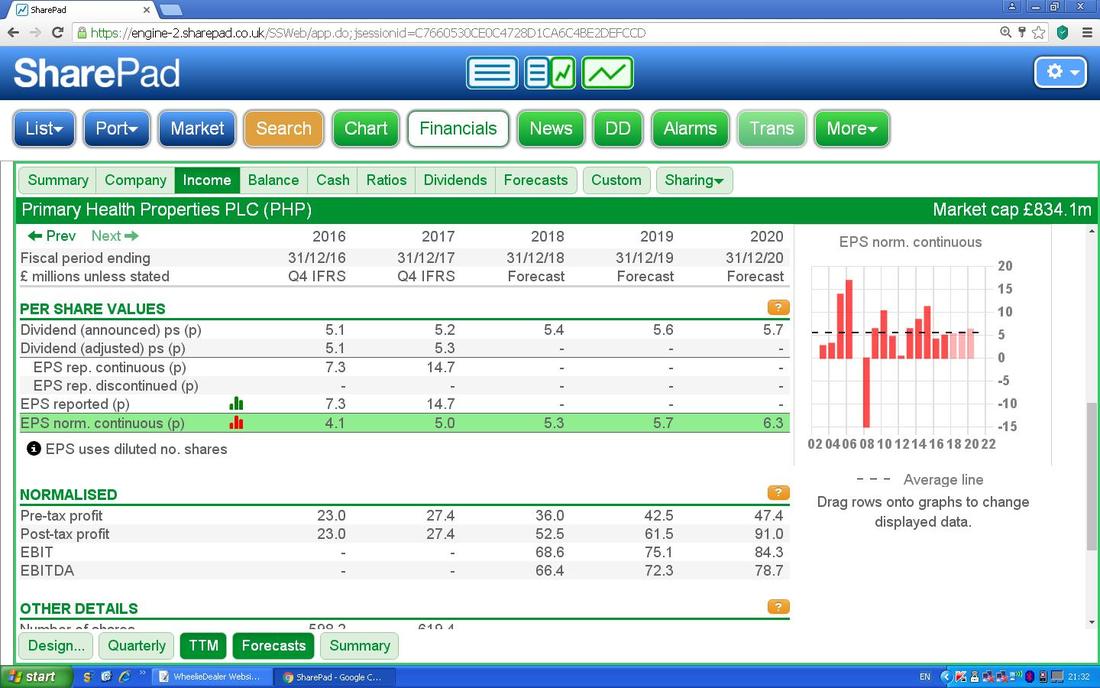
Dividend Considerations
As this Stock is for inclusion in my Income Portfolio, I am putting a lot of emphasis on its Dividend Attributes and therefore I am putting in this Section especially to address these points. Since 2016 Primary Health Properties pays dividends quarterly, on expected payment dates in February, May, August and November each year. You can find more information about the Dividends here: https://www.phpgroup.co.uk/investors/dividends I have taken the ScreenShot below from SharePad and have scrolled down the ‘Ratios’ Page to show this view. I might refer back to this Screen as I go through a few Key Points regarding the Dividend. As in the ‘Valuation’ bit above, the Reference Price for this Screen etc. is 114p. 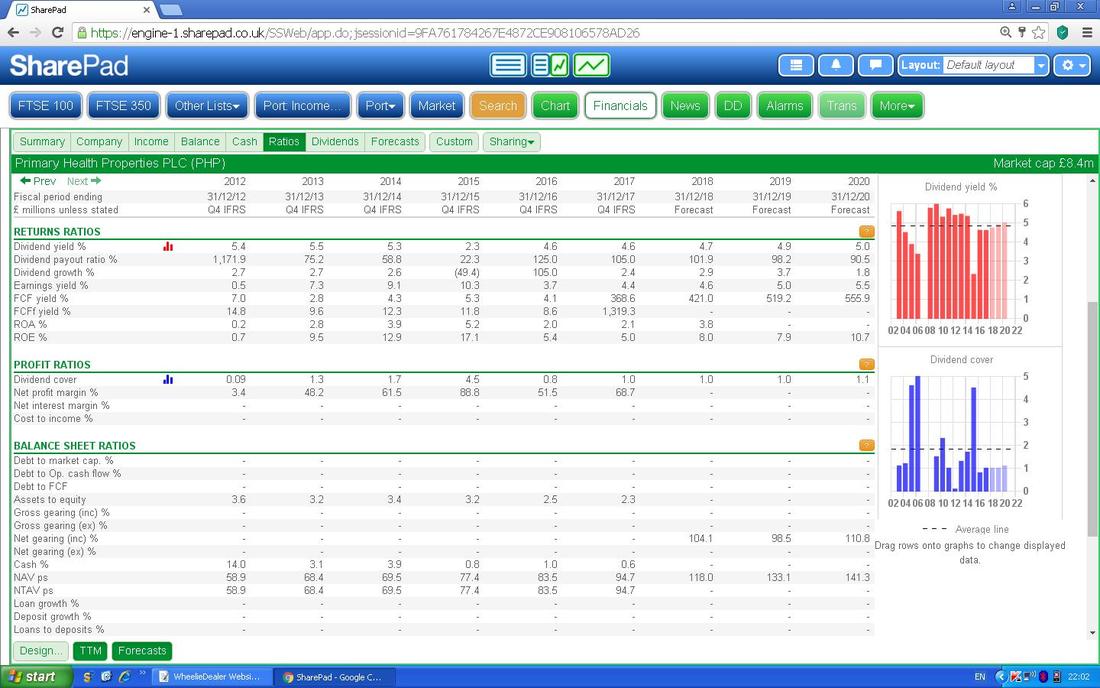
Dividend Yield
I constantly advocate and recommend that Readers should always work out essential Ratios like P/E, PEG, Dividend Yield, etc. themselves as published figures are often wrong but so far I have found the SharePad Numbers to be correct but a Sanity Check of such Ratios is always advisable anyway. For a ‘First Look’ then using published numbers can save time obviously but it is always worth doing the double check of calculating them yourself before buying any Shares. On the SharePad Screen below I have highlighted in Green the ‘Dividend yield %’ line and as you can see at a Price of 114p Buyers are getting 4.6% Dividend Yield based on the latest Historic Numbers and the Forecasts are for 4.7%, 4.9%, 5.0% over the next 3 Years which is just what I am after for my Income Portfolio. Nice. The Bar Chart plots the Dividend Yields and of course that is affected by new Shares being issued and suchlike which is why it is not just a series of rising Bars from Left to Right. It is also a Historic Figure I suspect so that would have varied depending on the Share Price. 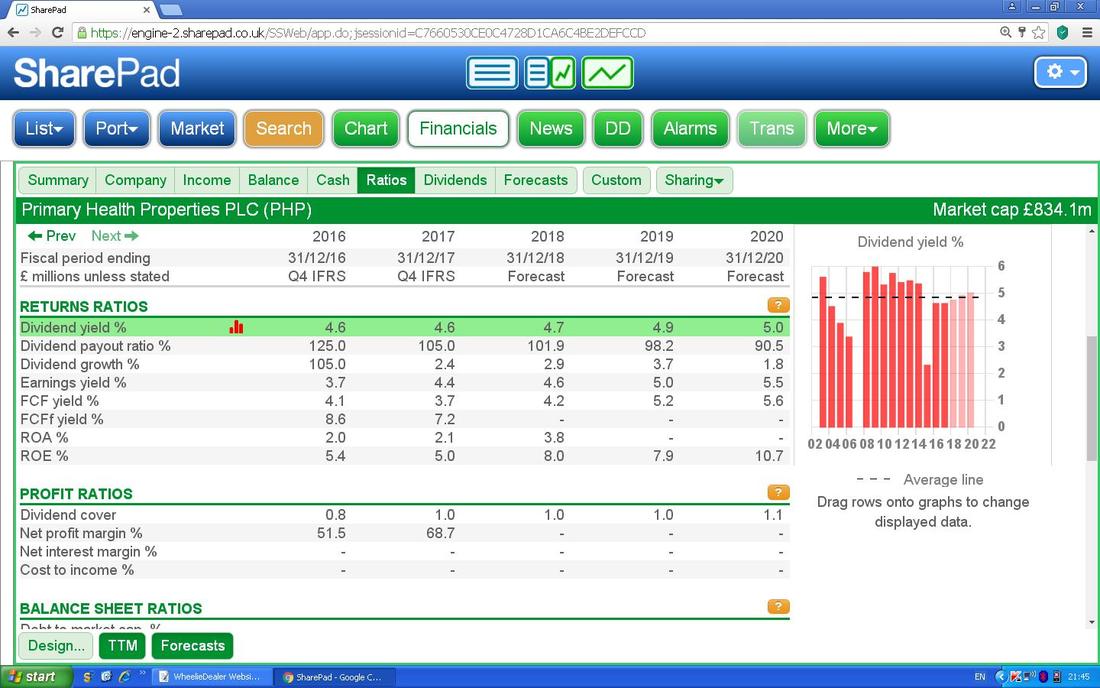
Dividend Cover
I have taken this text from Page 15 of the 2017 Annual Report: “Dividends paid in 2017 were substantially covered by EPRA earnings and we intend to maintain a strategy of paying a progressive dividend that is covered by earnings in each financial year.” So that is exactly the kind of talk I want to hear from the Board but what is really relevant is how much the Earnings Per Share of the Company cover the Dividend Payments per Share. From the ScreenShot below, for the Next 3 Years the EPS Forecasts are for 5.3p, 5.7p then 6.3p and the Dividend Per Share Payouts are due to be 5.4p, 5.6p and 5.7p. Therefore in the first Year (2018), the Dividend is not covered by the Earnings per Share but in the following 2 years the Dividend is covered. This is not a perfect situation but I can live with it and at least it is expected to improve over time. A lack of Dividend Cover from Earnings effectively means that the Company is using its Cash Resources to pay out Dividends - i.e. this is coming from Cash that has been obtained from Disposals of Property (PHP is unlikely to do much of this) and from Share Placings/Issuance and from increasing Debt. So a situation where a Dividend is not properly covered by Earnings cannot be sustained for long. 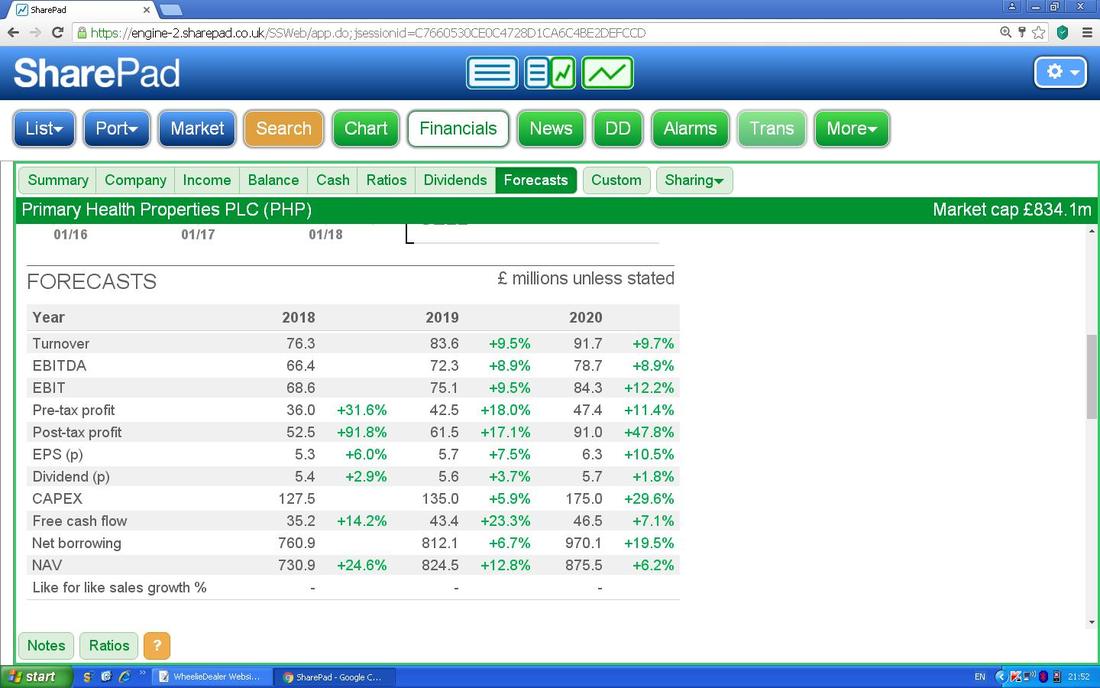
The Dividend Cover I have discussed above is shown in the Green Highlight on the Screen below (but as I have mentioned it is always worth sense-checking everything).
Dividend growth History
The Chart below is obviously from the Share Pad ‘Dividends’ tab as you can see. At first look this made no sense to me - why are the Bars for 2016 onwards so low? Then I realised, each Bar is an actual Dividend Payment and from 2016 PHP started paying Quarterly (i.e. 4 times a year) Dividends rather than just paying an Interim Dividend and a Final Dividend only. 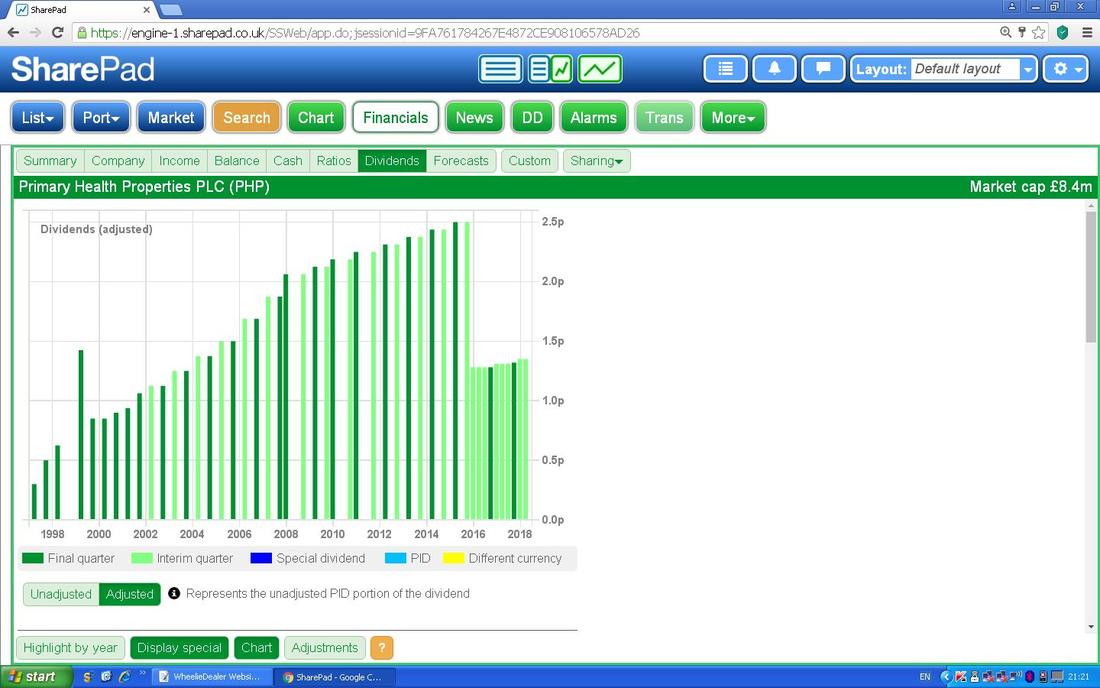
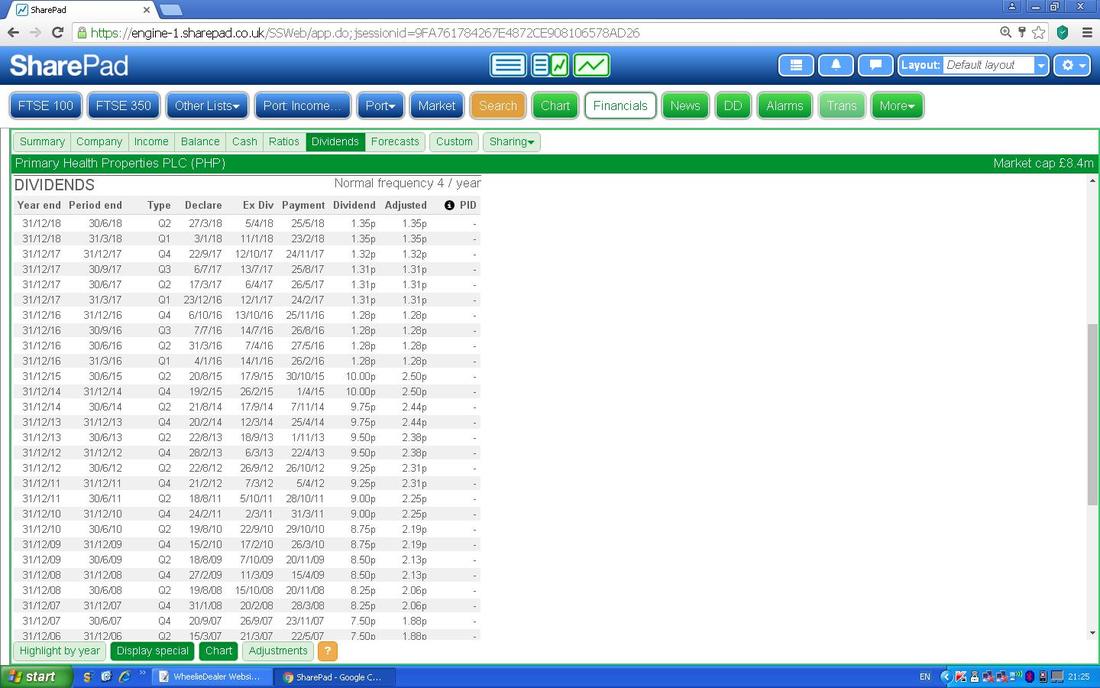
For a bit more colour, if you scroll down below the Bar Chart on SharePad you get this List of the Actual Individual Dividend Payments - it is a long list and I am only showing part of it here.
Anyway, we can clearly say that PHP tends to have had growing Dividends over time !!
Dividend forecasts I have already covered this but for completeness I am shoving the Table below in again. The Forecast Dividend (p) is clearly visible for 2018, 2019 and 2020. 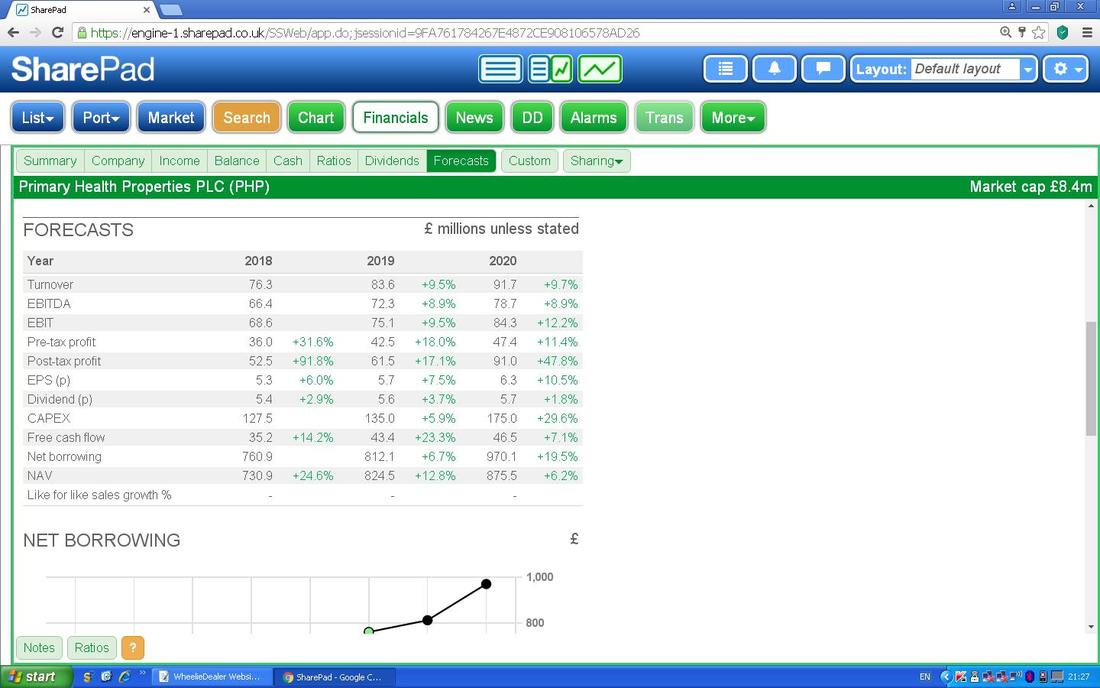
Is the Dividend Sustainable?
Of course this is rather subjective and depends on future Strategic Decisions that PHP may make but on the evidence I have seen regarding rising Dividends for well over 10 years, it seems highly likely that this is a record that PHP Management will be eager to maintain and that in itself puts a lot of pressure on them to ensure Dividends remain a key part of any Investment in PHP. As we saw earlier the Dividend Cover is tight but over time it is looking like it will improve - it is a Risk and something to be aware of. However, in the worst case if something did go wrong (unlikely), the Dividend Yield is quite decent anyway so even a Cut in the Dividend Payment would still mean a reasonable Yield for Shareholders - and I have seen this before where a Stock has a Dividend Cut but within a few Years it is back to where it was before. Such events tend to mean that the Stock takes a big hit to the Share Price but this will recover with the Dividend over time and of course it gives Shareholders an opportunity to buy more if they still wish to hold the Stock. I think a cut of this sort is very unlikely with PHP. Simply by its nature of Government funded Rental Payments with an Inflation element on many of the Properties and the defensive and reliable qualities of the Healthcare Sector, it seems that PHP will be able to keep growing Dividend Payments and adding to the Estate of Properties (at the time of writing they had just acquired another Health Centre in Swindon). Cashflow and Dividend Cover If you look at the Highlighted Green Line/Row on the Screen below, this shows the ‘Net cash from operations’ for the years 2012 to 2017 (you can get more on SharePad by clicking the ‘Prev’ Arrow in the Top Right Hand Corner but I chose these Years because it means a nice size of text for Readers to see). I have also charted this on the right in the Blue Bar Graph. It is good to see this rising over time. 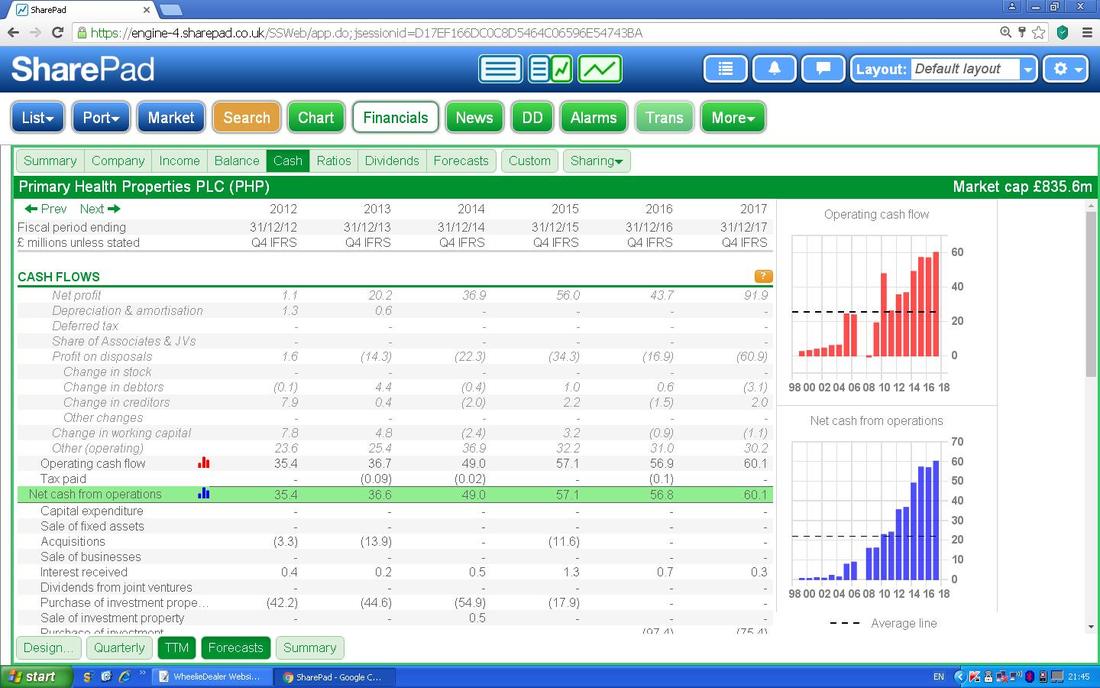
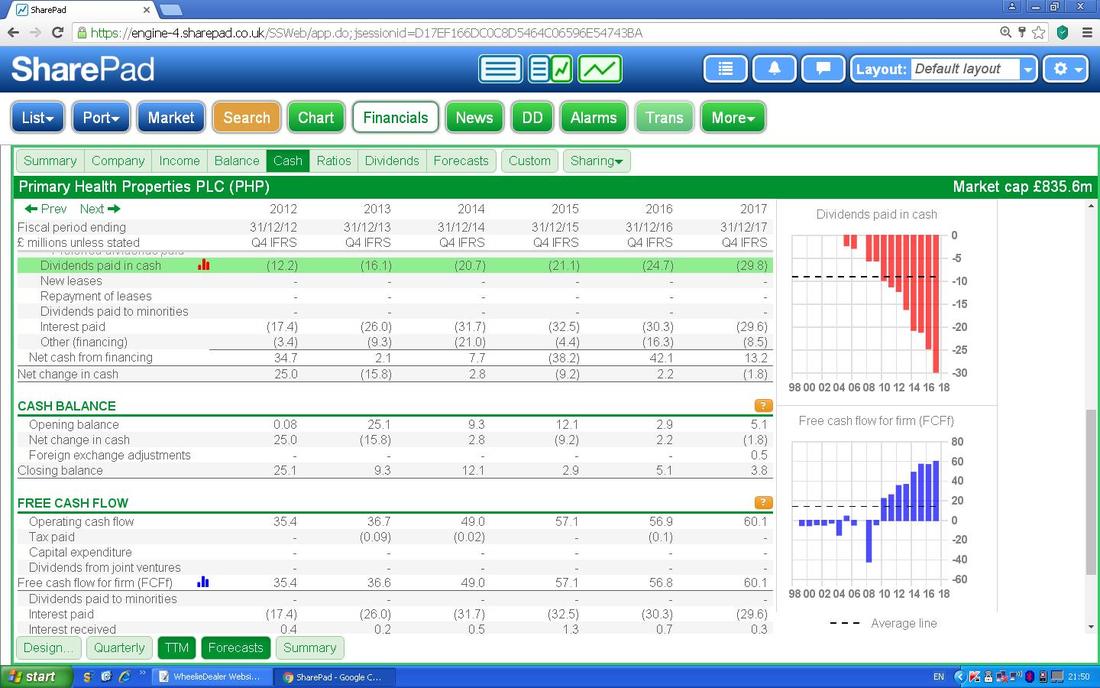
I’m gonna show the next Screen twice in effect but change the Row I highlight so that Readers can figure out what I am droning on about. In the first Screen I have highlighted in Green the ‘Dividends paid in cash’ and this is Graphed in Red on the Right Hand Side.
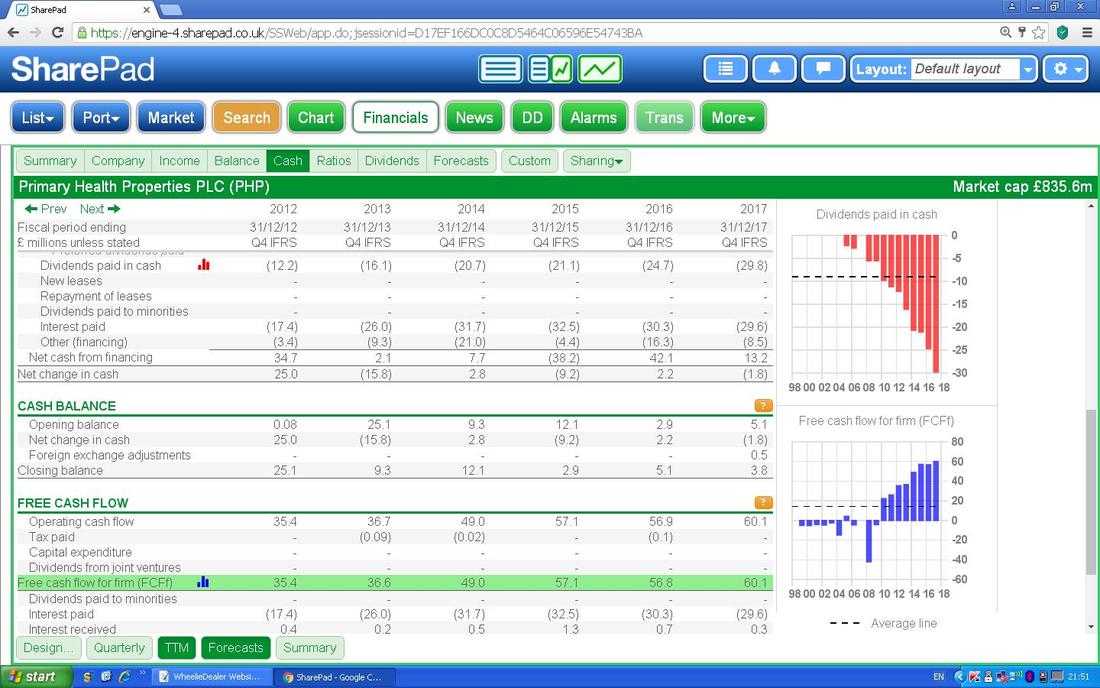
In the next iteration I have highlighted in Green the ‘Free cash flow for firm (FCFf)’ and graphed that in Blue on the Right. You should be able to see that the Free Cashflow is nicely higher than the total amounts paid out as Dividends - so that is sweet.
Targets
This is a difficult section to write. For me personally I am really interested in holding a Stock within my Income Portfolio which I can just sit on and perhaps buy more of over time and I could easily be holding this Stock in another 10 years time maybe. With such a likely future for myself regarding PHP, a Target Share Price as such is not particularly relevant and what I am more ‘Targeting’ if anything is a nice Dividend Yield to start off with around 4.8% or so and I expect that to steadily rise over time and to drive the Share Price up with it. If I had to put my hat on a Target Price, I would think that 150p will come up in a few years and ultimately it could go a lot higher. What I am really focused on is that growing Dividend Stream and how PHP fits with the other Stocks in my Income Portfolio and the defensive nature it brings to the Portfolio Party. This aspect of ‘Fit’ in a Portfolio is something that I think many Investors overlook - no problem in a Bull Market but you wait until that Bear Pack properly returns for a feasting…. Premium to NAV This issue was raised on Twitter the other day and I gave a quick response but I reckon it justifies a Section in the Blog all on its own because it is a highly relevant consideration. At the time of writing this Blog PHP is trading on a Premium to Net Asset Value (NAV) of about 20.3%. With a Property Business like PHP, the NAV is the Value of all the Properties they own at a point in time (I think this is calculated by Independent Valuers that the Company gets to assess the value from time to time) plus any other Assets such as Cash they might have and with any Debt and any other Liabilities subtracted from that Asset Value - to give a ‘Net’ Asset Value. In normal circumstances a Property Stock will trade at a Discount to NAV because in the event that the Company was to cease Trading, then the Assets (the Properties) would be sold off to whoever offers the Best Prices and in this circumstance there is no doubt that the Properties would not fetch their full Market Value and the Buyers would be trying to get them ‘on the cheap’. In effect it would probably be a ‘Fire-Sale’ and often this is done at an Auction which of course tends to attract Buyers who don’t want to pay Top Money. So PHP is quite different in that it is on a Premium to NAV but not only that, it is on a very High Premium. This in itself brings an amount of Risk to my PHP Buy because it is very possible that the Premium falls over time and the Share Price will therefore probably drop as well. If the Value of the Property Assets increases, then it is possible that over time the Premium is reduced although the Share Price might stand still pretty much. Of course, what I hope will happen is that the Value of the Properties will increase in the next few Years and this will mean that what is a Premium to NAV at my recent Buy Price will actually become a Discount over time - it might take a few Years although as I mentioned in the ‘Valuation’ bits above, the NAV is forecasted to rise pretty quickly. However, PHP has been rather unusual for many Years now and certainly in the time that I have been aware of this Stock it has always been on quite a large Premium to NAV - it is probably the case that Buyers are attracted to the pretty big Dividend Yield (near 5% at my Buy Price) and the perceived reliability of the Rental Payments which are backed by the Government and the Inflation-linked aspect which applies to most of the Rental Streams. This gives the Dividend Yield quite a high degree of certainty. But of course life is never that simple and in reality PHP could fall a lot if the Premium were to evaporate and the Net Asset Value was to stay the same or, worse case, to fall. In this event I am pretty relaxed because it is my Plan that PHP will be very much a truly Long Term (Forever !!) Hold in my Income Portfolio and if the Price falls then the Dividend Yield will most likely rise (unless there is a Cut to the Dividend but that would be very unexpected) and it would enable me to Buy more at an advantageous Price and to capture more of the Ongoing Dividend Stream into the future. The kind of circumstances that would cause the Premium to reduce and for the Asset Value of the Properties to fall would be if that Loon Jeremy Corbyn ever got near No. 10, although I suspect even his crazy Far Left Fringe would find it difficult to Re-Nationalise everything that has any connection to the Public Sector (that probably wouldn’t stop him trying though !!). Thankfully such a possibility is reducing over time as Corbyn’s Approval Ratings collapse and the ‘Yoof’ fascination with him is moving on to the next fashionable cause (as was demonstrated by the lack of Ticket Buyers at the recent ‘Jezfest’). The Management of PHP have built a good reputation of steady growth and ensuring the Dividend has grown over time. If there was to be a change at the Top then perhaps that would worry the Market and cause the Premium to drop. In such an event, I would have to assess the situation and it would probably not be until I had clarity on who would be the new Management Team and got a view of their Capabilities that I would want to buy more. I would most likely let a New Team settle in and prove their mettle for a few Years before buying more. Anyway, another critical consideration is that when you look at the Forward NAV as I highlighted in the ‘Valuation’ Section above, PHP is actually trading on a Discount to NAV of 3.4% at the end of 2018 and by the end of 2019 it is expected to be on an even larger Discount. So it is not such a huge worry after all if the Forecast Valuations turn out to be anything near accurate. Of course, as with all Forecasts there has to be an element of doubt around this. Technical Picture I’m still trying to get more used to SharePad and my skills with its Charting capabilities are pretty limited (my Brain is conditioned to using ShareScope I think and the Charts on SharePad seem more basic but for Long Term Investors I think they provide what is required), but I will try and navigate it in a way that makes sense to Readers. First off we have the ‘Big Picture’ with the full history of PHP and as you should be able to see there is a decent Long Term Uptrend Line which I have pointed at with the Arrow that has a Black surround at the bottom (I have no idea how you ‘fill’ the Arrow - I am not sure this can be done). Higher up we have a Long Term Downtrend Line which clearly the Share Price needs to Breakout over if PHP is going to make a big move to the Upside. There is a squeeze going on though where the Price is moving towards the ‘Point’ of the Triangle between the two Lines. This Upper Line is marked by my Arrow with the Red surround. 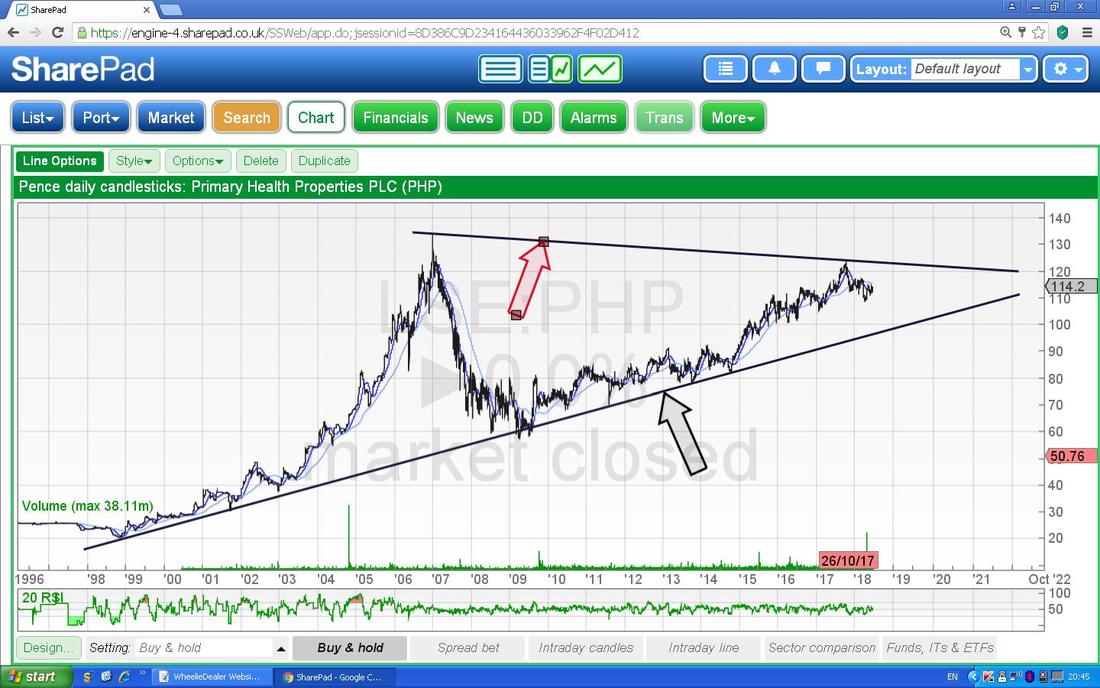
On the Chart below I have reduced the Timeframe to the last 2.5 Years or so and the things to note here are firstly the Longer Term Uptrend Channel which I have marked using the Red Lines and then from about October 2017 there is a Downtrend Channel which I have marked with the Green Lines. We are currently within that Downtrend Channel really and I would say a move up over 115p would be a Bullish Event and show that we had escaped the Downtrend Channel and had got over significant near-term Resistance at 115p. My Arrow points at this Level.
After that, 120p looks a difficult Level to get over and then 123p - if it can crack the latter, then this would be a Breakout of the Long Term Downtrend Line and that is Bullish behaviour. The other thing to look at are those Blue Wavy Lines. The Darker Blue Wavy Line is the 50 Day Moving Average and the Lighter Blue Wavy Line is the 200 Day Moving Average. What I am looking for is the 50 Day MA to Crossover the 200 Day MA from underneath and it looks like that might happen soon as the Darker Blue Wavy 50 Day MA Line has started to turn up. Of course we are too early to be sure it will Cross but if we do get such a Cross, then that is a ‘Golden Cross’ and very Bullish for PHP for usually Weeks and Months to come. To the Downside the 108p Level is very important Support - I have marked this using my Mouse and that Red Text Box on the Right Hand Side should show the 108p Level and this is obviously derived from the Price Congestion around 108p from April this year. 110p also looks am important Support Level. 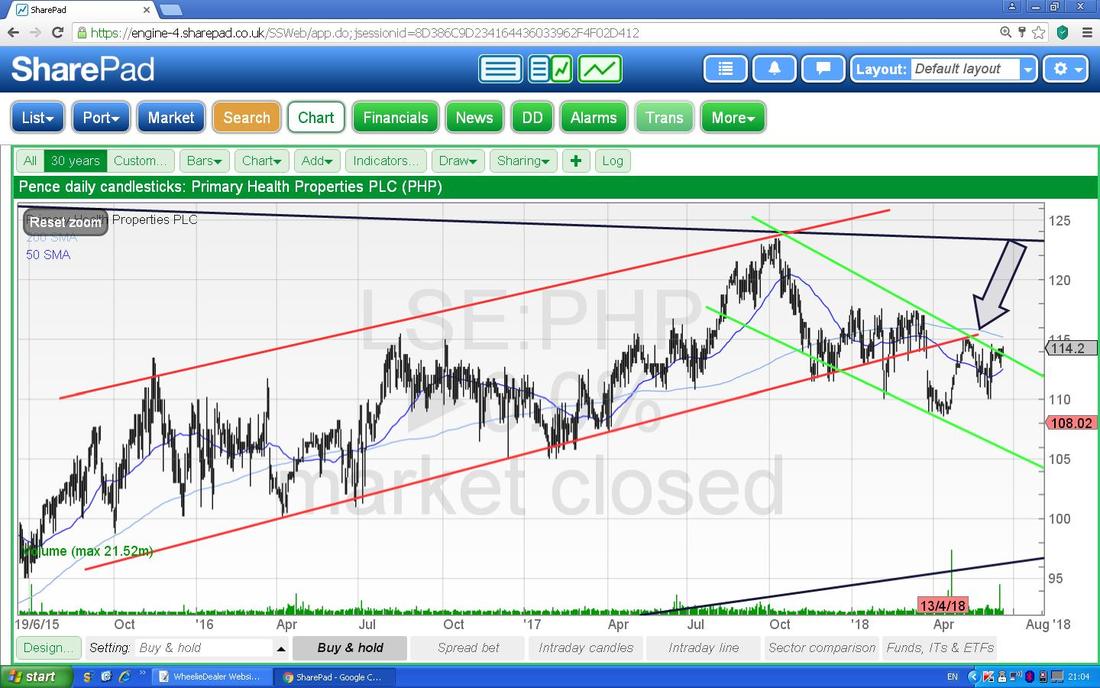
Conclusion
A big part of the appeal for me of PHP is the way it fits in with the other Stocks in my Income Portfolio. Not only do I expect PHP to provide slowly rising Dividends over time, I also think it is a very Defensive Stock and when combined with the other 11 Stocks currently in my Income Portfolio, I think it will help the Diversification in a very positive way which will be particularly valuable when Markets get rocky. As I explained in the ‘Premium to NAV’ Section above, PHP is currently on a pretty high Premium but very soon it looks like this will fall hugely and PHP will probably soon be on a Discount to NAV. Of course in practice the Share Price will probably rise and this means it will still trade at a Premium to NAV although for Buyers around now they will in effect be getting a nice Discount to the future value. I mentioned earlier that the Forecast Growth in the NAV seems quite high but upon reflection in recent Days I think it is possible and I am prepared to believe it - remember, Analysts do not work in a vacuum and they are usually very well guided by Management and of course the Bosses at PHP have a very good Track Record of Delivery. PHP certainly ticks my boxes on the Dividend Yield that I am getting from the Start and I expect that to slowly grow each Year and keep pumping a steady flow of Dividend Cash into my iWeb Account where the Income Portfolio sits. I fully expect to be buying more PHP over time as the Portfolio grows as I will want to keep the Proportion of the Portfolio in PHP at a fairly constant level over time. There is no doubt that PHP has a very good record of Delivery since it floated many years ago and it seems to be pretty well managed with the right Strategy to keep adding Healthcare Centres where the Value Case stacks up and the expansion into Ireland makes perfect sense. As with anything there are various Risks as I highlighted in Part 1 of these Blogs but in many ways I think this is one of the lowest Risks Stocks it is possible to hold. And finally……I have taken the ScreenShot below from the PHP Website underneath the ‘Investors’ Menu where it says ‘Investment case’ - I thought it sums things up well: Cheers, WD. 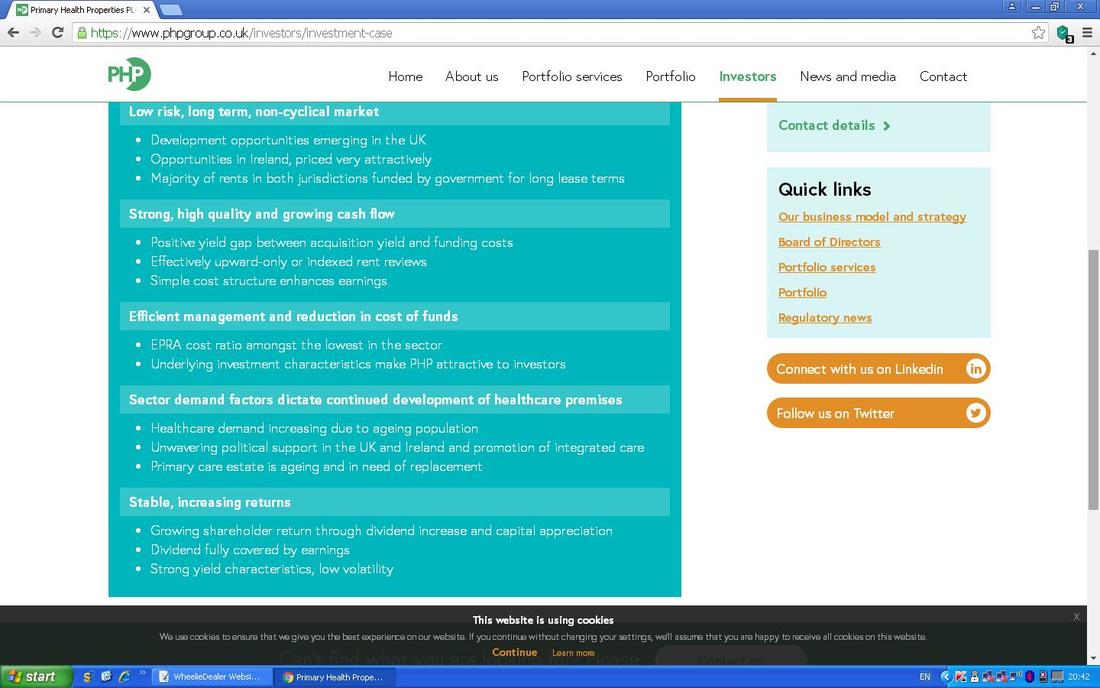
3 Comments
dave royle
20/6/2018 11:49:10 pm
Hi Pete, Nice report mate. Edison have far more conservative EPRA NAV's than the ones you are using-
WheelieDealer
22/6/2018 10:11:19 pm
Hi Dave, thanks for the comments and I'm glad you liked the Report. As you say those Edison NAV Forecasts are lower and this is slightly puzzling - I'm wondering if the figures in SharePad are not using EPRA but it is unclear to me what effect that has (the Edison Note talks about value of Adjustments "for fair value of derivative interest rate contracts and convertible bond" but I am not really sure what this means or of its relevance).
dave royle
23/6/2018 12:49:16 pm
Thanks Pete. As you know I fully agree about the sector and would be very happy to invest in PHP if the sp falls more in line with NAV. I would also like it if they issued more long term bonds, say 10-20 years, to try to make sure they don't get hit by higher rates a few years down the road. Leave a Reply. |
'Educational' WheelieBlogsWelcome to my Educational Blog Page - I have another 'Stocks & Markets' Blog Page which you can access via a Button on the top of the Homepage. Archives
May 2024
Categories
All
Please see the Full Range of Book Ideas in Wheelie's Bookshop.
|
