

|
educational blogs |
|
It feels like an unusual situation for me after fighting the Markets for most of the last year and getting my butt kicked - but finally I have removed all Index Shorts and I am fully Long on the Markets. In the very short term we might get some wiggles but I see the recent Breakout to All Time Highs on the US Major Indexes as extremely Bullish Price behaviour and the FTSE100 looks to me like it has Broken out and then eased back a bit to do a ‘confirmation’ before most likely starting to move up again - I will demonstrate all this on the Charts in due course.
Needless to say with all the troubles of the World this strength in Markets seems utterly daft but if we take a calm view of things from a high level the simple crux of the matter seems to be that Interest Rates are still extremely low around the Globe and Economic Growth looks decent, if not stunning, across all Western Economies and Trump’s Policies look likely to give the US Economy a boost - and this is the dominant World Economy.
Having said that something new has appeared which makes me think we could be in for some challenges down the line - this is around Trump’s Policy to destroy ISIS and he has asked his Generals to come up with a Plan on how to achieve this over the next 120 Days. Funnily enough this coincides with the ‘Temporary Ban’ on People from certain Middle Eastern Countries and I can’t help coming to the conclusion that these 2 events are linked - if the US is going to take on ISIS seriously then it seems most likely that ISIS will want to carry out Terrorist Attacks in the US and Europe - if US is closed off, then Europe will get the brunt of it. Not good.
Proper Wars have strange impacts on the Markets - if this gets to be a full-blown Invasion type of thing, then it really could cause Markets to fall beforehand but once the Fighting actually starts, the Markets rally. I think it was John Templeton who did the famous saying “Buy when there is blood on the streets”. Of course any such action will probably be very supportive of Defence Stocks and I hold BAE Systems BA. which could have more upside if things kick-off and it would most likely rise in advance. Anyway, it is just another Macro Risk we need to monitor but of course if we do see more Terror in Europe, then this will put more pressure on the EU to scrap Freedom of Movement etc., and of course it will lead to more support for Far Right Parties - most of which dislike the EU. Share-Talk Investor Evening in Cardiff My mate @conkers3 on Twitter is arranging an Investor Evening which takes place in Cardiff on Saturday 18th February and has Fund Manager Gervais Williams doing a talk and Chris Bailey of Financial Orbit who is worth listening to. I quite like listening to Fund Managers because they often mention particular Companies they like and why they are attractive and this is often a good route to new Ideas. Anyway, the Event is FREE to attend and if you live in that vicinity it might be worth the trip. You can register here: https://www.eventbrite.co.uk/e/share-talk-investors-evening-with-gervais-williams-eg-solutions-widecells-tickets-30351580394 Guest Blogs Last week I shoved a Guest Blog from Phil Sloan covering P2P Lending up on the Website; the response has been really positive and it is clear that such stuff is highly appreciated by Readers. I was thinking about this the other night and it struck me a Guest Blog from someone who is quite new to Investing/Trading would be really interesting for a lot of less experienced Readers and maybe the sheer act of writing such a Blog would be very useful for the Author. Anyway, if there is anyone out there who fancies producing something along these lines then please get in touch. I was thinking that it doesn’t need to be hugely long or particularly amazingly written - I am pretty used to Editing stuff and can tart it up if need be. Perhaps just a simple Bullet List of the main Lessons that have been learnt would be all that is needed. There is no rush and it is something that could be produced over weeks if need be. Wider than that, if anyone out there has ideas for something they would like to scribble and fancies trying their hand then it would be great to hear from you. Maybe you have been thinking of starting a website yourself but are not sure if you can do it or what it really involves - this could be an opportunity to try something out without getting yourself too committed to anything at this stage. Topics could cover anything really as long as it is relevant to Investing/Trading - if you’re not sure then float your ideas past me and I can perhaps give some pointers on the direction to go. Obviously if you have a Stock you think is particularly attractive then that would be a good subject for a Guest Blog. Changes List This is just a short paragraph reminding, or in some cases pointing out, the existence of the ‘Changes List’ on the Homepage of the Website. I suggest that whenever you visit it is best to look at this list first because it is an ever-changing List of stuff I have changed on the Website and what Trades I have been doing and suchlike. Technical View Some Readers may not have noticed but after doing the Charts on a Sunday (or sometimes Saturday) Night I tend to do a brief update in text format of how the Indexes, Oil, Gold, Quid etc. have changed after each Day’s Trading during the Week - these tend to be at the top of the ‘M3 Manifesto’ page. In an ideal world I would do these as Charts but it just takes too long and I can bash the text out quite quickly. If you tie the words in with the Charts from the Blogs then it should make a smidgeon of sense. Onto the Piccies……… Dow Jones Industrials Index This is exactly what I was referring to earlier on the Bullishness of the US Indexes. The Chart below (from the truly brill ShareScope software that I use) shows the Daily Candles for the DOW going back about 5 months. The key thing here is how the Price wiggled around in a Tight Range between about 19678 and the psychologically important 20000 level. My Green Arrow is pointing out how we got the Breakout on Wednesday 25th January and this is very bullish behaviour. It wouldn’t surprise me if we have a Pullback down to the 20000 level again in coming Days but if that does happen I expect it will then start moving up as ‘Former Resistance becomes Support’. 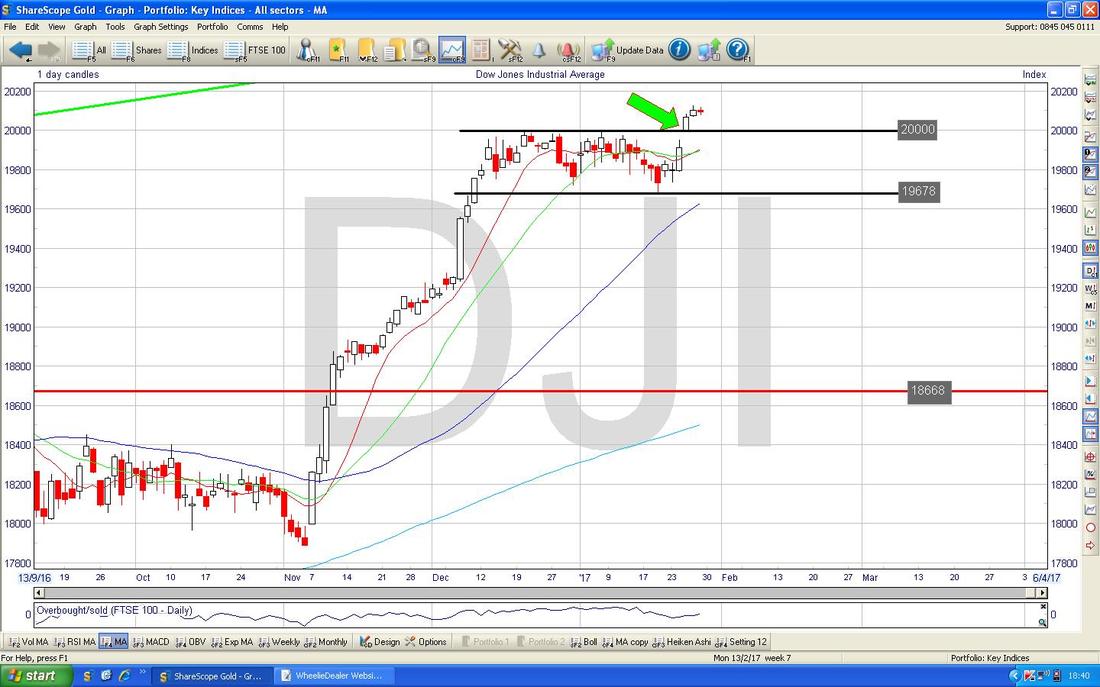
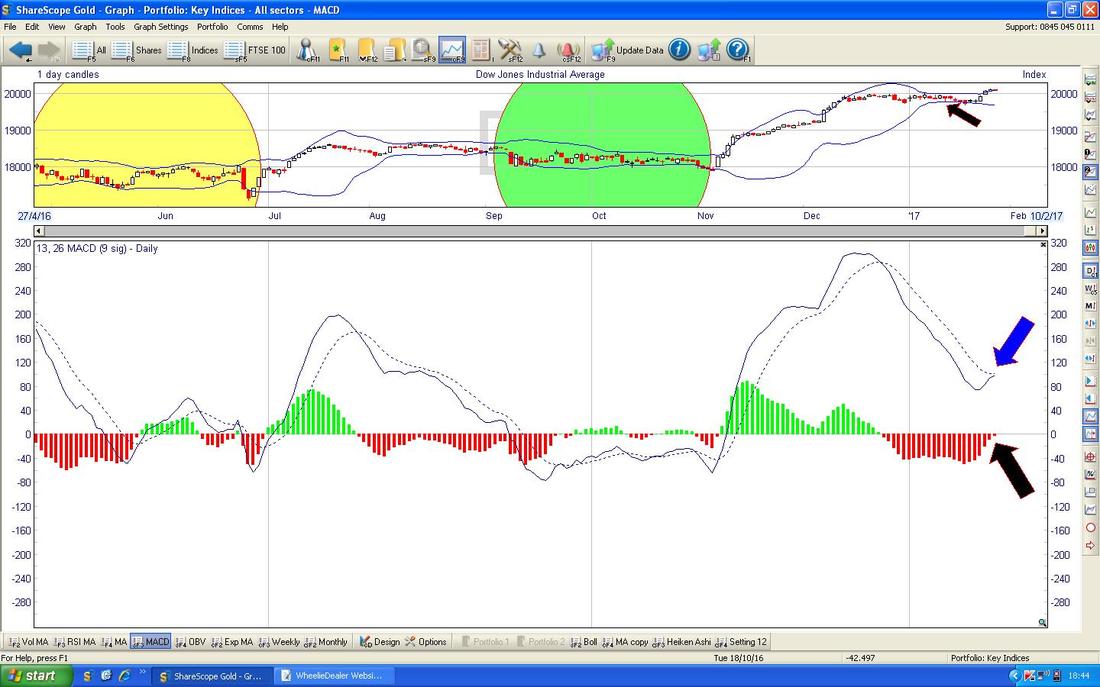
In the bottom window on the Screen below we have the Daily MACD (Moving Average Converge Divergence) for the DOW - please ignore the upper window. My Blue Arrow is pointing out how we are on the verge of a Bullish MACD Cross on the Signal Lines and my Black Arrow is pointing out the same phenomenon via the Histogram Bars.
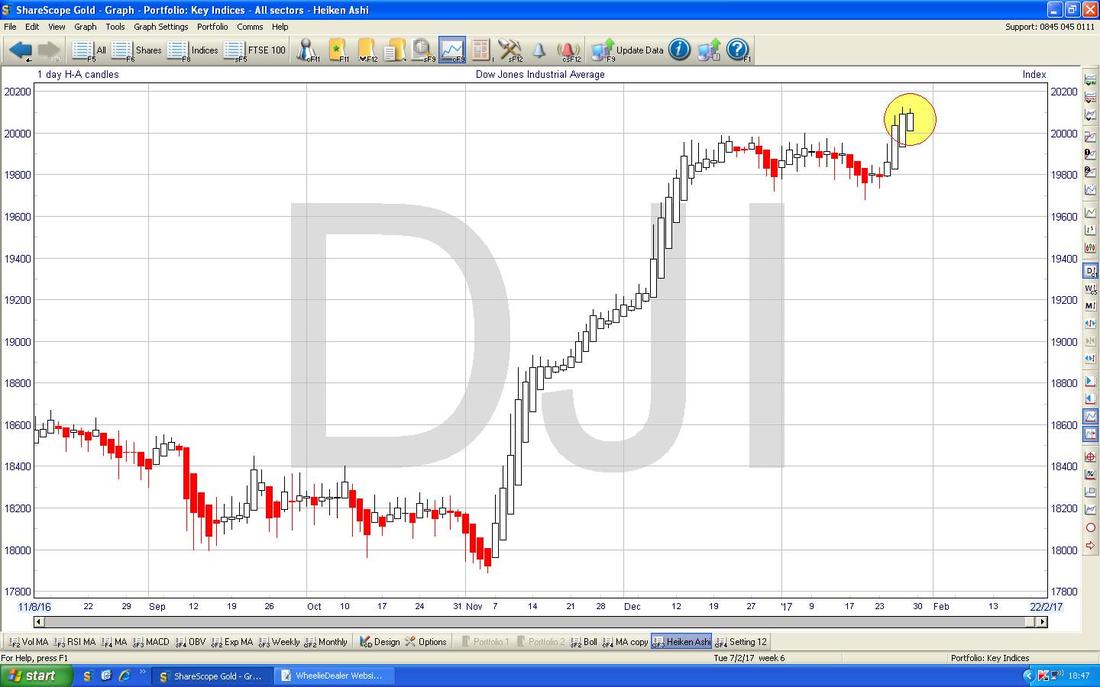
The Screen below has the Heiken Ashi Candlesticks for the DOW Daily - my Yellow Circle is pointing out how we have nice White Up Bars and they look pretty Bullish.
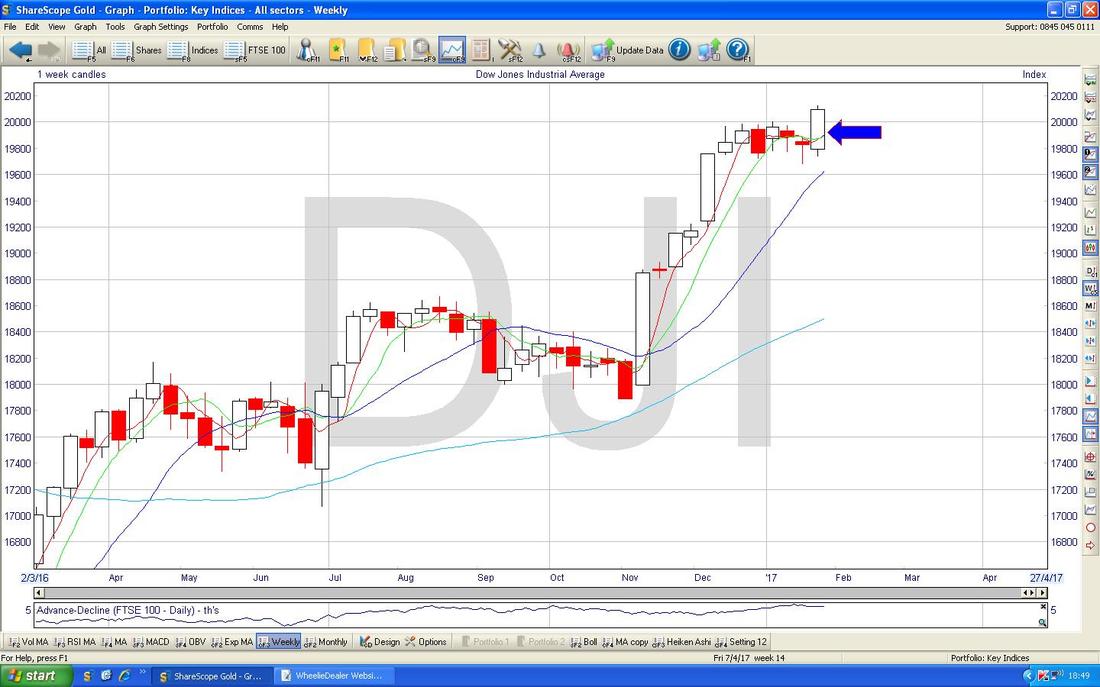
The Candles below are of the Weekly variety for the DOW - my Blue Arrow is pointing to a nice big Up Candle and this looks pretty bullish. The context is quite sweet as the DOW had pulled back for a couple of Weeks and then turned up nicely.
S&P500
Due to the Bullishness of the US Markets I wanted to go Long with a Spreadbet on one of them and I chose the S&P500 because with the DOW only having 30 huge Megacap Stocks I thought it might be a bit choppy in comparison - it probably won’t make a huge difference as they are quite closely correlated. The Chart below has the Daily Candles and you should be able to see that it is very similar to the DOW Chart I showed earlier and my Red Arrow is pointing to the Breakout. 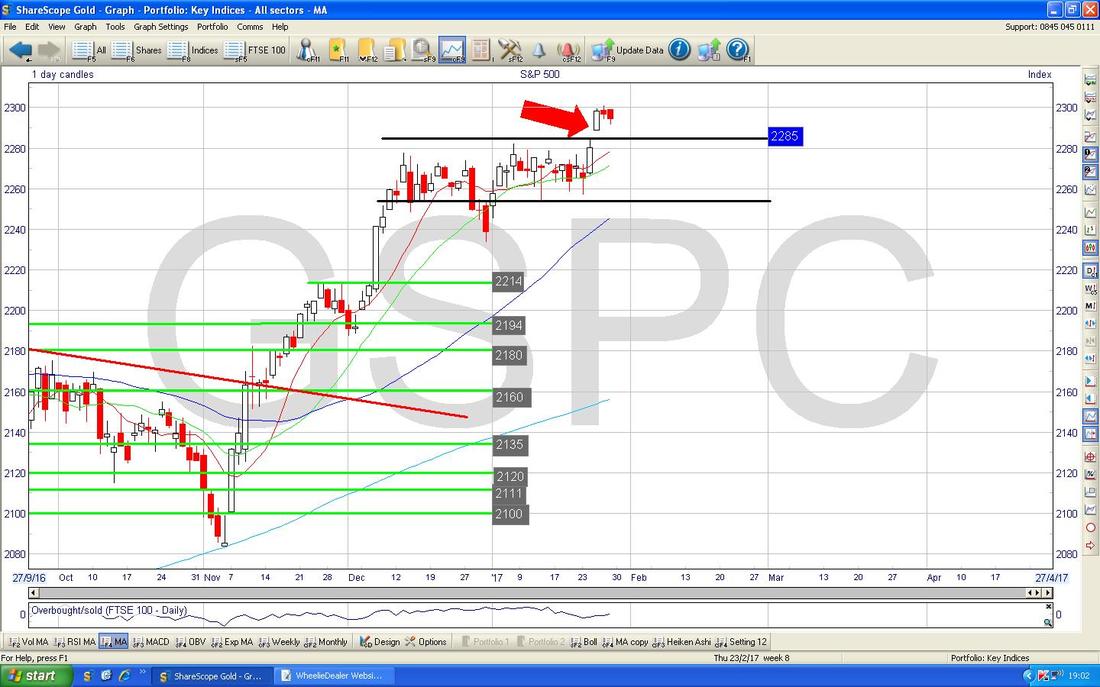
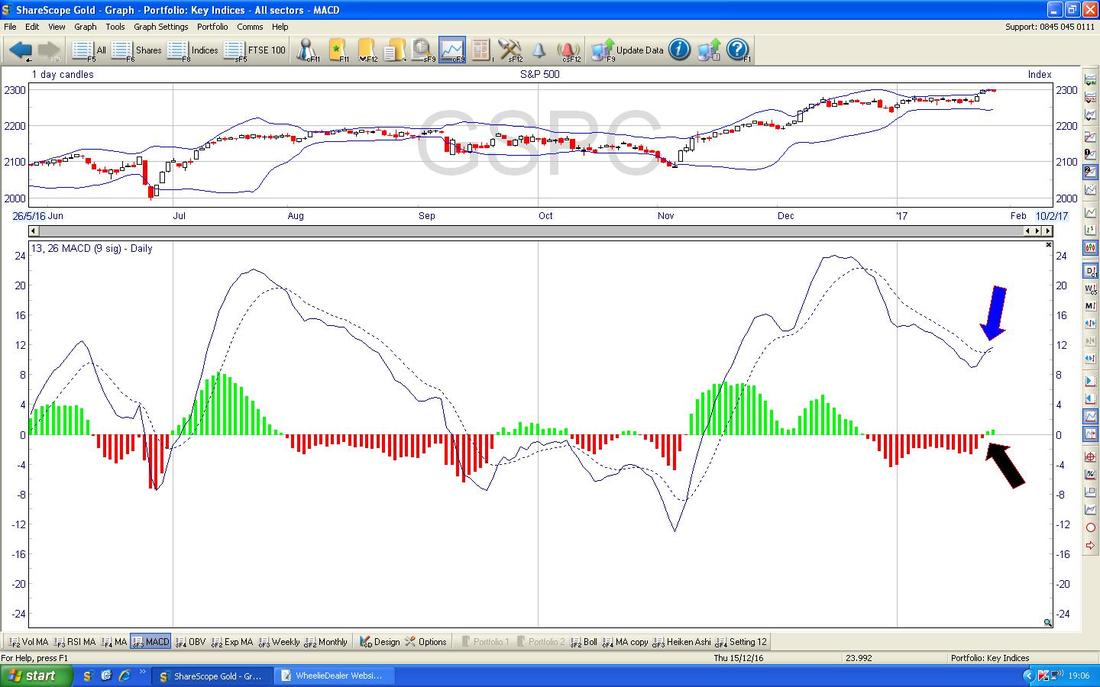
As with the DOW, the Chart below shows the Daily MACD and my Arrows are pointing to where we have had Bullish Crosses already.
FTSE100
I removed all my remaining FTSE100 Short Positions on Friday Night - I will show why I made this decision in the Charts to come, but obviously the strength of the US Markets was also a factor. The Chart below has the Daily Candles for the FTSE100 going back about 6 months. First off look at my Black Arrow which shows the 7130 Level which was the previous All Time High which was broken over in the final Days of 2016. By usual Charting Textbook Rules, ‘former Resistance should become Support’ so we have a good example of that going on here. My Green Arrow is pointing out how we got a decent Up Day on Friday and clearly the FTSE100 is finding Support at 7130 for the time being. My Red Arrow is pointing to the Red Line which is the Bottom Line of the Uptrend Channel which has been running since the 2009 Lows - it is significant that the FTSE100 stays above this Level and again it looks like ‘Former Resistance becomes Support’ and the FTSE100 has pulled back in recent Days to test that principle on the Red Line. 7206 is the immediate level to get over and maybe I could have waited to remove my Shorts after this level gets taken out - however, I felt there was enough to go on so I closed the Shorts before this happened. Further up, there is now Resistance at the New All Time High at 7354. 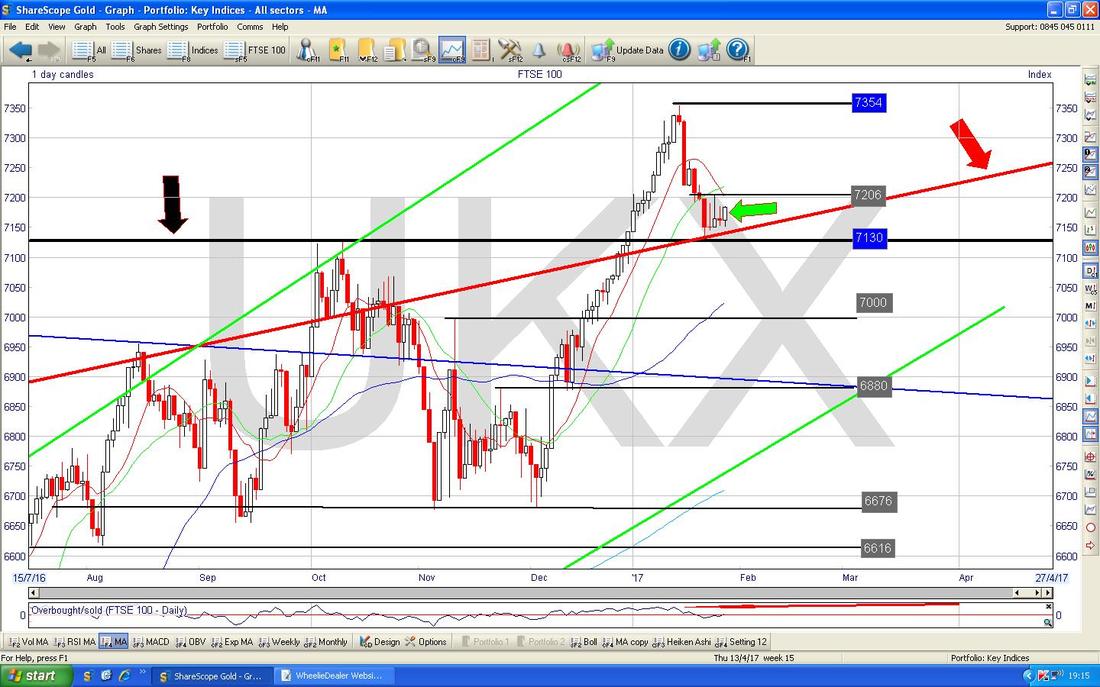
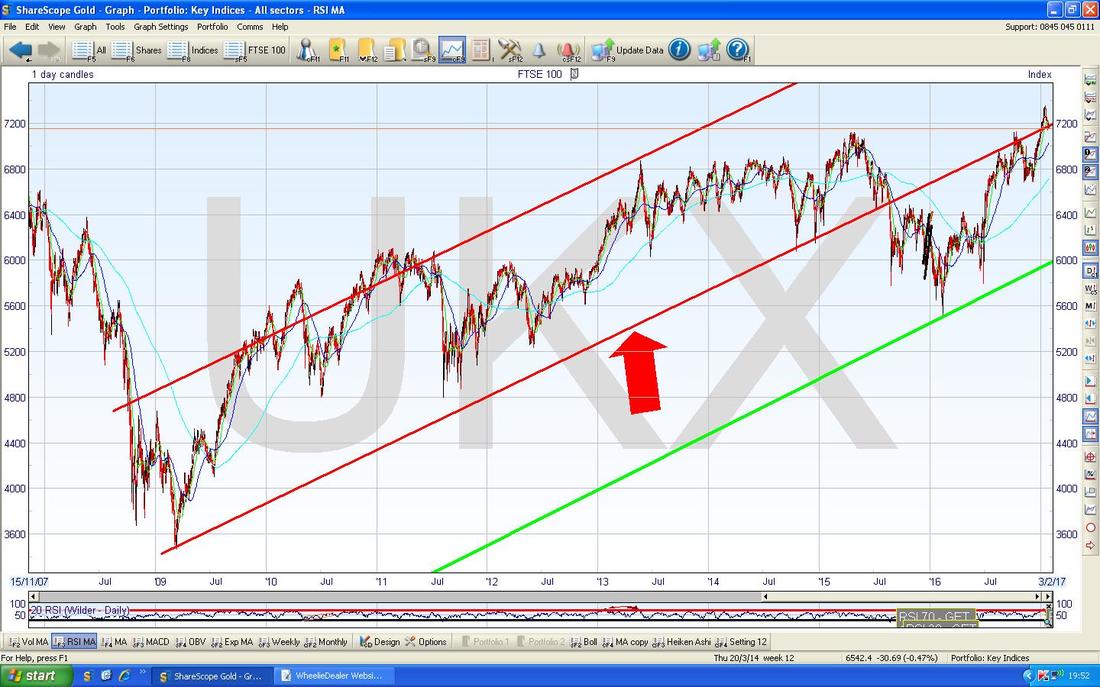
Just to clarify that last bit - here is the Chart for the FTSE100 going back to 2009. My Red Arrow is pointing to the Bottom Line of the Uptrend Channel with its Top Line also in Red higher up. The Price fell out of this Uptrend Channel back in 2015 but has recently got back inside the Channel and must stay above that Bottom Red Line.
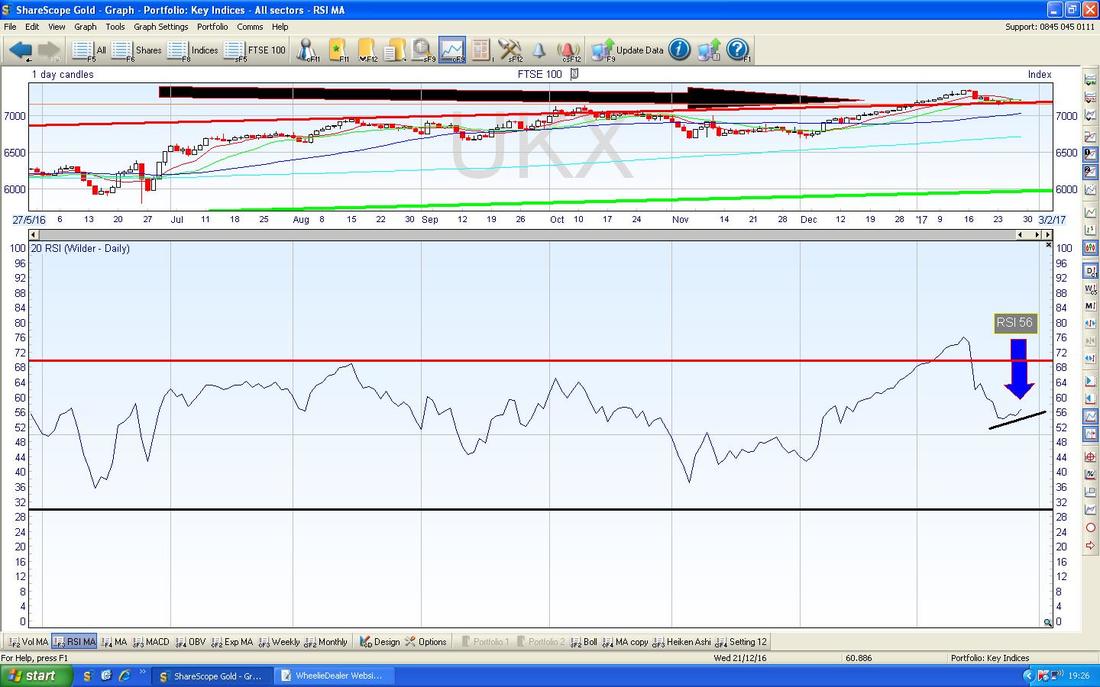
In the bottom window on the screen below we have the RSI (Relative Strength Index) for the FTSE100 Daily. With a reading of RSI 56 it has loads of room to go higher and note how it has just started to curve up in recent Days.
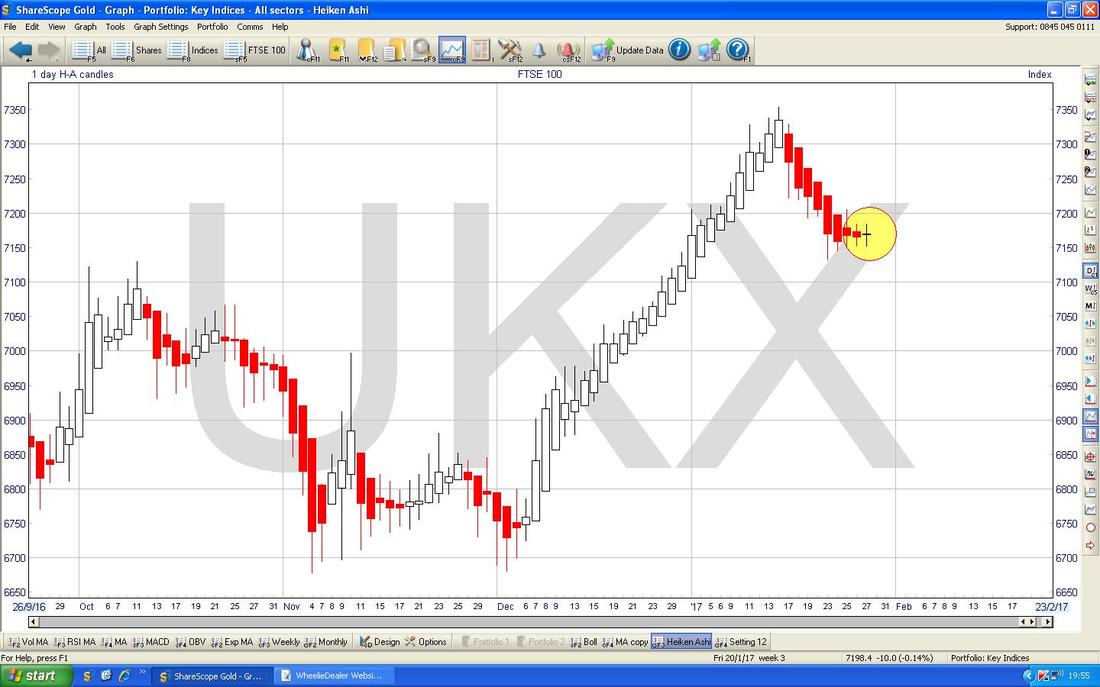
The Chart below has the Daily Heiken Ashi Candles - my Yellow Circle is highlighting how the Price has fallen with the Red Down Candles but now the Candles are starting to narrow and I have jumped the gun here because I reckon the probabilities are weighted towards the Price moving up again as it bounces off those Support Lines I talked about earlier. Note the HA Candles are a ‘slower’ Signal than some of the other stuff like the Normal Candlesticks - but the HAs do have a beautiful simplicity and clarity.
Pound vs. US Dollar
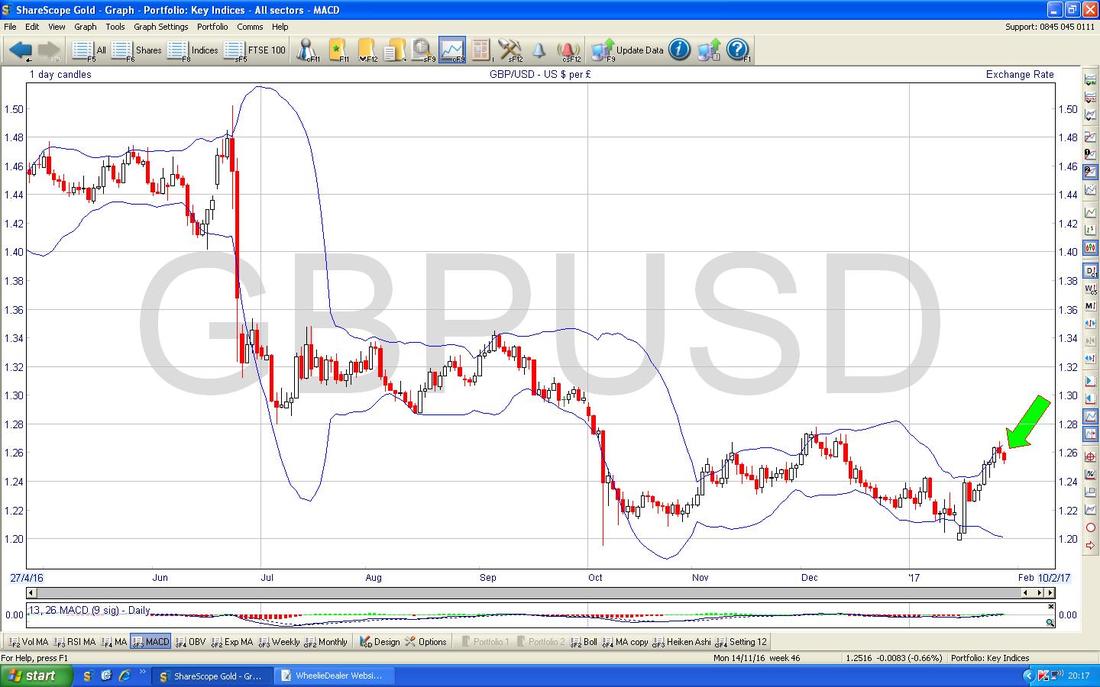
The Strength/Weakness of the Pound has a clear bearing on the FTSE100 and since the Brexit Vote the FTSE100 has moved inversely to the Pound - when the Pound goes up, the FTSE100 goes down and vice versa. On that basis part of my decision to close the Shorts on the FTSE100 was dependent upon what is happening with the Pound and it looks to me like the Pound will most likely drop back now after its recent rally and this should help the FTSE100 go up. My Chart below has the £ versus the $ Daily Candles going back about 6 Months. First thing to note is that at a High Level, we seem to have 2 Ranges going on - an Upper Range from about 1.28 to 1.35 and a Lower Range from about 1.1947 to 1.28. With recent strength in the £ I thought maybe we will see it get back into the Upper Range soon but I am now of the view that we are more likely to drop back again and this seems to be happening. My Green Arrow is pointing to a Red Down Candle which we got on Friday and this pivoted down off the sort of ‘Long Tails Doji’ from Thursday before. Note how we got over the 50 Day Moving Average Line which is marked by my Blue Arrow and you should also see my Red Arrow which marks the 200 Day Moving Average at around 1.31 which may act as Resistance if we get up into the Higher Range. 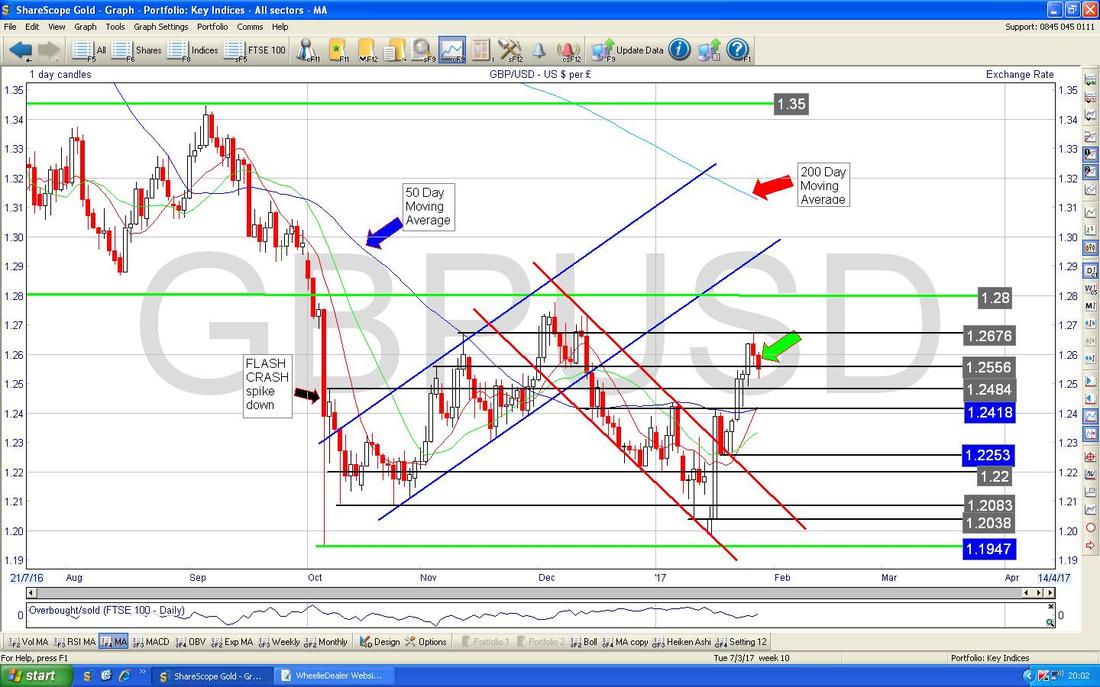
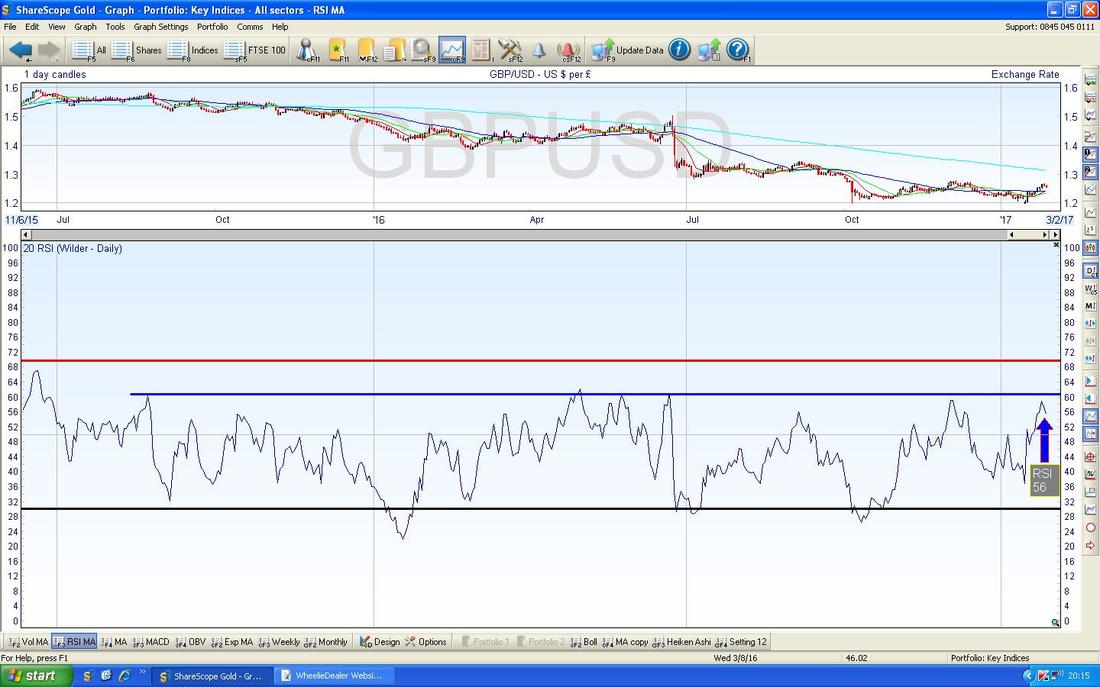
In the bottom window of the Screen below we have the RSI for £/$ - on a Reading of RSI 56 it looks like it has turned down and note my Blue Horizontal Line which shows that this is a Level where it has turned down from before in recent history.
The Chart below has the Daily Candles for £/$ with the Blue Wavy Bollinger Bands above and below. My Green Arrow is pointing to where the Price seems to have dropped from the Upper Bollie Band.
Brent Oil (Spot)
This stuff tends to impact the FTSE100 as well so it is of particular interest to me. The Chart below has the Daily Candles going back about 6 Months. It looks to me like the Price is stuck in a Range and going sideways at the moment - the Range is between about $54 and $57.535. The important thing now is really to wait for the Range to play out - if it breaks out of the top of the Range then the Price will most likely keep rising and if it breaks downwards then expect it to fall more. An Upside Breakout would need to be over that $58.375 Spike. My Black Arrow is pointing to a Down Candle from Friday and it seems likely we might ease back a bit in the very short term. It is also worth noting that both the 50 and the 200 Day Moving Averages are rising and this is Bullish. 
Gold (Spot)
This is quite interesting. Gold has been soggy for a few Days but on Friday we got a nice Dragonfly Doji kind of thing which I have marked on the Chart below with the Yellow Circle. In the context of a move down for several Days and then to get this Dragonfly, this suggests we might be able to turn up now. It was not great to fall below $1200 but maybe the Price can get quickly back up above it. Note also that the Reversal during the Day on Friday started not far above the 50 Day Moving Average which I have marked with my Blue Arrow - so it is possible that the 50 Day Moving Average is acting as Support. To the upside, $1220 is now a Key Resistance Level to get over. 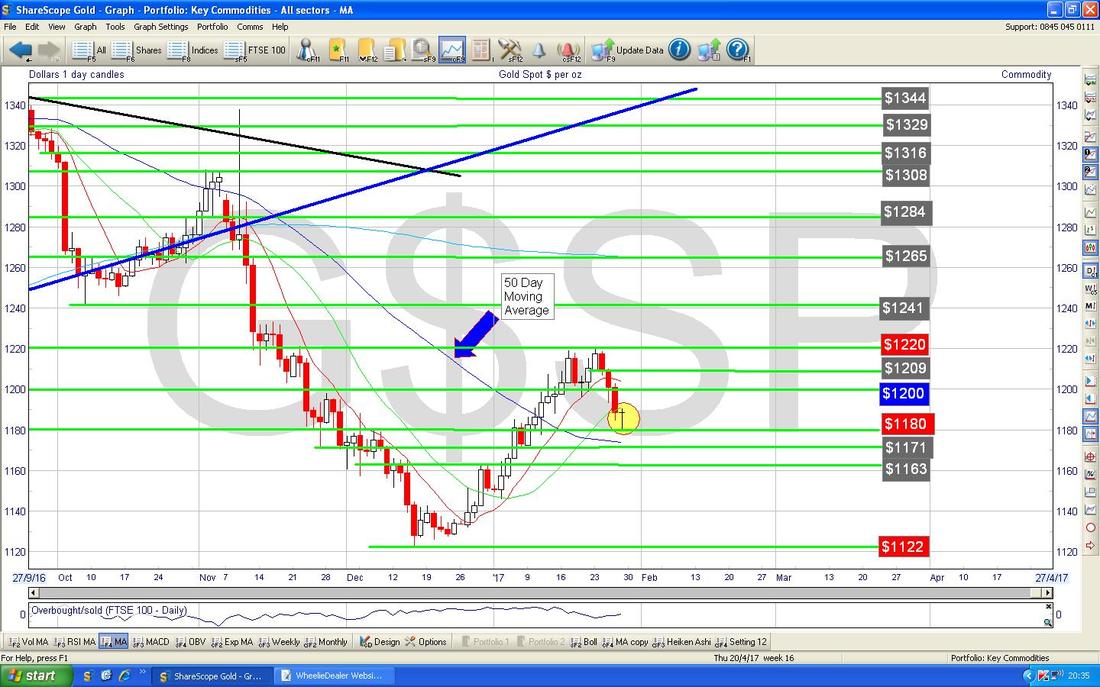
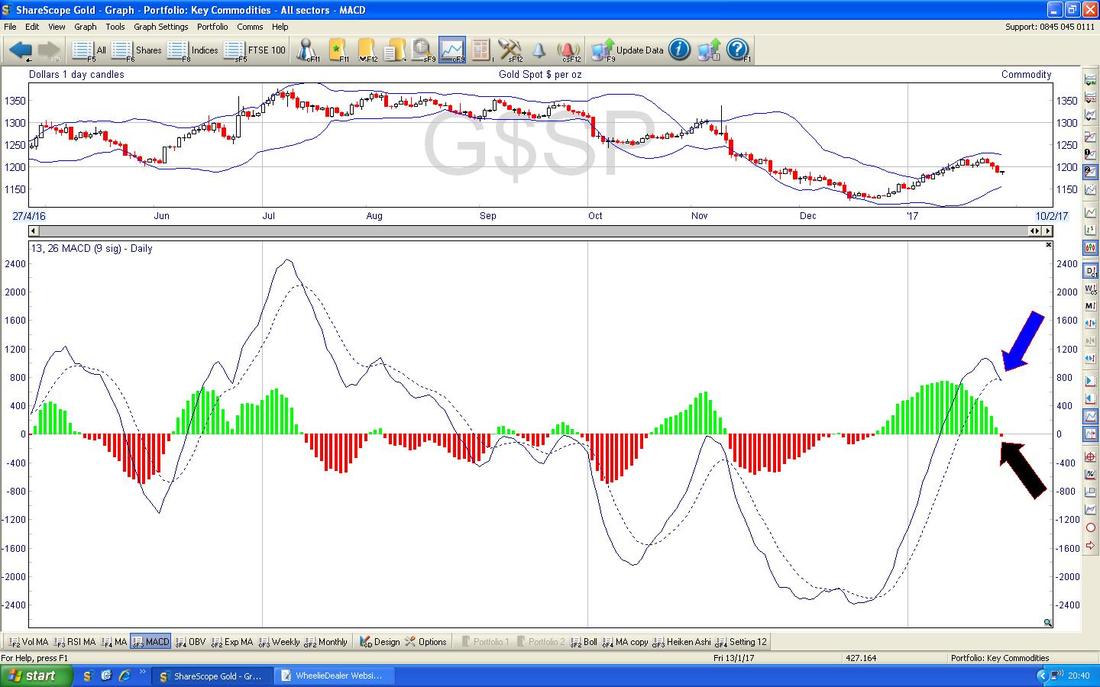
In the bottom window on the Screen below we have the MACD for Gold (Spot) Daily. My Blue Arrow and Black Arrow are showing the different forms of a Bearish MACD Cross - so this is not so good.
This is another less attractive picture. The Chart below has the Heiken Ashi Candles for Gold (Spot) - note my Yellow Circle which highlights a string of Big Red Down Candles and this looks pretty bearish.
OK, that’s it for this week, good luck for what lies ahead, Cheers, WD. 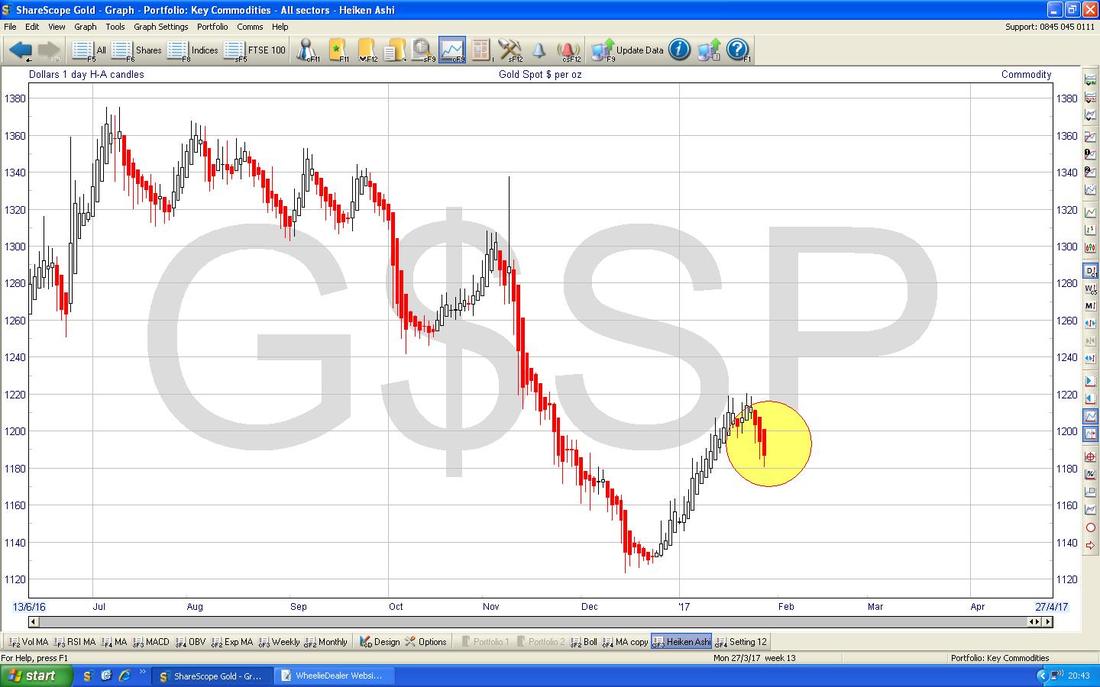
0 Comments
Leave a Reply. |
'Educational' WheelieBlogsWelcome to my Educational Blog Page - I have another 'Stocks & Markets' Blog Page which you can access via a Button on the top of the Homepage. Archives
May 2024
Categories
All
Please see the Full Range of Book Ideas in Wheelie's Bookshop.
|
