

|
educational blogs |
|
THIS IS NOT A TIP. I AM NOT A TIPSTER. PLEASE DO YOUR OWN RESEARCH. PLEASE READ THE DISCLAIMER ON THE HOME PAGE OF MY WEBSITES. I won’t make this a long winded effort as most Readers will have a pretty good idea what National Grid (NG.) is. You will probably know I am generally Bearish on the Markets at the moment and I am not in a Buying Mood overall - but I will nibble when I see good Value appear. I bought NG. for my Income Portfolio (full details and constituents of this Portfolio can be found on the ‘Trades / Portfolios’ page of this Website) as the around 5% Dividend and stability of the Business seems a nice ‘Steady Eddie’ to give some Bedrock for tough times. Long Term Portfolios need to be designed for all Weathers, not just for when everything is Sunny. The Stockmarket has felt a bit Solar Powered for ages…….. Fundamentals The key thing here is the Divvy. If you look at the ShareScope Numbers screenshot below, you will see the Divvy Yield is forecast to be 5.03%, 5.16% & 5.30% over the next 3 years, based on the Price at 853p. I paid 855p so this is close enough. In these days of low Yields, this seems fair enough for the Risks involved - mainly Political. The National Grid is one of the most important parts of Infrastructure in this country - the lights would literally go out if it were to have problems. Consequentially, as Politicians batter the Energy Companies that supply direct to Voters, they have been remarkably quiet on NG. It seems likely they realise the Risk of causing problems here. It is not Risk Free, but seems Low Risk anyway. For a bit more detail on this, head over to this great piece from JJIS (@compoundincome on Tweeterer) http://www.compoundincome.org/blog/get-a-47-index-linked-yield-and-help-keep-the-lights-on 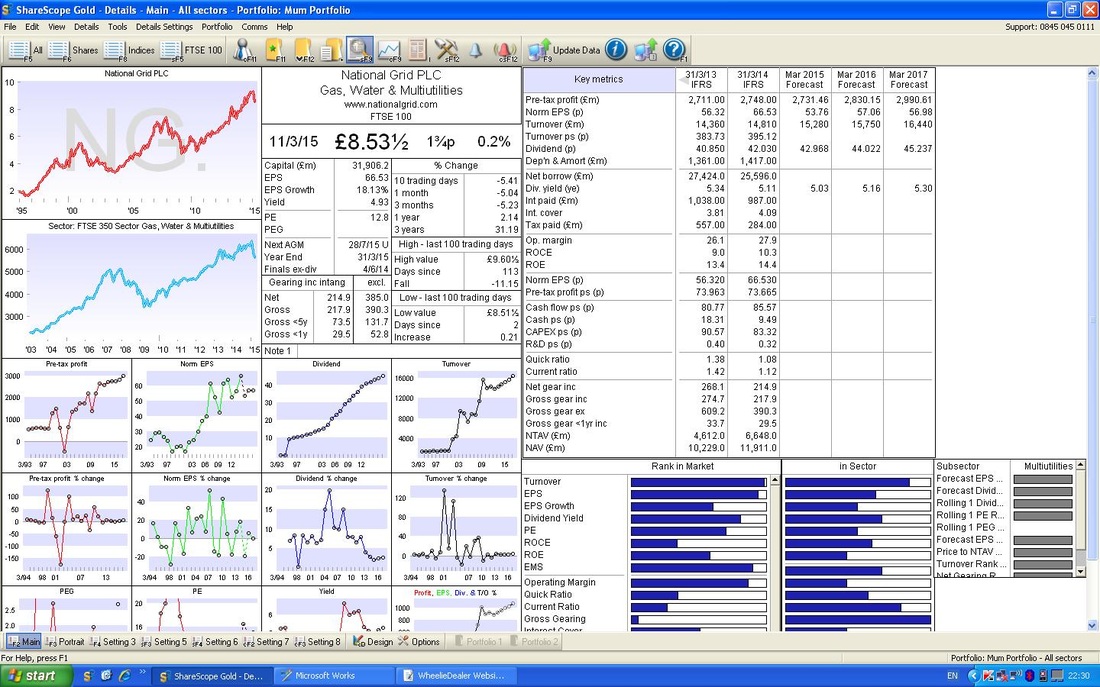
Technicals If you look at the Chart below, you will see a cracking Uptrend Channel - we are near the bottom, good time to buy I think. Don’t worry about the Blue line - this is the Sector Line. 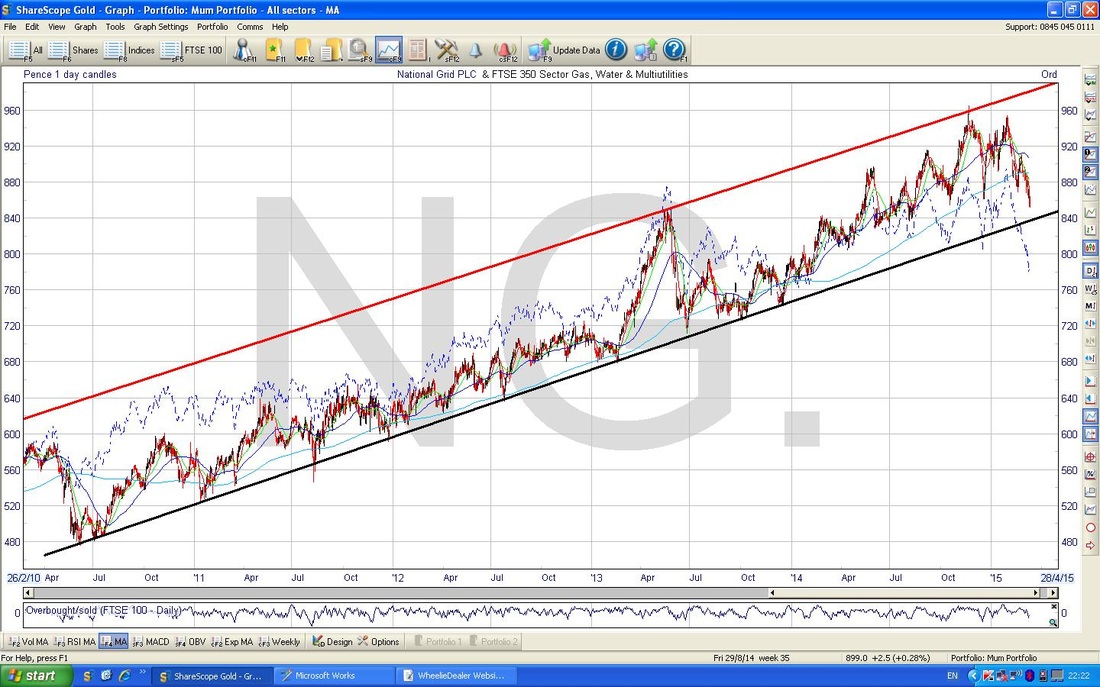
The Chart below zooms in a bit on the Daily Candles and shows a Short Term (I hope !!) Downtrend within the Long Term Uptrend Channel in the Chart above. Not sure why I put the Black Arrow on - these Charts are all Screenshots from last Wednesday Night when I looked at them and made my decision to Buy. My aim is to show you the conditions prevailing when I made my Buy Decision. I guess the point of the Black Arrow is that it marks the Downtrend Channel Resistance line that the Price needs to break out of for the Longer Term Uptrend to continue. In Textbook Trading terms, you would wait for this Downtrend Channel to be broken out of before buying. However, I am not doing Short Term Position Trading here - this is a Divvy play for my Long Term Income Portfolio - so I am less bothered about Perfect Timing. The Yield here is what counts, and I am happy to have Locked that in. The Blue Arrow points to an Inverted Hammer Candle - this is sign that the Downmove is coming to an end and will turn up soon - we shall see, although it looks promising. 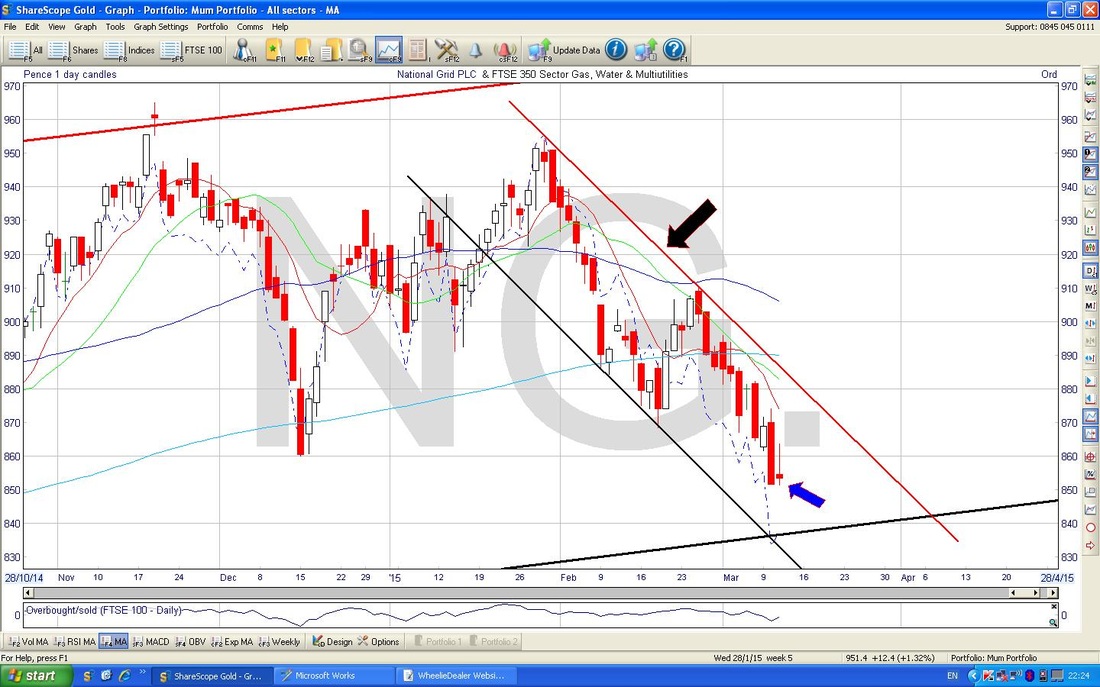
The Chart below in the Bottom Window shows the Momentum Indicator - as you can see, the Green Arrow points out that this is Low and a point where the Price usually Rallies from. 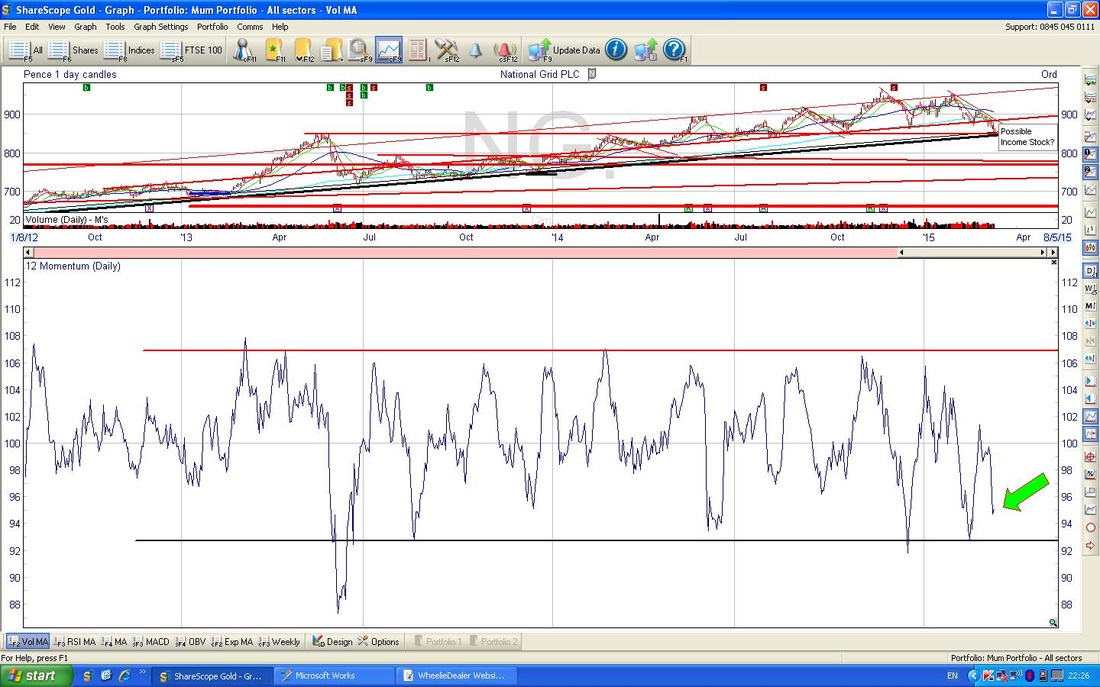
The Chart below in the bottom Window shows the Relative Strength Index (RSI) - as you can see, the Black Arrow points out that the RSI is very low at around 35 ish - it normally Rallies from here. 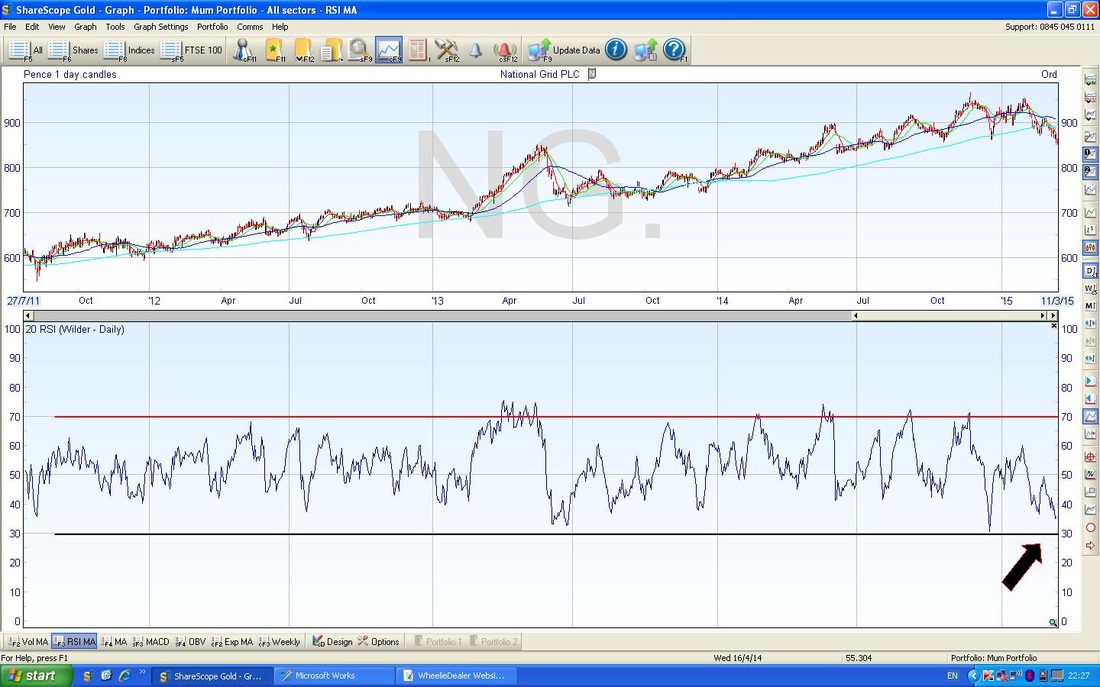
The Chart below shows the Bollinger Bands in the Top Window. The Black Arrow shows that the Price is hugging the Bottom Bollinger Band - this is a point where it can Rally from; however, Prices do have a habit of Hugging them for a long way Down or Up - the key here is when the Price actually moves away from the Bottom Band - I have jumped the Gun on this Indicator - but as I mentioned earlier, I am not Position Trading here, I am after the Divvy and perfect timing is not critical (it’s also very hard to achieve in practice !!) The Blue Arrow in the Bottom Window shows that the MACD (Moving Average Convergence Divergence) is still heading downwards - again, I have jumped the Gun. The Red Arrow shows that the MACD lines are starting to curl the right way - this is however too feeble to base a Buy Decision on - as I said previously, my big driver here was to capture the Divvy Yield. 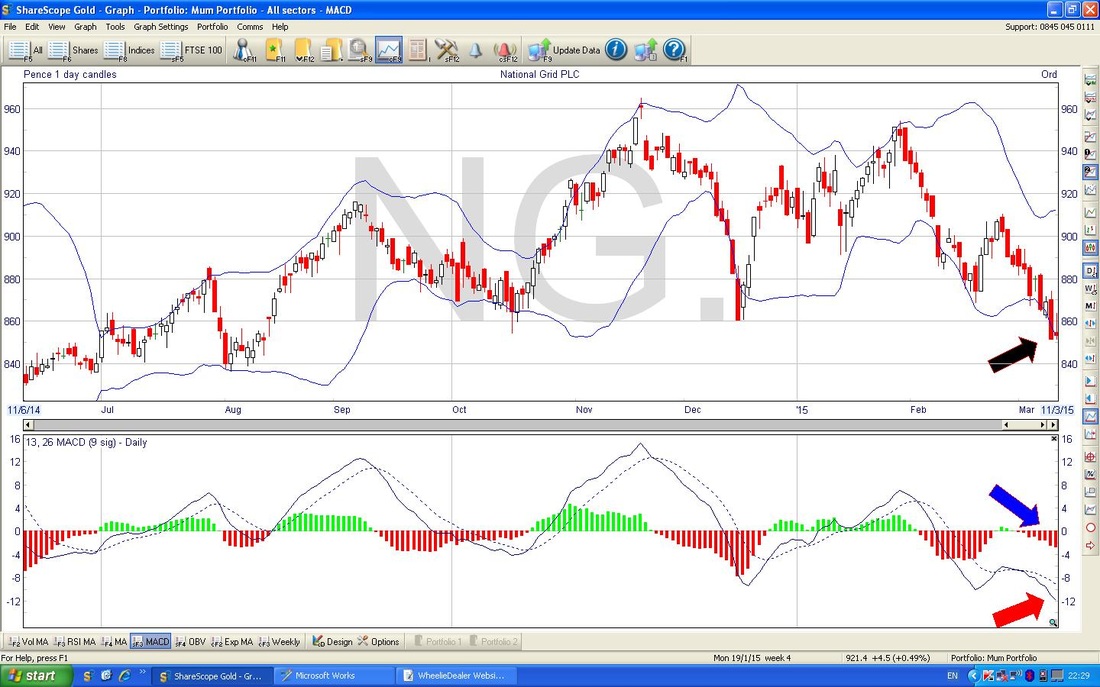
The Top Window of the Chart below shows the Price Line and the Black Line below is the 10 Month Exponential Moving Average (EMA). As you can see, it is at a point now where it usually finds support. 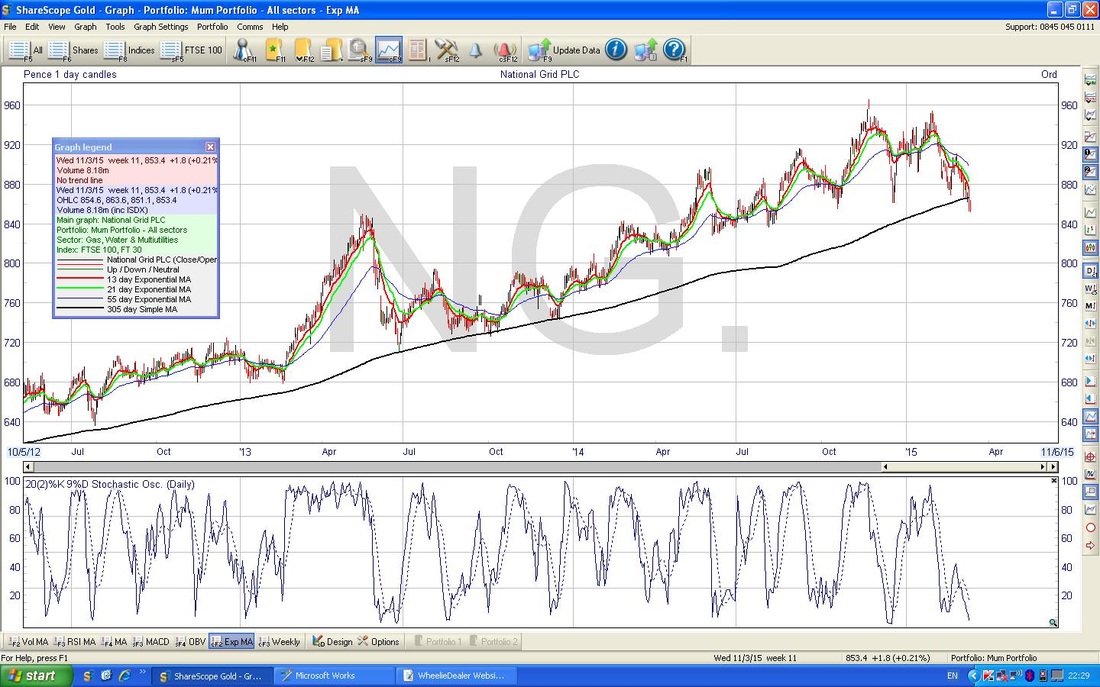
For your information, the lines in the Bottom Window of the Chart above are the new Stochastic Indicator I have been looking at. I think it is supposed to be a very early Warning of a move - however, at the moment, I am not overly impressed by it. Well, either that or maybe I just don’t understand it !!
Right, that’s enough, I have another Blog Draft I want to crack on with. Hope this quick blog gave some insights, Sayonara, wd.
2 Comments
5/11/2017 06:51:13 am
I quite like reading an article that can make people think. 6/11/2023 06:18:09 pm
Thanks a lot for sharing this with all folks you actually understand what you’re speaking about! Bookmarked. Please also discuss with my site =). We could have a link alternate arrangement among us! Leave a Reply. |
'Educational' WheelieBlogsWelcome to my Educational Blog Page - I have another 'Stocks & Markets' Blog Page which you can access via a Button on the top of the Homepage. Archives
May 2024
Categories
All
Please see the Full Range of Book Ideas in Wheelie's Bookshop.
|
