|
This is such a strange time for me on the Markets - I guess maybe all Summers are a bit like this but I seem to be doing less with regards to my Stocks and my Investing stuff in general than I have done for a long time. The reason behind this is really that I have no interest in buying anything at the moment and I am happy to just let my Stocks do what they are going to do and in the meantime I will get out and make use of the Sunshine (when I can because obviously in mid-afternoon it is crazy hot some days and it is hard to do anything) particularly with regards to sorting out my BMW‘s paintwork.
Fortunately I have made great progress on the Car and now I have just a bit of Lacquering to do and then I have to wait for about a Week before some areas I have painted and lacquered can be T-Cutted and Polished to get them nice. I had a bit of a result today because I did some painting on the Front Bumper a few years ago (the opposite ‘end’ to what I have been repainting lately) and it has looked very rubbish for a long time. I was looking at it and it occurred to me that if I got the T-Cut out and put some work into it (and my goodness it is really hard work when you are polishing by hand in this heat !!) then maybe it would look better. Anyway, I got stuck in and now it looks really good - it is about 9/10 and I am so pleased. Why the hell didn’t I do this a few Years ago instead of just looking at it and thinking “Flippin’ ‘eck, that Bumper looks cr*p”? - classic ‘Learned Helplessness’ psychology !!
So it actually shows that I had done the Preparation and the Painting and the Lacquering ok years ago but for whatever reason I simply didn’t get around to finishing the job off. Crazy.
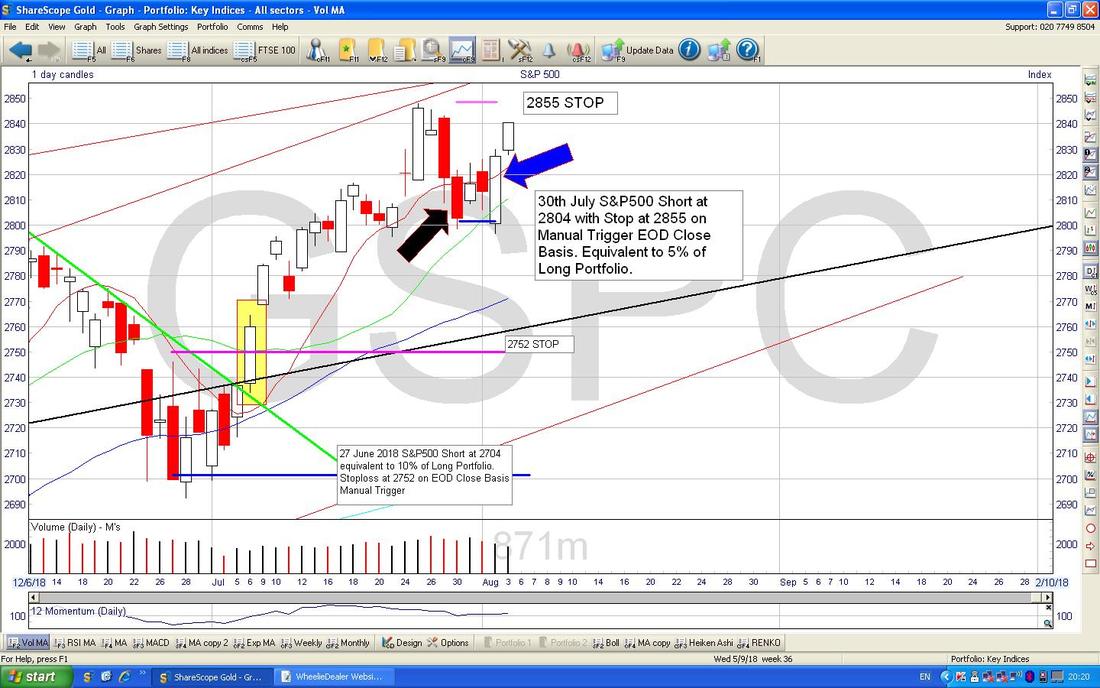
Of course the other important ‘Job’ that I am putting as much effort as I can into is going down the Pub. I managed to pull off this particular trick on Friday last Week (strangely it was the only Day last Week that my Portfolio was up !!) and this coming Thursday I am due to meet up with Paul Hunt (@PaulHun87372422 on the Tweets) which I am looking forward to. See, I am working hard…… Last Week The unpleasantness that has characterised 2018 for me has continued and Last Week my Portfolio was down 1.6% Overall and it has dipped slightly Negative on the Year now which is pretty frustrating !! Thankfully my Income Portfolio is up a bit so that at least makes me a bit happier but it is a really tough Year - although it must be remembered that there are about 5 months left and the Winter tends to be the best time of the Year for the Markets so we might be able to pull something out of the Hat by December 31st. 2018 has so far been a “Sell in May…….” year then. One small highlight for my Portfolio Last Week was the Trading Update from Pets at Home PETS on Friday which is the first time for ages that they have put out some positive News. I mentioned PETS in a Weekend Blog recently and was looking at the Chart which has looked very ropey for ages but I suspect now that we will see some stability come back and it is most likely that PETS goes Sideways for a while. Retail as a Sector is still very detested and I think this will make any Upwards Headway difficult for PETS but it is worth realising that PETS is one of the most Shorted Stocks on the Market so with things improving there will be a lot of Shorters who are now going to Buy-back their Shorts - this puts some nice Buying Pressure on which should help things level out. On Fundamental Numbers PETS looks pretty attractive - with a Forward P/E of 9.1 and a Forward Dividend Yield of 6% there are plenty of reasons for Contrarican Value Investors to get interested. In terms of my Strategy I am just continuing to do very little. My focus is on looking for Opportunities to Sell rather than to Buy and there are a couple of Stocks that I want to dump and one of these in particular I might get rid of very soon. But I am in no mood to replace it and I simply want to increase my Cash levels with the Brexit nonsense ongoing and the potential for trouble that represents (a General Election is definitely a possibility) as well as September on the near Horizon which has the Reputation of being the ‘Worst Month of the Year’ and it should be obvious why I am being cautious. Throw in some Uncertaintly in the Global Economy with the US looking very strong but Europe starting to slow and the UK looking pretty dodgy - there is not much to get me Buying !! Major Blog Revision To cut a pretty lengthy Story much shorter, many Years ago I wrote a Blog about ‘Averaging Down’ and my mate @conkers3 has done a cracking job of pretty much totally re-writing it and now he has created something really Comprehensive and I think this is the ‘Last Word’ on the subject of Averaging Down and I recommend everyone to read this: https://www.conkers3.com/averaging-down-the-investing-dilemma/ Memory Lane I’m spoiling you this Week with all these Old Blogs but I have dug into the Archive and found this one which might be of interest (it might not, in which case, that’s a bit tough !!): This one is about TopChopping and if you scroll to the bottom there are Links to the earlier Parts but note there are also lots of other Blog Links at the bottom if you are bored !! http://wheeliedealer.weebly.com/blog/the-psychology-of-the-topchop-part-3-of-3 WheelieBash Saturday 15th September The List of People intending to come to the WheelieBash is growing fast and there are some really impressive Investors and Traders due to come along. So if you fancy attending and having the chance to meet the likes of Steve Holdsworth, Aston Girl, Dann @Moonraker, Francis @caymafrancis, Mark Bentley @marben100, Tamzin from piworld, Jon Curry and @vilage_idoit who wrote those excellent Guest Blogs, then skip over to the Homepage and there are some more details on there and please drop me a line to let me know you want to come so that the Numbers don’t get out of hand - I reckon we can cope with 50 People and I expect that many will attend. Blog Slate Last Week I published the first of the 3 Guest Blogs from Michael @vilage_idoit which has had a rapturous response on Twitter and clearly many Readers have really appreciated Micheal’s hard work. I plan to issue the Second bit this coming Week and the Week after I will issue the Final part - and I can honestly say that the next bits are better than Part 1 !! So there is plenty in the Blog Slate in Draft Form to keep the flow going even though I am out playing in the Sunshine and not ‘working’ all that hard. Last Night I added another short one to the Slate with a Blog about the importance of thinking in terms of Percentages rather than Pound Notes and it needs a bit more refining but it was a good start. I have another Mate knocking up a Guest Blog as well which should appear in time. I also added a ‘Non-Finance’ Book to the relevant page which is ‘Painting the Sand’ by Kim Hughes about Bomb Disposal in Afghanistan and I have written a bit of a Review to go with it - I liked it a lot and it is a surprisingly easy read. I also added a Finance Book which was recommended by Phil Rosen (@fouracreman) which is a Novel but explains the Journey a Trader makes as he learns what he is doing and it is merely 99p but it is only available in Kindle Format - see ‘Wheelie’s Bookshop’. Of course yet another Month has whizzed by so I need to update the ‘Weekly Performance’ for July and it is pretty ugly I think !! I also need to update the ‘Little Black Book’ and I will try to do both of these this Week. OK, time for Charts…….. S&P500 First thing I want to show is my actual ‘Working’ Screen from which I monitor any Trades I have on the S&P500. As usual, all the Charts are from the brilliant ShareScope Software I subscribe to and if you click on them they should grow bigger so you can see more detail. On the Chart below, where my Black Arrow is we had a second Down Candlestick and it looked like the S&P500 (along with other Indexes) was likely to properly turn down. On that basis I put a Small Short Spreadbet on which is where the Narrow Blue Line is just below the Red Candle that has the Black Arrow pointing at it. Because the S&P500 has been so bullish of late with Pullbacks of just a couple of Days often getting bought, I decided not to go too big with my Short and this turned out to be a good decision. The fact that igIndex now want massive amounts of Margin Deposit due to the ESMA Rules also doesn’t help. As you can see at the top I had a Stoploss placed at 2855 (if you go to my ‘Trades’ page then there is lots of detail there about the Trade but it is pretty much as written in the Text Box on this Chart). However, something that I am tending to do these Days is that if I put a Short on and it doesn’t start falling straight away (I will probably give it a Day), then I will Close the Position before it hits my Stoploss because it simply looks like the Market is not going to fall more. I tend to find that when the Bears get really stuck in then the Markets fall fast and with little respite. Closing the Position quickly like this means that I do not take much of a Loss on the Trade and in this case it was miniscule because I had a Small Position. In this case the S&P500 went Sideways for 2 Days with a couple of ‘Inside’ Days but then on Thursday it did a Big Up Day where my Blue Arrow is and I took this as a good sign that it wanted to move up again. In addition, it was US Non-Farm Payroll Numbers on Friday and I did not want to hold a Short going into this News Release which often can spur a Rally on a Friday when Volumes are thin. As it happens the Numbers were a bit weak but the Market didn’t seem to mind with a rise on Friday as you can see with the Small White Candle after the one with the Blue Arrow. I suspect the thinking is that if the US Economy is slightly weaker then it delays the Fed from raising Interest Rates any faster.
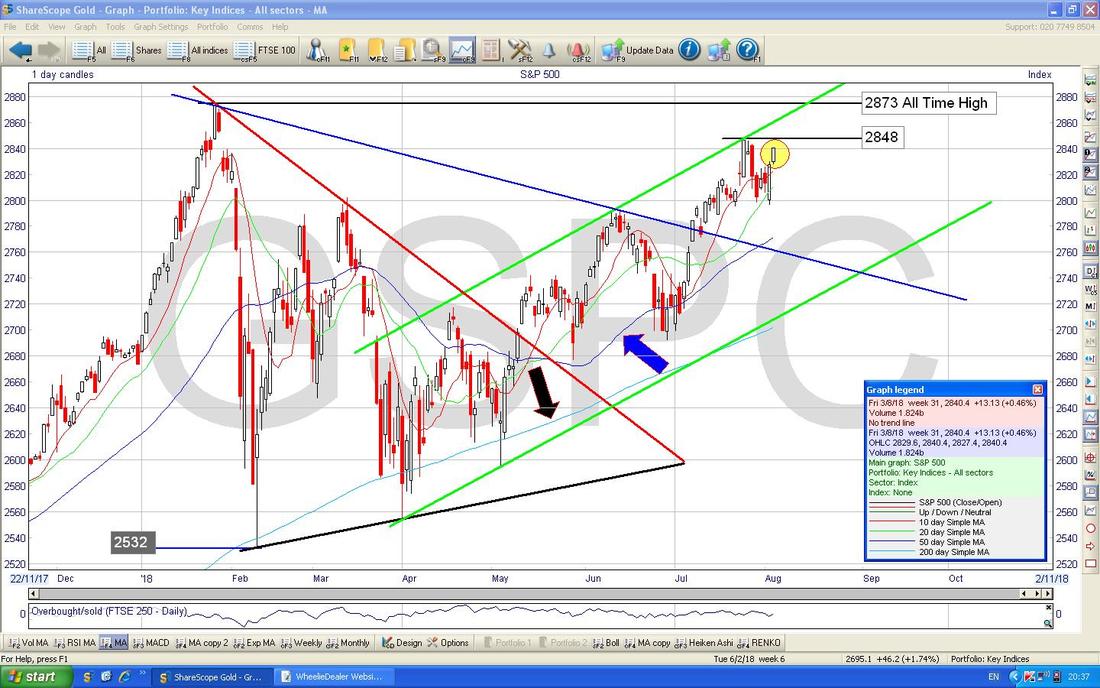
I have zoomed out a bit on the Chart below and my Yellow Circle is capturing the Up Candle from Friday and obviously the S&P500 now needs to get over 2848 and then to move on to the ATH at 2873. A Breakout over the ATH would be hugely Bullish and I think it is quite likely.
Note my Blue Arrow which is marking the Blue Wiggly 50 Day Moving Average Line and the Black Arrow which is marking the Light Blue Wavy 200 Day Moving Average - both of these are rising together and that is really Bullish. The Major Trend is still firmly up here.
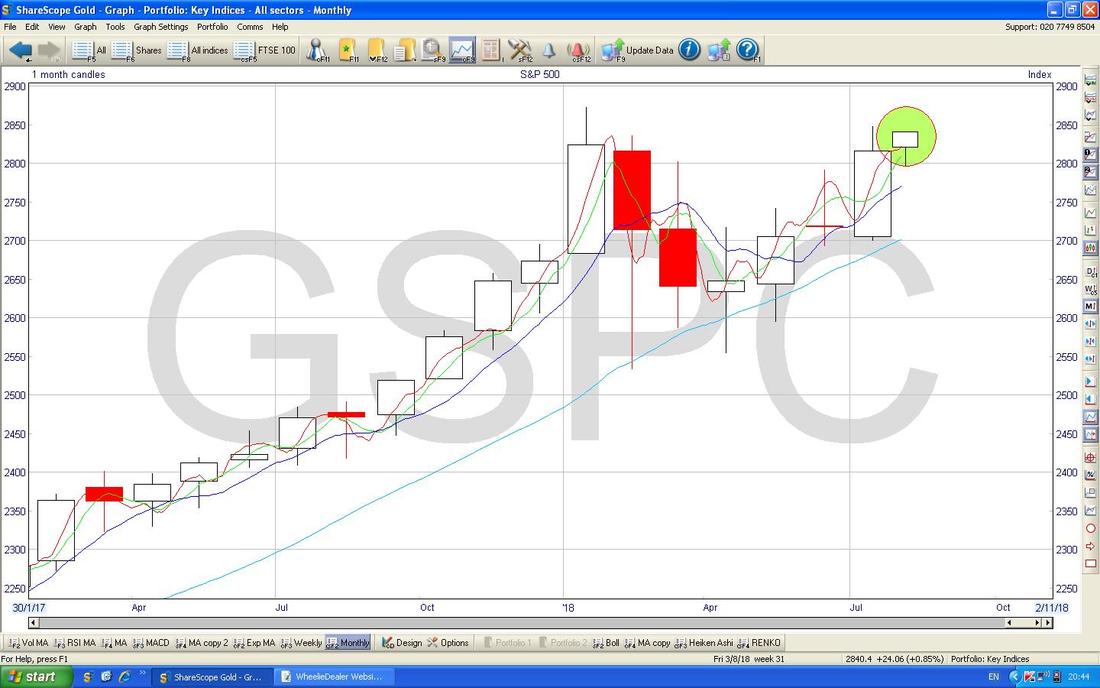
Now we have completed another Month, it makes sense to look at the Monthly Candles and remember this is particularly important because Longer Timeframes dominate over Shorter Timeframes - so the Monthly Trends are more important than the Weekly and these are in turn more important than the Daily etc.
On the Chart of the Monthly Candles for the S&P500 below please ignore the Small White Candle in my Green Circle because this is for August and of course it means nothing after just a few Days. However, the Candle before is for July and it is a nice Big White Up Candle and this is Bullish.
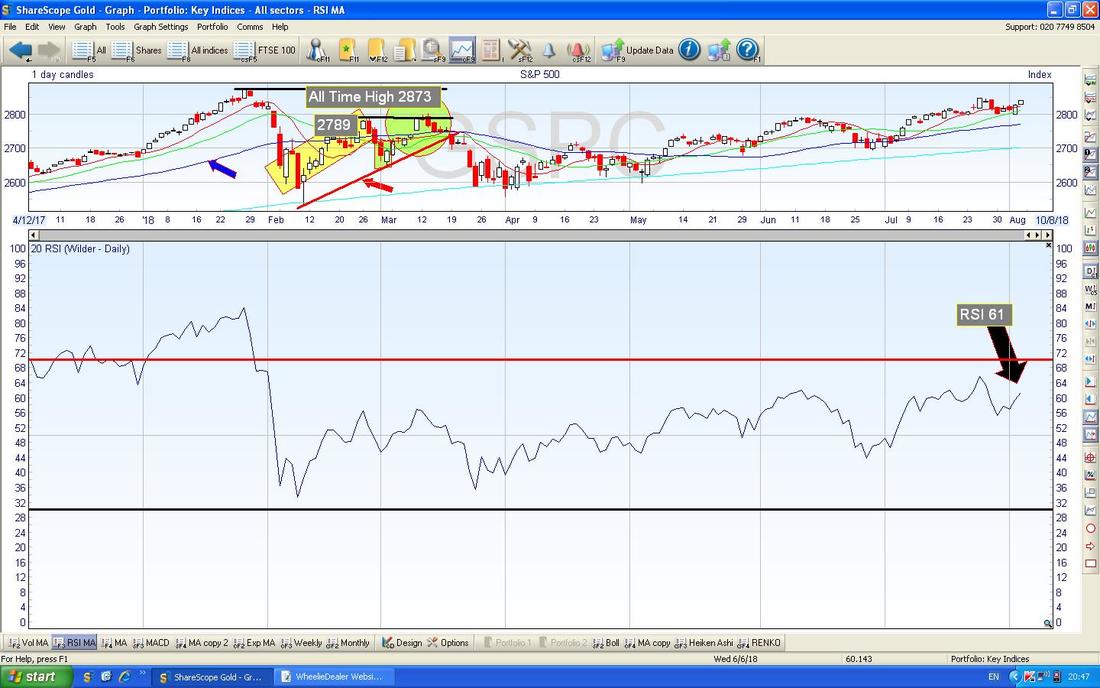
In the Bottom Window on the Screen below we have the RSI (Relative Strength Index) for the S&P500 DAILY. On a Reading of RSI 61 this has plenty of room to go higher and this is supportive of the idea that we will see the All Time High attacked soon most likely.
The DOW is pretty similar to the S&P500 so I won’t show that and interestingly it has a Big White Up Candle on the Monthly. However, the Nasdaq Comp isn’t showing the same patterns……….
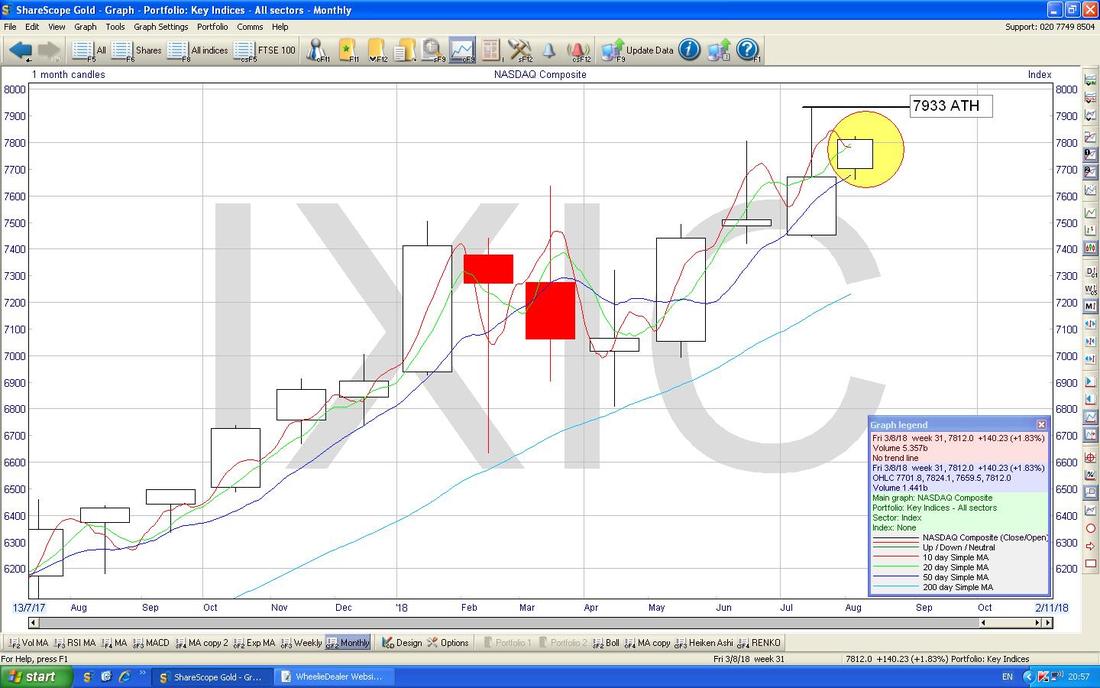
Nasdaq Composite (US Tech) As I hinted at earlier, the Monthly Candles are really important because they dominate over the Shorter Time Periods. On the Chart below ignore the Small White Candle in the Yellow Circle because this is August and irrelevant, but note the Candle before for July is sort of an ‘Inverted Hammer’ - ok, not a pretty or perfect example but the point is it has a Long Tail (or Wick) going upwards and making the All Time High at 7933 but this could be a Reversal Candle and predict a coming Downturn. Something to watch then. Note also that the Candle for June was a better example of an Inverted Hammer but it did not actually come to pass.
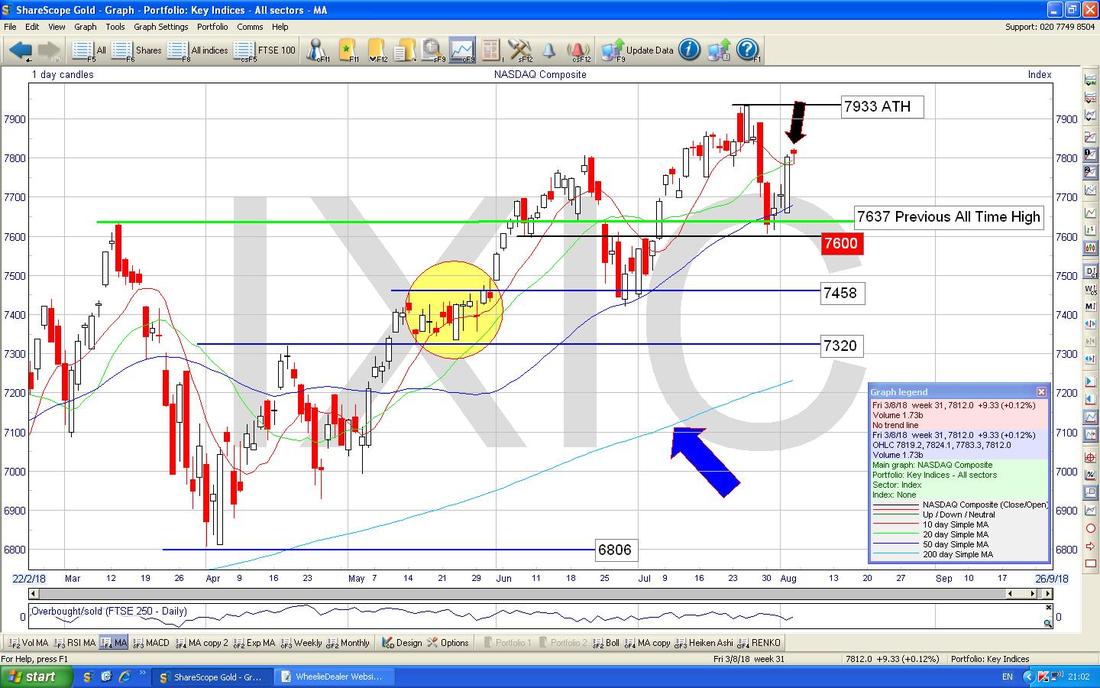
Now we are back to Daily Candles. On the Chart below my Black Arrow is pointing to a Small Doji Candle from Friday and this shows hesitation and that neither Bulls nor Bears are really in charge. Obviously the key here now is the ATH at 7933 and I would expect an Attack on this to happen quickly in the coming Week but if we do not get it, then that would show weakness and Support around 7637 and 7600 etc. would become important. Note the Moving Averages are rising and this means the Major Uptrend is still running (my Blue Arrow is pointing at the 200 Day MA Line).
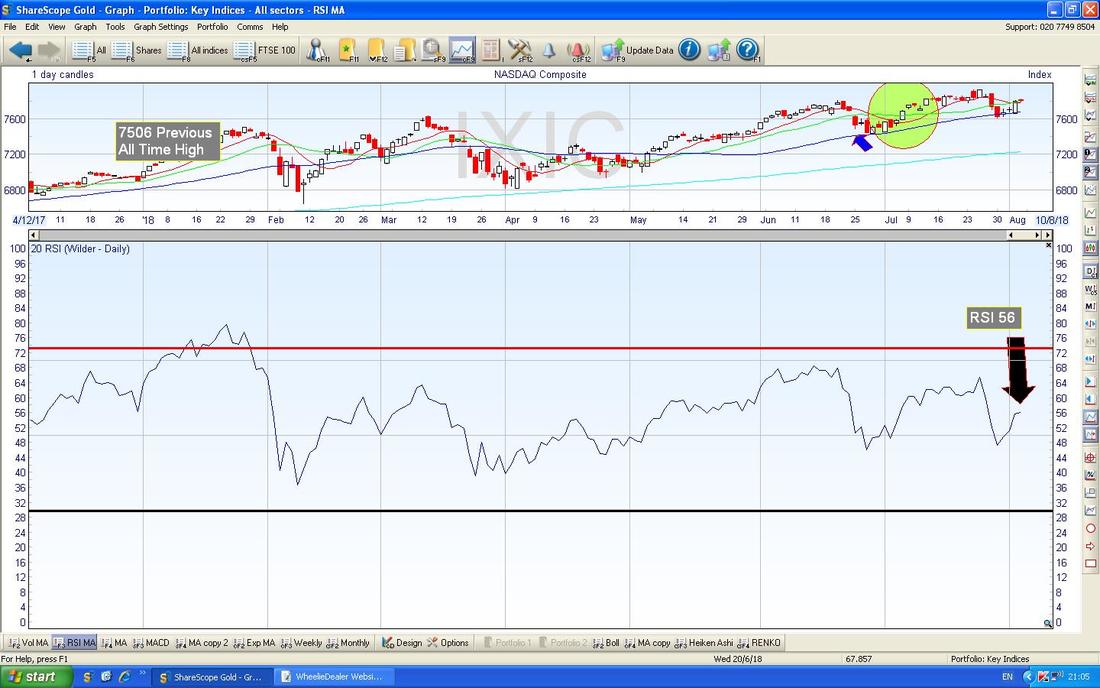
In the bottom window below we have the RSI for the Nasdaq Comp Daily and on a Reading of RSI 56 this is pretty low but above 50 and there is clearly lots of room to move up if the Bulls get a grip next Week.
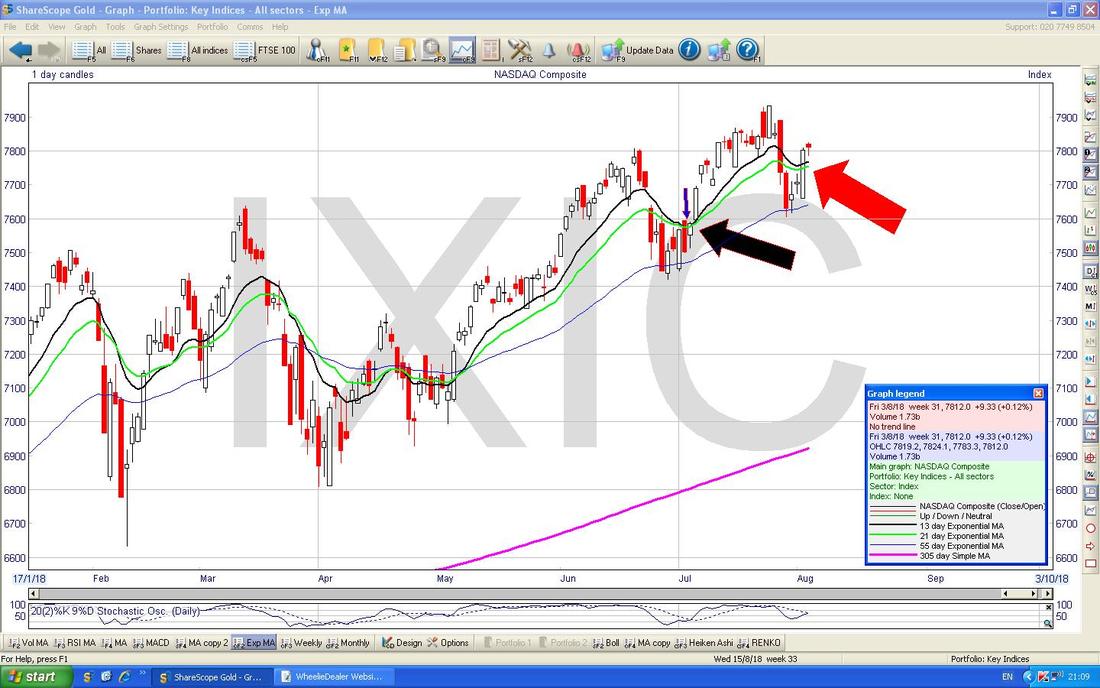
Next we have the 13/21 Day EMAs (Exponential Moving Averages) which I totally adore. My Black Arrow is showing where the Black 13 Day EMA Line narrowly avoided doing a Bearish ‘Death Cross’ against the 21 Day EMA (the Green Line) and such avoidance is Bullish. My Red Arrow is showing where the 13 Day EMA is still above the 21 Day EMA at the moment.
FTSE100
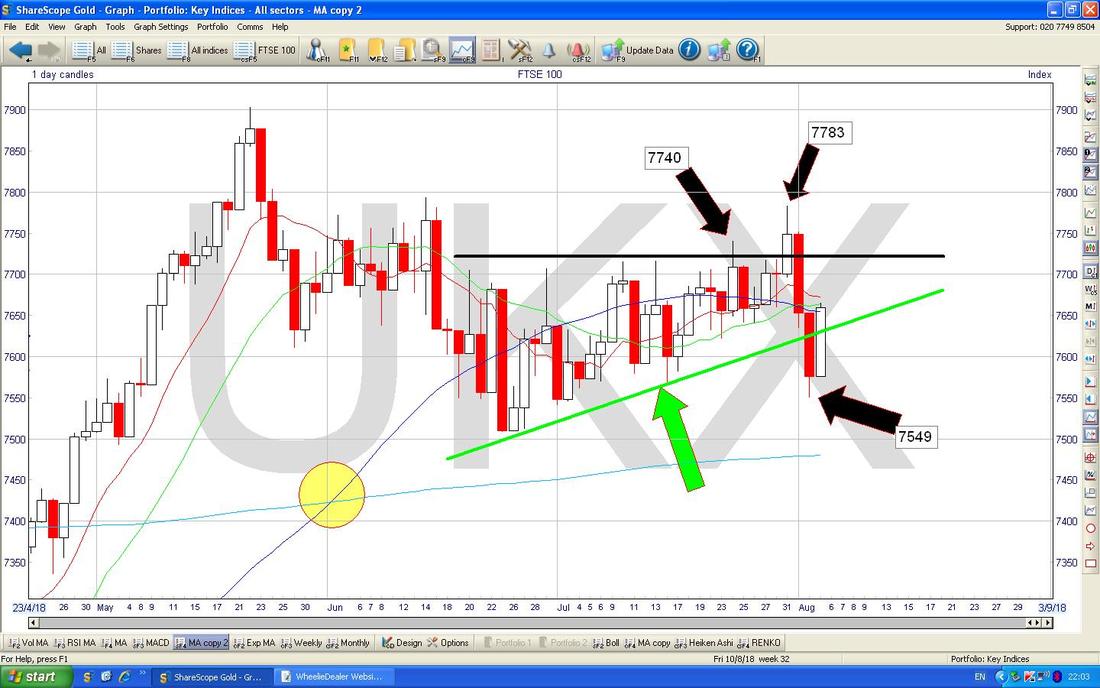
Triangle Breakouts tend to be very reliable and a good indication of where a Price Chart is heading next. However, the FTSE100 totally tricked me Last Week with an Upside Breakout of my Triangle that I have been going on about for Weeks but then it promptly fell back and at the present time is it back within the Triangle. The Chart below shows all this and really it is now most likely in a Sideways Range between about 7500 at the Bottom and 7800 at the Top - if it Breaks above the latter then that is Bullish and if it falls below 7500 then that would be Bearish. Other than that, I suspect we might go Sideways for a while within this bigger Range.
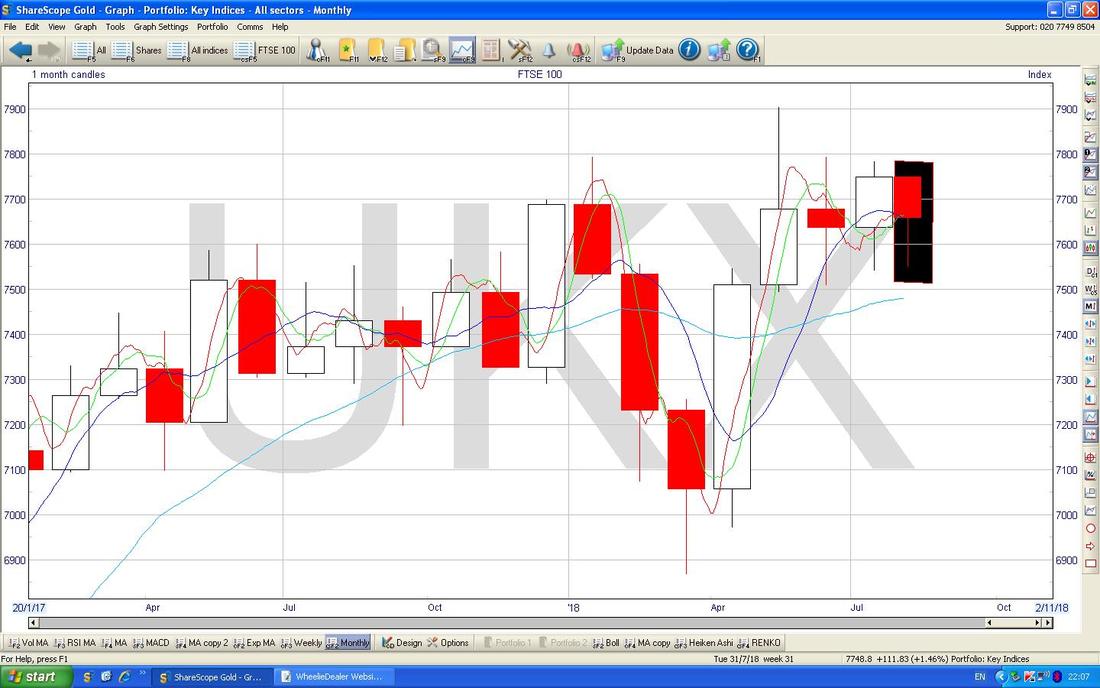
The Chart below has the Monthly Candles - my Black Box is wiping out the invalid formation for August and the Candle for July is Big and White and Up and this looks quite good for Bulls really. Obviously the All Time High up at about 7900 is very important and a Breakout over this would be very Bullish and probably almost guarantee we will see 8000 soon after.
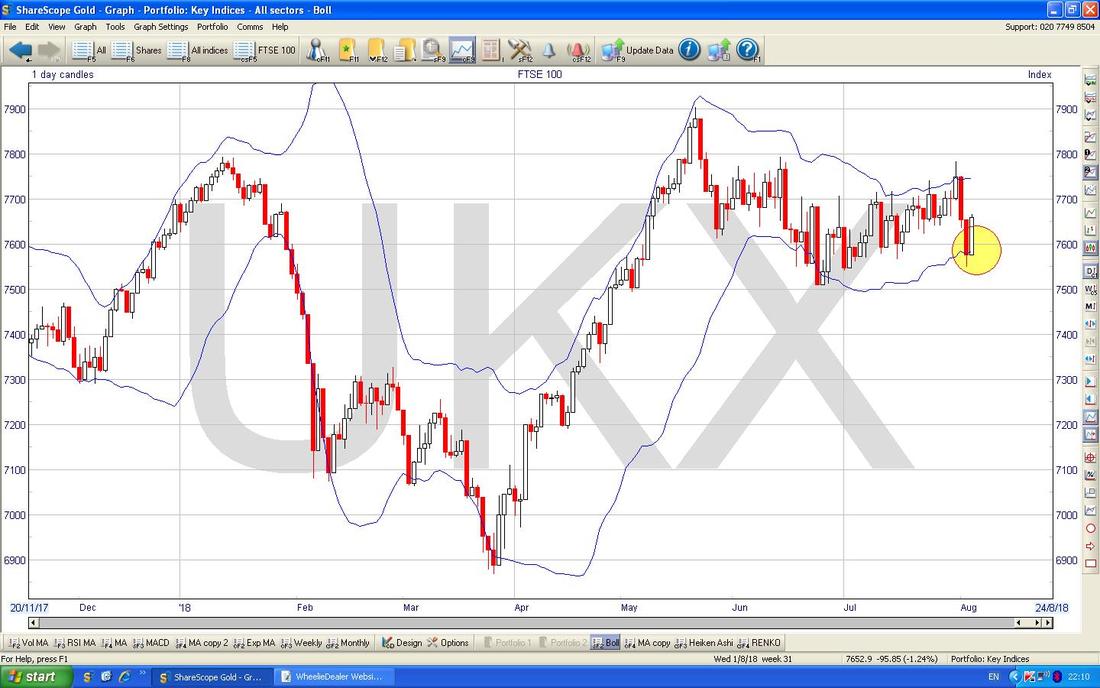
Really the FTSE100 is all about that Sideways Range now but I will chuck this in just because it suggests a bit of Bullishness. The Chart below has the Daily Candles for the FTSE100 with the Blue Wiggly Bollinger Bands above and below. Where my Yellow Circle is the FTSE100 dropped down to the Bottom BB on Thursday and went slightly below it and then on Friday it moved up off the Bottom BB - this suggests there is room to move up to the Upper BB around 7750.
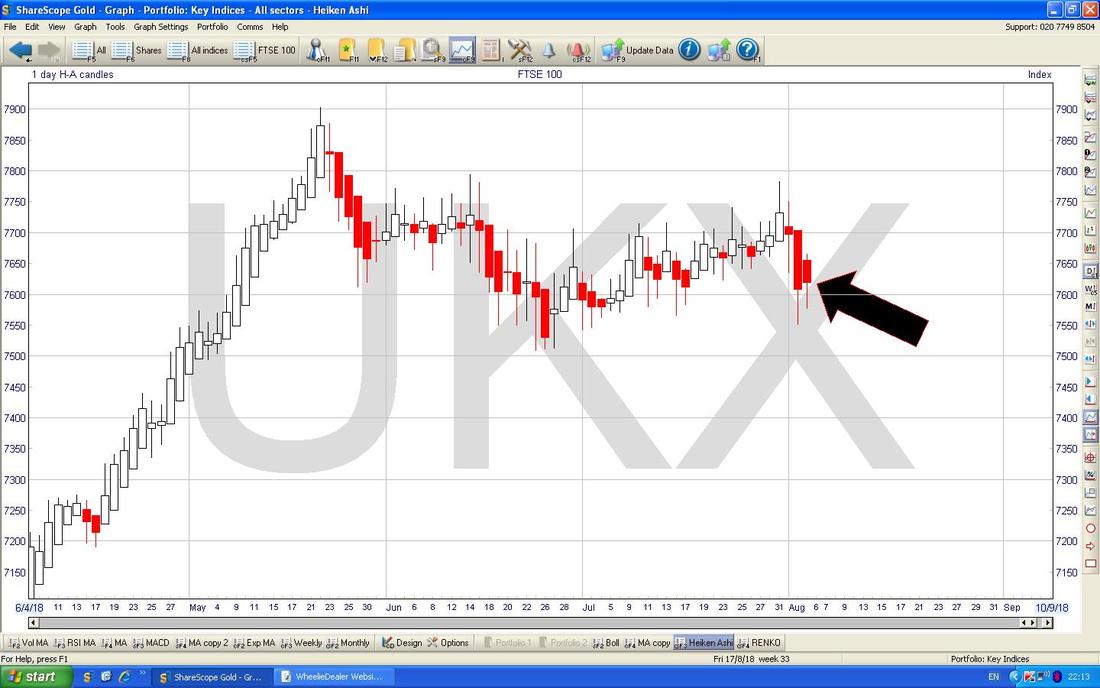
Next we have the Daily Heiken Ashi Candlesticks and my Black Arrow is pointing to where we have a Red Down Candle and this suggests more downside. However, remember these are ‘slower’ than the ‘Normal’ Japanese Candlesticks because they are constructed on an Average over 2 Days so it is very possible that the Price moves up early next Week but this is not showing yet in the HA Candles.
It’s a classic Trade-off - the Price you pay for very clear Signals with HA Candles is that they are not so ‘timely’.
FTSE250
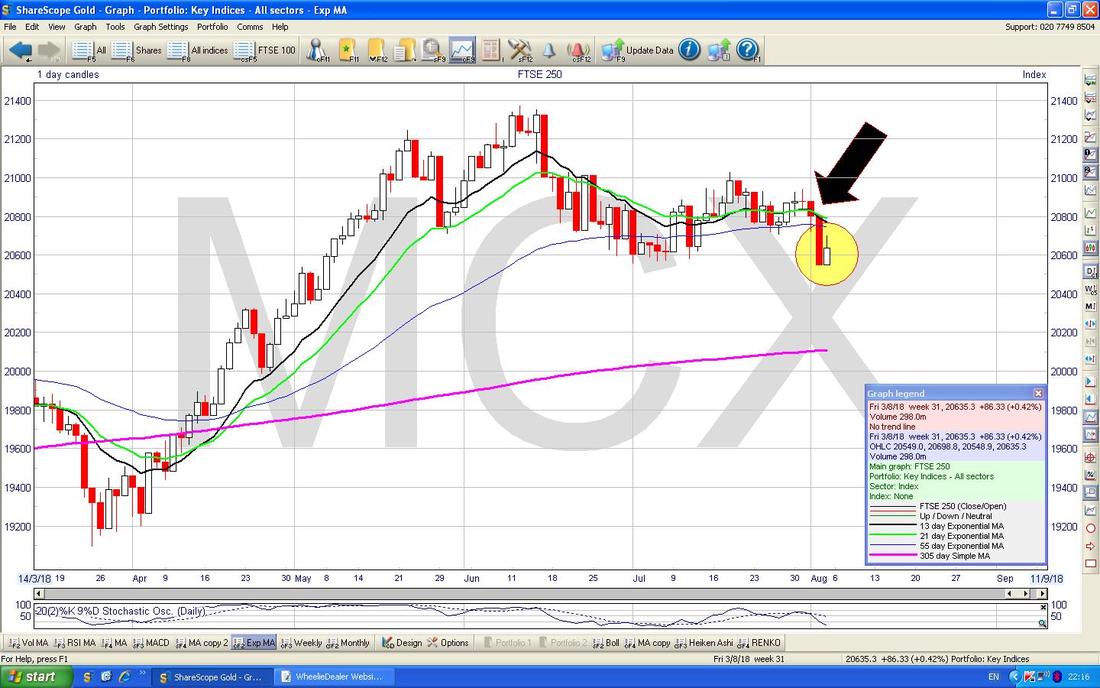
I won’t show much here because I am running out of time now. To an extent the FTSE250 has some similarity to the FTSE100 although it is perhaps a bit more negative looking. On my Chart below we have the Daily Candles but the key thing here is where we had a Bearish ‘Death Cross’ between the Black 13 Day EMA and the Green 21 Day EMA. However, my Yellow Circle is highlighting a possible 2-Day Bullish Harami Candle Pattern which suggests we can move up early Next Week - if this happens, then the 13/21 Day EMA ‘Death Cross’ could get quickly reversed. If it is not reversed, then this suggests more downside in coming Weeks. However, really I would like a better ‘context’ for a Bullish Harami - ideally it would come after a long and sustained down move - in this case we have only really had a bit of a dip. Also I would like to see a Low RSI Reading around RSI 30 or something.
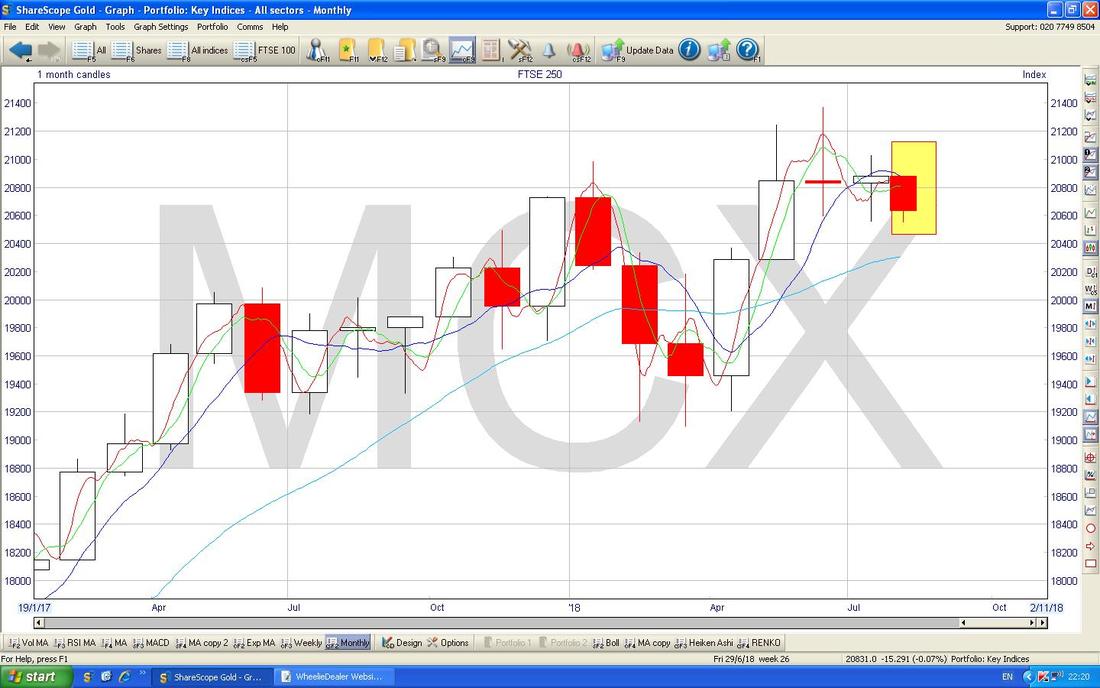
Finally we have the Monthly Candles for the FTSE250. There are reasons to be more concerned here because if you ignore the August attempt at a Candle which is in my Yellow Box, then the Candle for July is a ‘Narrow Body Doji’ and the Candle before for June was similar but more like a ‘Bearish Shooting Star’ - however you cut it, we had a good Long Term Uptrend and in June and July we have had some possible Reversal Candles (this might help explain why my Portfolio has been so weak lately !!).
OK, I will finish there. Good luck in the coming Week and keep your wits about you as we are nearing a difficult period of the Year. Cheers, WD.
2 Comments
Paul Hunt
6/8/2018 10:36:48 am
HI WD, I am down a couple of % in the last couple of months but am letting my shares just run and not doing any great research on new ones. Sometimes you need a break from thinking and studying too hard. You have to pursue other interests so you can go back to your investments with a fresh mind.
Reply
WheelieDealer
10/8/2018 10:14:39 pm
Hi Paul, great to meet up with you yesterday - shame I couldn't manage to organise the weather properly !! It was interesting that we are both being very 'lazy' with regards to our Stocks and really not doing a great deal at the moment. It is a 'funny' time for the Markets and there seems a relentless downwards pressure at the moment with very little volume. I suspect this is common this time of Year but in 2018 it seems particularly turgid - I blame the Brexit shenanigans as T May manages to mess it up as much as she can !!
Reply
Leave a Reply. |
'Educational' WheelieBlogsWelcome to my Educational Blog Page - I have another 'Stocks & Markets' Blog Page which you can access via a Button on the top of the Homepage. Archives
May 2024
Categories
All
Please see the Full Range of Book Ideas in Wheelie's Bookshop.
|


