

|
educational blogs |
|
The astonishing Bull Run continues - I just updated my ShareScope Software prior to doing the Charts for this Blog and I noticed that the S&P500 had another strong move up on Friday and it has now pretty much had a continuous run of about 9 Days - all of 2018 so far in fact. It is Martin Luther King Day on Monday 15th January so the US Markets are closed.
Despite the overall strength I actually had a lucky escape and managed to eke out a Gain of 0.75% on my Portfolio Exposure (slightly higher if you look at Capital used obviously because of my Leverage on Spreadbets) - which is a pleasing outcome after getting hit with a Profit Warning from Moss Bros MOSB earlier in the Week and with Superdry SDRY (just changed name from Supergroup SGP) and Boohoo BOO both putting out decent Results but getting spanked anyway. The latter 2 are very big positions for me.
MOSB is a bit of a concern but I suspect it is part of the general Consumer Malaise that is kicking around at the moment and much of this is down to Inflation and the pressure on Disposable Incomes. However, there are a couple of reasons to think this could be a temporary situation and with MOSB having an enormous Cash Pile and paying a Dividend over 8%, I am happy to stick with it. Firstly, the Inflation Numbers will start to soften as we move forwards - this is because they are dropping out of the comparative numbers from 12 Months ago and also because the Pound has risen a lot (particularly against the Dollar) and this will help a lot. On the downside, the Oil Price has risen a lot and this is clearly driving up Petrol Pump Prices and adding to the Consumer’s woes.
Another factor that very few people realise is that the UK Economy (and presumably most Western Economies, or certainly those in the Northern Hemisphere) always goes into Recession over the Winter months, particularly in January and February. Chris Dillow in Investors Chronicle wrote about this very subject in the latest copy and something that did stand out to me was that the drop is almost as bad as that in the Credit Crunch in 2008 - which is obviously pretty extreme. It is important to think about what this means - the GDP Figures we see in the Media are ‘Seasonally Adjusted’ which in effect smoothes out the big declines in Winter and in reality distorts the situation pertaining now. So the upshot of this is that GDP Numbers may look ok, but the experience Companies and Individuals have of their Daily Lives very much indicates misery and doom and of course this is exacerbated by the usual ‘Seasonally Affected Disorder’ problems that arise from a Cold and Dark Winter. Many Businesses can take this all in their stride, but for Retailers the downturn will be very noticeable and it will be tumbleweed in many Stores, particularly at the start of the week, with trade and footfall picking up at the Weekends. It is interesting that MOSB say in their Statement that the drop off in trade they have experienced was very sharp and coincided with the end of December - it is very possible that things will improve as we go into Spring/Summer. Another big support for the UK Economy is growth elsewhere in the World - recent Figures that have come out on Manufacturing and Exports are the best figures since before the Credit Crunch etc., and of course a strong US and recovering Europe is clearly a strong tailwind as the UK grinds its way through the Brexit process. It is also worth remembering that a huge driver of UK GDP Growth in recent years has been the extremely high level of Immigration - many ‘Leave’ Voters won’t like this but the simple fact is that High Immigration is here to stay and this will remain a strong driver of Growth (and very supportive of House Prices !!). A Sovereign Nation controlling its own Immigration Policy probably isn’t a bad idea though - but the simple facts are that the UK has an aging Population and the Birth Rate is nowhere near high enough to keep the Economy buzzing along. Until we get widespread Robots (it’s coming, but not for some Decades yet I suspect) we will need loads of young bodies. Change of Leaders A noticeable trend in recent Weeks has been how Stocks that were extremely popular and had strong momentum in 2017 have started to drop off a lot and the stretched Valuations many carry have finally caught up with them. The danger of high Ratings…….. Arguably BOO and SDRY fall into this Category although the latter is not all that highly valued in my view - I can see plenty of upside there on top of the huge Gains it has made me already. When I look back at what SDRY has achieved in the last 5 years or so I can only be very impressed - it has gone from a pretty much UK focused Business into a truly Overseas Retailer - the pedigree is obvious. BOO is still pretty highly Rated but with stunning Growth (Revenue grew around 100% in the last Quarter - a Growth Rate that is extremely rare) and the move into the US and China, there is clearly a lot more to come for those who are patient and are relaxed about riding through the Storms to bask in the Sunlit Uplands ahead (that’s some weird mixed up analogy attempt I guess……..). I just heard the Announcer on BBC1 saying Kate Humble was going to Yellowstone Park to look for Bears - I will be surprised if she finds any, it is probably a Cattle Ranch now. I had a brief pause there and watched that Programme on the Queen’s Coronation on BBC1 - well worth watching if you missed it - a fascinating mixture of the stunning beauty and extravagance of the Crown Jewels, the spectacle and colour of the actual Coronation in the Abbey and an almost never seen chance to get a sense of the Queen’s personality. Not for Republicans of course !! However, the beauty of the drops on some highly Rated Growth Stocks could be presenting an Opportunity for anyone who missed out on a particular Stock as it charged upwards over last year. It might not be the case that they are a buy yet, but maybe we will see more falls and this will give the chance to buy at attractive Prices. Another Stock I noticed that had come off a lot was AB Dynamics ABDP - it might not be a buy at the moment, but perhaps in coming Weeks/Months it could be a good time to Enter. I don’t hold ABDP but I have been very impressed by them so far. Anyway, in terms of the Leaders and Laggards, it seems to be the case that as some types of Stocks are falling away, others are taking over as ‘Leaders’ and it looks to be particularly around Banks, Insurers, Oil Stocks and Resources plays - OK, the latter 2 have been rising for a long time now but the upturn in Banks is particularly noticeable and I expect there is a fair bit more upside here as the easing back of Expansionary Monetary Policy by Central Banks and the slow raising (‘Normalising’) of Interest Rates improve the Margins Banks make between what they obtain Capital at and the Rates they can lend it out at. Strategy Something I always like to think about at the start of a Year is what the most likely Outcome will be - this is useful because it helps to inform Decisions I make on Exposure and the type of Stocks I hold etc. (for example, if the coming Year looks tough, I might want to lower Exposure, and especially Leverage, and to hold more ‘Defensive’ sort of Stocks rather than ‘Cyclicals’). In simple terms, the Outcome at the end of the Year for the Markets can only be one of the following 5 possibilities:
Judging by the strength in the Global Economy but combining this with pretty high Valuations (although perhaps not extremely excessive apart from pockets of the Tech Sector), it seems most likely to me that the main US, UK and European Indexes are likely to be ‘Up a Little’ - in fact, this is the most common Outcome with the Markets tending to rise most Years, but with odd huge falls when times go ropey. On this basis, I am quite happy to plough on as I am although I do want to lower my Exposure soon - however, I am not rushing to do this because Markets are just so Bullish at the moment and it makes sense to be in the Markets and capturing this Upside. OK, the tide could turn very fast, but if so I can quickly reduce Exposure and of course I will probably Hedge using a Short on the S&P500 but I will keep any such Short quite small and use a Stoploss. Shorting anything has been a Mug’s Game recently. With Winter being traditionally the best time of the year, I see no great need to panic etc. but I do feel that when we get towards April/May, the usual Seasonal Pattern of weakness over the Summer may kick in - we shall see, but I will probably start getting more jittery as we head into Spring. Forex-Anaytics Webcast Last Monday I did the Webcast that I have been discussing a while and apart from some technical challenges at the start which really threw me off my stride, the feedback I have had has been very positive and after watching/listening to the YouTube Video myself, I am much more happy with it than I was immediately after the event. If you go to the Homepage and look under ‘Latest News’, there is a Link to the Video. Igindex Margin/Deposit Rates I haven’t looked at the details of this myself yet, but I understand that at the end of January igindex are going to change their Margin/Deposit Rates on certain Stocks - from the message I got from a mate it looks like it might not be much to worry about because it seems like on some Stocks the Margin is going up but on others it is reducing. Anyway, I just wanted to flag it here and warn Readers that it is coming and that if they use igindex it would be worth looking into any Changes soon. Phew, that is a load of waffle this week - I won’t go too heavily into the Index Charts etc. as they are all basically extremely Bullish and Over-Bought (but that doesn’t stop them getting more Over-Bought !!) and some sort of Correction, even if just for a few Days, must be quite likely soon. GKN Plc GKN This is an Opportunity which appeared on Friday. I don’t hold GKN myself but it strikes me there could be some decent Upside here which will most likely play out over the course of 2018. If you look at the Chart below (as always, the ScreenShots are from the stupendous ShareScope Software I use and if you click on the pic then it should get bigger so the detail is a tad clearer) - you should be able to see that the Previous All Time High was at 418p and on Friday after the announcement by Melrose MRO of a Takeover Bid at 405p, which was rejected, the Price jumped up and Closed at 420p after touching 434p Intraday. It is probable that there will be some choppiness now as various Players both on the Short and Long side of GKN get themselves positioned as they want to be (I would assume Shorters will want to get themselves out of a potentially expensive trade) but that Technical Breakout over 418p could act as Support. Anyway, whatever happens there the simple fact is that MRO have done us a huge favour in telling us that GKN is really worth at least 405p (ok, this is partly debatable because it was a Cash and Shares deal and obviously the Value of the MRO Shares element is up for discussion), but this at least gives some sort of Anchor, both Numerically and Psychologically as to what GKN is worth. There was more in GKN’s Statement than just the Rejected Takeover Offer and there is more Good News in that the Acting CEO is now permanent (and female which is usually a very good thing !!) and they are doing a thorough Restructuring of the Business and this has the potential to add a lot of value (this is clearly along the lines of what MRO would do with GKN if they could get their Mitts on it). Looking at the Forecasts as they stand, GKN is on a Forward P/E of 13.1 and a Forward Dividend Yield of 2.4% - these look pretty attractive numbers especially when you consider that with a Major Restructuring (and Cost Cutting !!) it is likely that Earnings will be Upgraded so the true P/E is probably a lot lower. I would not be surprised if GKN can get up over 500p and possibly on to 550p in time. Here is a Blog on the very subject of Opportunistic Takeover Bids that get rejected: http://wheeliedealer.weebly.com/blog/listen-to-what-the-market-tells-you-on-takeovers-includes-iom-888-itq-ffy-goal-mks 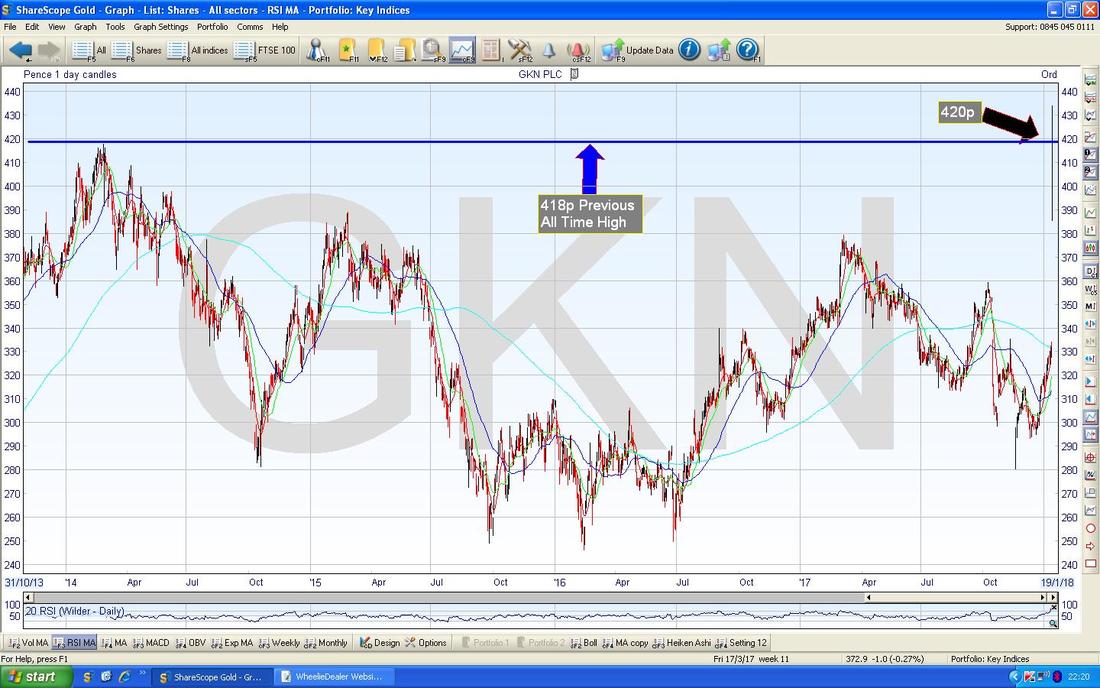
Diversified Oil & Gas DGOC
This is one that I keep coming back to but I merely do it because I think there is a lot of Upside to come here and I know many Readers are holding some. DGOC should have results very soon and the pattern so far has been that on the Day of the Results they tend to jump up - I think this is because DGOC has largely been ‘Off the Radar’ of most People (it is a fairly Recent IPO) and it is only on Results Day that People’s attention falls upon it. With the Oil Price moving higher the backdrop for DGOC is obviously pretty favourable. The Chart below is the ‘Long Term’ View of DGOC if you can call it that (it was only Listed in February 2017) but it is all the history we have and it is clearly in a nice Uptrend Channel. My Small Green Circle is capturing the Small White ‘Doji’ Candlestick from Friday and my Blue Arrows are showing the ‘Gap’ just below where it ‘Gapped Up’ and this is a Bullish move in this Context I think. I bought part of my Holding at about 65p not long after they Listed and I bought more recently at 82p - as ever, all my Trades are detailed on the ‘Trades’ page. The link below is to a Blog I did on DGOC a while back which should give some background - it is quite an unusual Oil Play in that it operates in the US, actually makes Money and pays a nice Dividend. http://wheeliedealer.weebly.com/blog/diversified-gas-oil-dgoc-buy-rationale There are no Forecasts for the Dividend showing on ShareScope but I recall reading somewhere that the Dividend for 2017 should be 5.2p a Share - on the Current Price of 84p that is 6.2% Dividend Yield. My Target is at least 130p and if they can do some more decent Acquisitions, then that could be a lot higher - especially if the Oil Price keeps rising. 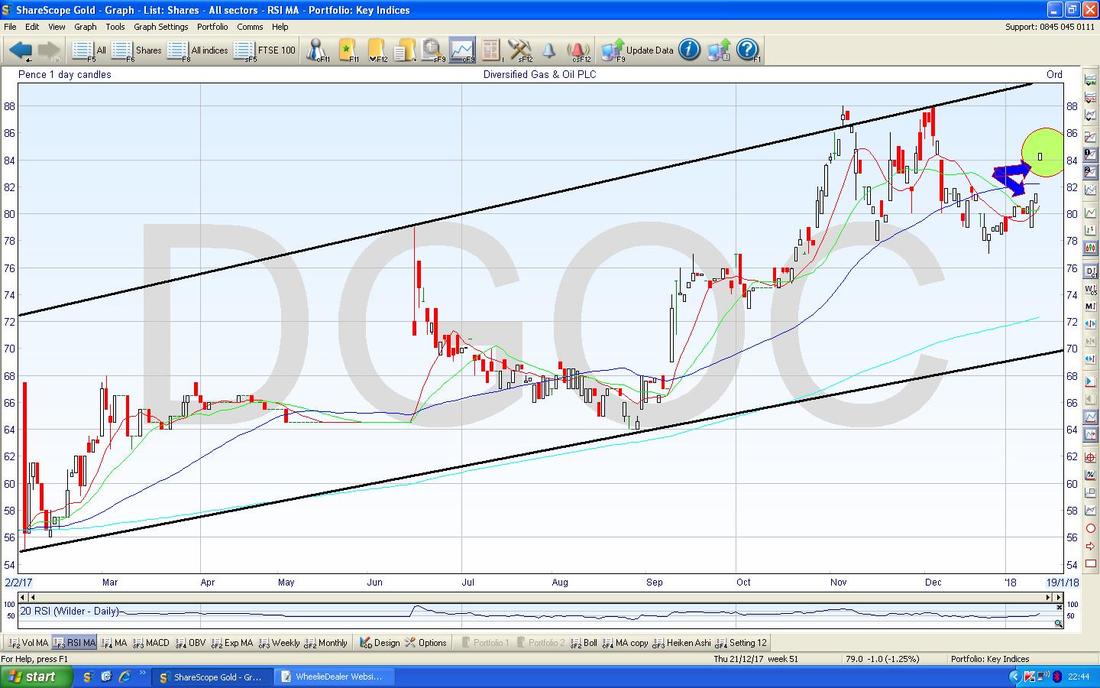
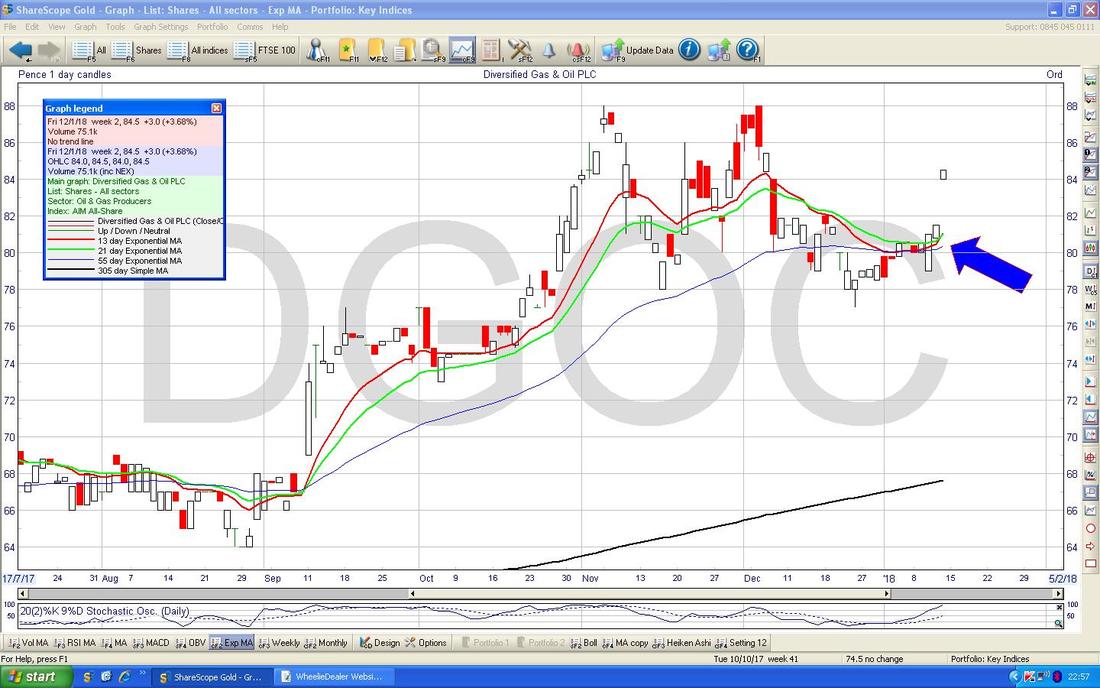
The Blue Arrow on my Chart below is pointing to a Bullish ‘Golden Cross’ between the Red Line 13 Day Exponential Moving Average (EMA) and the Green Line 21 Day EMA - I find this one of my favourite Indicators and it has pretty amazing prediction skills unless the particular Stock, Index or Asset you are looking at chops about a lot. DGOC has lovely Price Action which tends to ‘Trend’ nicely (rather than being Volatile and Crazy) and consequently I would expect us to see more Gains here for the next few Weeks. The All Time High is at 88p and a move above this would be very Bullish and setup more Gains.
Tesla TSLA
This is one I keep revisiting because it just has to be one of the most daftest over-valuations on any Stockmarket. I shorted this one last year I think but ended up suffering a lot of Pain and losing a chunk of Money because the darned thing kept going up - but that doesn’t mean I was/am ‘wrong’ in my assertion of its crazy valuation but it is more likely that I was just shorting too early and the Trade will come to me at some point and it would be nice to go Short when that Opportunity comes along. I wrote a Blog on TSLA a while back which you can read here: http://wheeliedealer.weebly.com/blog/tesla-tsla-sell-short-rationale-is-it-in-need-of-a-proper-charge Some of the details will have changed and of course any Numbers will be different, but the basic Logic of a hugely Loss-making ‘Business’ (Eco-Charity more like !!) and the challenge of overwhelming Competition about to hit them, makes the $41bn Market Capitalisation looks utterly bonkers. Throw in the fact that TSLA are struggling to make 5000 Cars a month when Musky promised 500k a Year, and the absurdity of the Valuation should be obvious. There are also concerns about the Quality of the latest Model coming off the Production Line which seems to have been mismanaged awfully even by TSLA usual Launch standards. First off we have the Long Term picture and the Graph below shows a clear Uptrend Channel - so far any Shorters sat in front of this one are getting run over as an extremely heavy Battery-Powered Car silently runs them over - it will no doubt be out of Juice a few miles down the road though !! 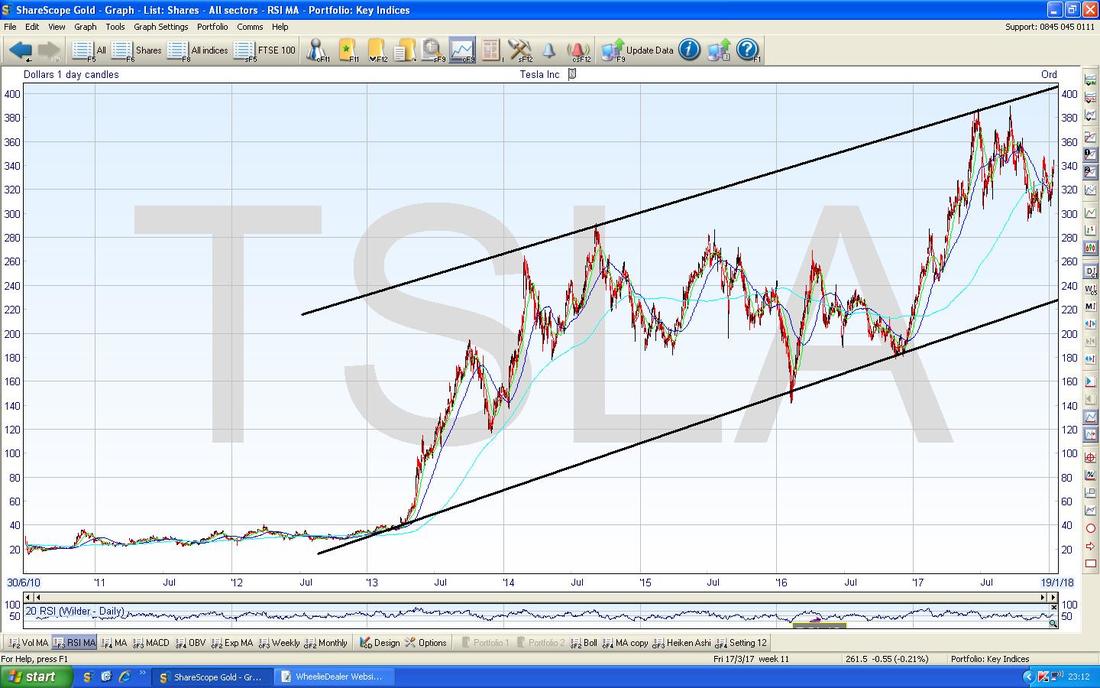
If we drill-down for a shorter timeframe and see what is happening now, it gets a lot more interesting for those of a Bearish tilt. My Chart below has the Daily Candles going back over about 9 months and the first thing to notice is my Red Downtrend Line marked by my Red Arrow - this seems to be quite dominant at the moment and suggests more falls ahead.
The next thing to notice is my Yellow Circle which is marking a Bearish ‘Death Cross’ between the Darker Blue 50 Day Moving Average Line and the Lighter Blue 200 Day Moving Average Line - these Death Crosses are quite good for predicting falls ahead. My Green Rectangle is capturing an ‘Inverted Hammer’ or perhaps a ‘Shooting Star’ Doji from Thursday 11th January 2018 which touched 345p Intraday and then fell back - this really looks like a Bearish Reversal Signal. The Short Term Trade here is to go Short and then to put a Stoploss just above the Top of the Shooting Star. To the Downside, my Blue Line at 292p should act as Support but if that fails, then it would be a good time to go Short most likely because it would suggest the Price is ‘Breaking Down’. 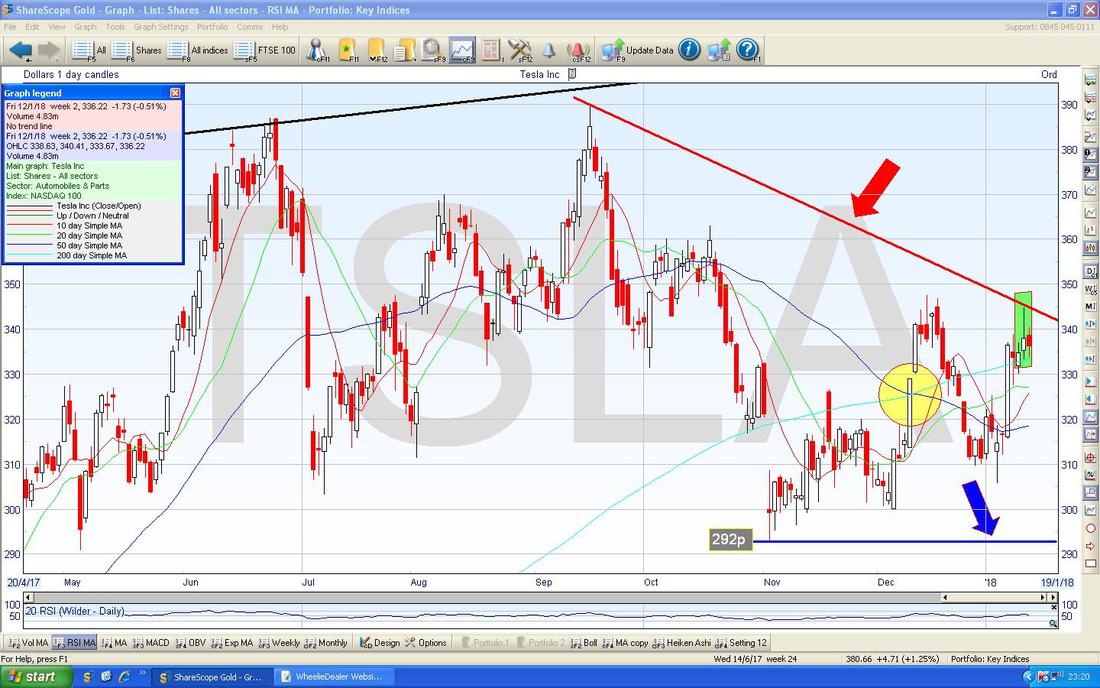
HSBC Bank HSBA
I mentioned earlier how it has struck me recently that Banks seem to be taking over Leadership in the Markets and the moves up in HSBA last week look very promising and on a Forward P/E of 14.9 and a tasty Dividend Yield of 4.7%, I expect we will see more Upside and the All Time High at 954p is highly likely to get taken out and such a Breakout would be really Bullish. Note also that HSBA is a big constituent of the FTSE100 and strength in these kinds of Stocks is likely to take the FTSE100 up with it. First off we have the Long Term Chart on HSBA and the All Time High at 954p should be clearly visible as the Horizontal Blue Line at the top of the Chart and then my Pink Circle is highlighting a Zone of Resistance from about 800p up to the ATH which could be difficult to wade through - although my hunch is that it will do it after some effort over the next few months. My Black Arrow is just pointing to where we are today at 791p. 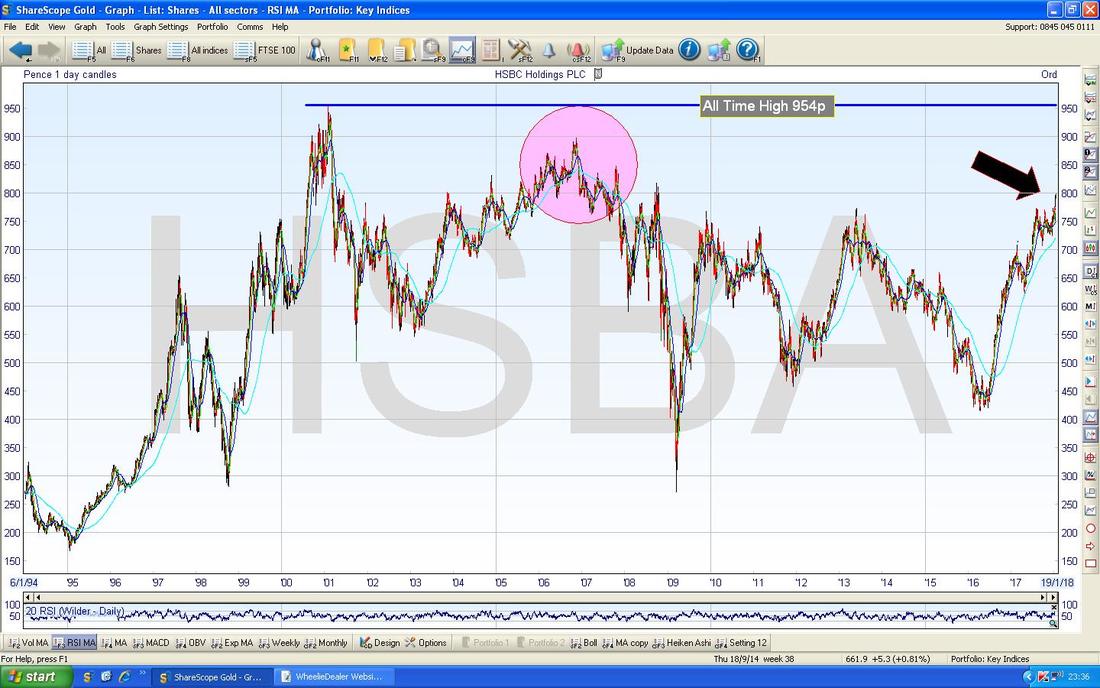
Where my Black Arrow is on the much shorter timeframe Chart below, you can see where the Price jumped up on Wednesday last week and Broke-out over 773p which is very Bullish behaviour. Since that move up, the Price has put in a couple of Doji Candles which are in my Yellow Circle and it is possible that the Lower Point of the Candle on Friday at 788p holds as Support but even if this fails, it would be quite normal for the Price to drop back to the 773p Breakout Level and that should then act as Support (‘previous Resistance becomes Support and all that and vice-versa‘).
A move over 800p would be very bullish. 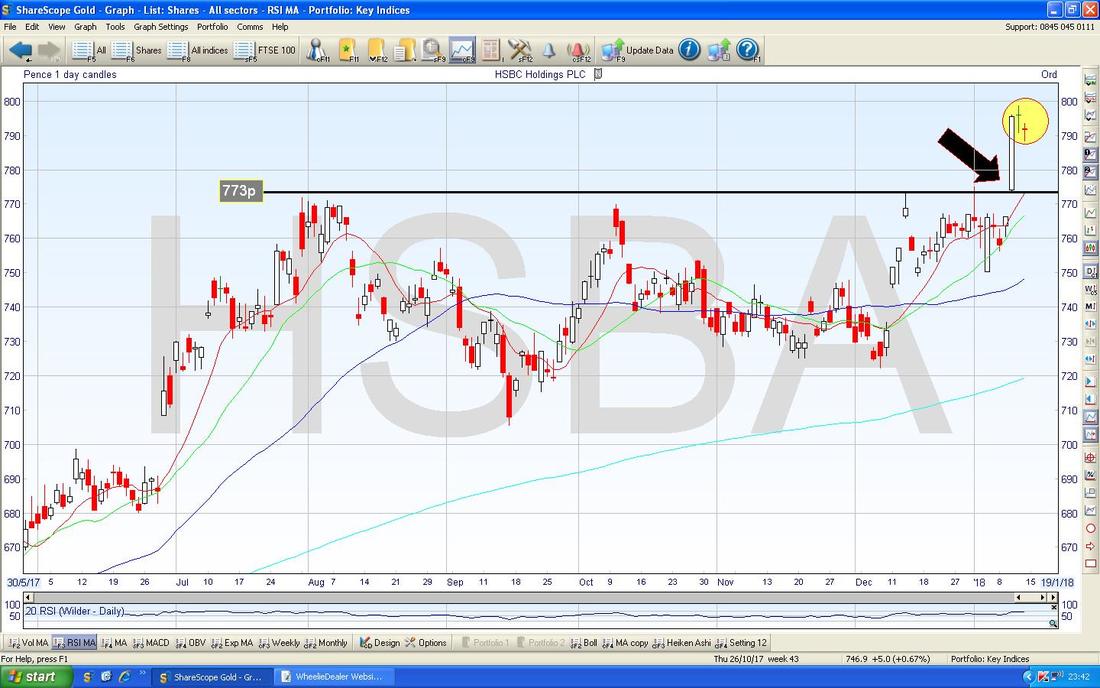
Somero Enterprises SOM
I bought into these around 282p a while back and have had to be patient while the Shares have been in a shallow Downtrend Channel as is marked by my Parallel Blue Lines on the Chart below. The first sign that something was going on was on the Breakout of the Upper Blue Line where my Black Arrow is and then the Price kept rising and not long afterwards did a Breakout of the Horizontal All Time High at 339p, where my Red Arrow is. Note also my Green Arrow which is pointing to how the Darker Blue 50 Day Moving Average Line is moving up towards the Lighter Blue 200 Day Moving Average Line - this could be lining up a Bullish ‘Golden Cross’ which if it happens implies many more months of gains. I love it when the Technical Picture on a Chart stacks up with the Fundamental progress (or lack of !!) on a given Stock and it is certainly the case that SOM has a strong Technical Outlook combined with a strong set of Results a few Days ago - this suggests a lot more upside. On a Forward P/E of 14.3 (less if you strip out the Cash Pile) and a Normal Dividend expected of 2.47% but with a Special Dividend due on top, this looks very good value for the dominance SOM has of its End Markets - and a fast growing Global Economy is very favourable for a Cyclical like SOM. My Target here is a minimum of 450p but more than that is very possible if the Business can keep the momentum going. 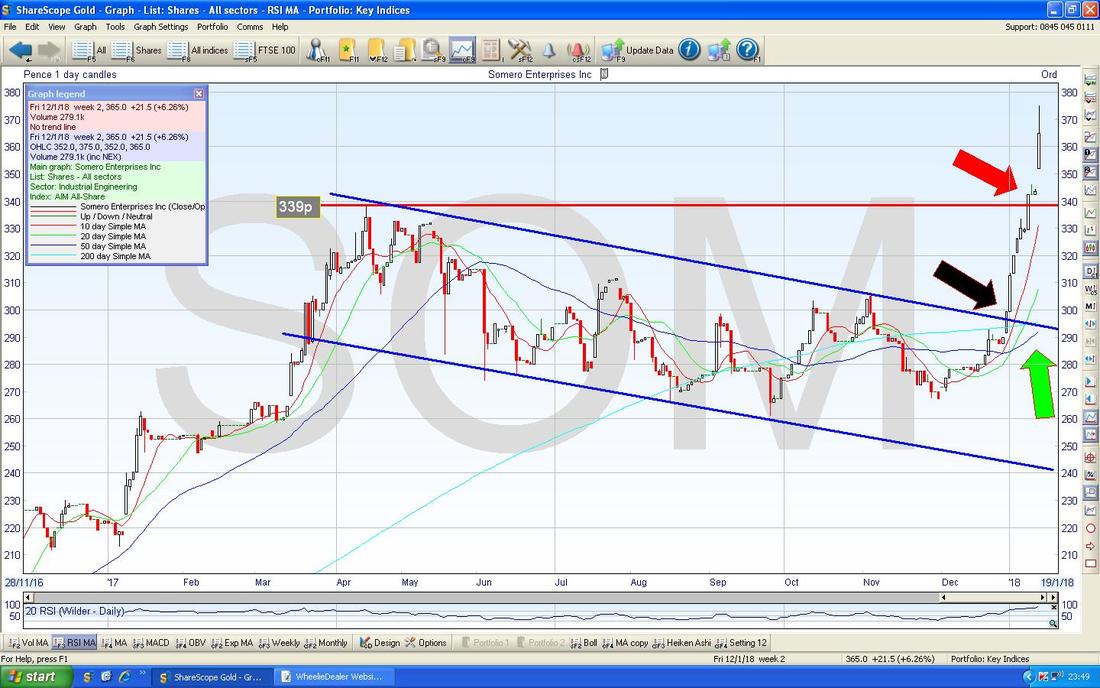
Time is tight but let’s just lob in an Index and some Quids…….
S&P500 The strength in the US Markets is unreal but even the FTSE100 has been doing very well and it is probably only the German DAX and French CAC40 that are slightly lagging. My Chart below in the Pink Rectangle is highlighting the incredible run of Gains since 2018 started and note how the Price Candles are hugging the Blue Wiggly Line which is the Upper Bollinger Band. This hugging can go on for a while but at some point it is normal for a Price to leave the Line by either dropping back or my moving Sideways. 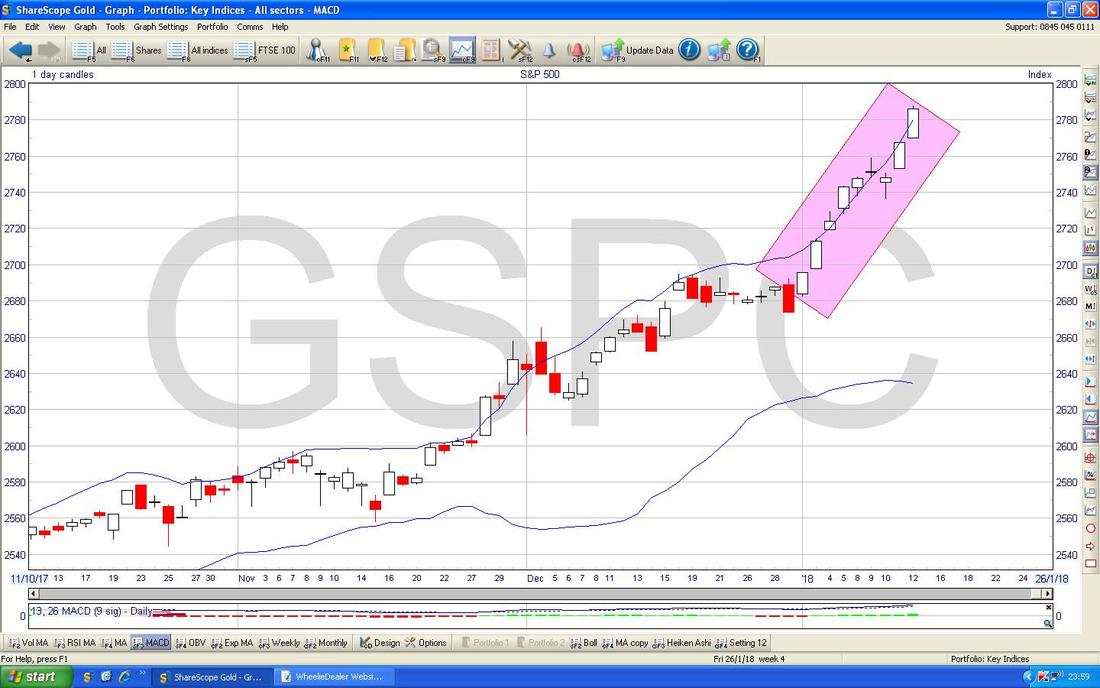
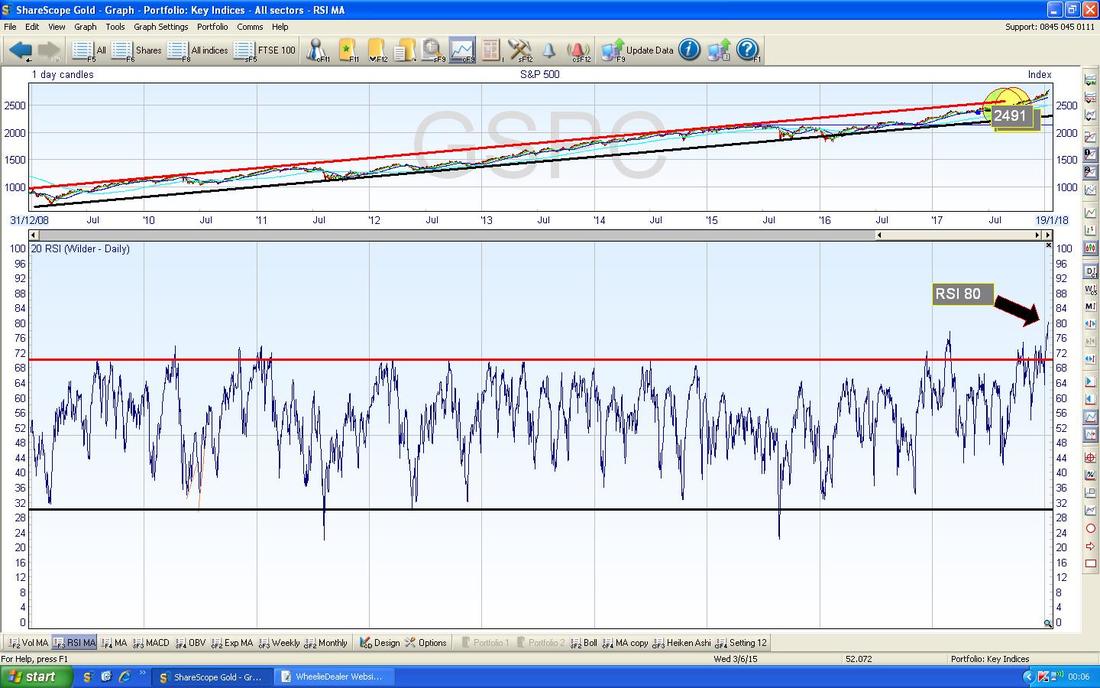
In the bottom window on the Chart below we have the Relative Strength Index RSI for the S&P500 Daily - on a Reading of RSI 80 it is extremely high and the textbooks would call this ‘Over-bought’. It is highly probable we get some sort of Pullback or Sideways Consolidation soon.
Pound vs. Dollar
To get more of a picture look at my Charts Blog from last Weekend but as time is tight I am just shoving in a near-term Chart which shows how the Price is in a nice Uptrend for the Pound (inside the Parallel Black Lines) and on Friday where my Blue Arrow is, it broke-over the 1.365 Resistance Line which is Bullish for the Pound. OK, that’s it for this Week, good luck to everyone and let me know if you see a Bear anywhere cos they seem incredibly rare !! Cheers, WD. 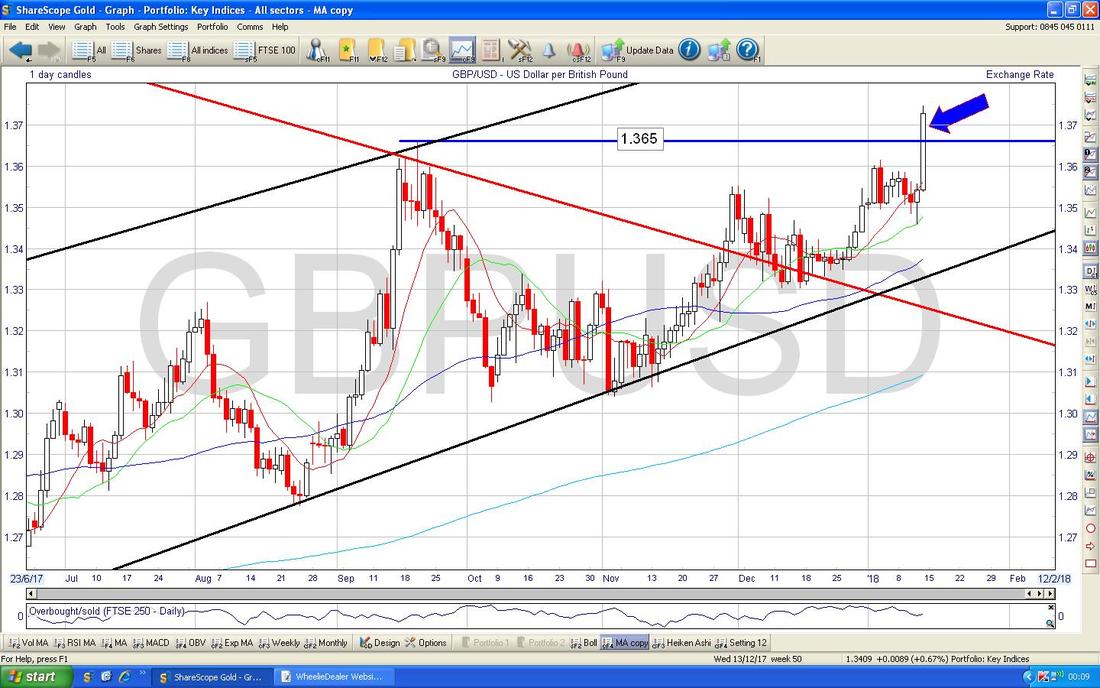
0 Comments
Leave a Reply. |
'Educational' WheelieBlogsWelcome to my Educational Blog Page - I have another 'Stocks & Markets' Blog Page which you can access via a Button on the top of the Homepage. Archives
May 2024
Categories
All
Please see the Full Range of Book Ideas in Wheelie's Bookshop.
|
