

|
educational blogs |
|
This is a blog I have been formulating in the deep dark recesses of the WheelieBrain for quite some time now, and finally it has pushed itself to my frontal lobes and is starting to emerge through my arthritic fingertips; and with a staccato accompaniment of the tapping of my keyboard. I remember reading in various places over time the idea that you could improve your overall Returns by reducing the Volatility of your Portfolio, and I wanted to look into this and see how true or not this was.
Now this plays very much to my obsessions with Hedging because my fixation on that is with the aim of reducing big Drawdowns on my Portfolio, which is very much in line with the goal of lowering overall Volatility. On top of this, there are a few things we can do to lower Volatility and I will be exploring those later in the blog.
You have probably read this from me somewhere before, but as I see it there are 5 possible Outcomes each year for a Portfolio of Stocks:
To be more specific, I tend to see those as:
But obviously these are just rough guides and chances are that I wrote them slightly differently before – it is the principle behind this that I am leading you towards really. If you can think of any other possible Outcomes then I would love to know but I am pretty sure this covers it in as simple a way as I can conceive. Now of course over a period of many years, the key to making good Returns is very much about avoiding the ‘Big Decline’ years and of course trying to have as few ‘Small Decline’ years as you can and to get plenty of ‘Big Gain’ years. However, in practice and being realistic, I suspect that using Hedging and other techniques such as holding enough Stocks and with Diversification, to cut out the ‘Big Decline’ years will really help your Returns over a long period – for example over a decade. On top of this, removing those Big Scary Declines is likely to be very good for the soul and your psychological wellbeing. A clear benefit being that if you are calm and unstressed then you are more likely to make superior decisions. My intention for this blog is to investigate the veracity of the idea that lowering Volatility will improve Returns and to also see what other considerations need to be taken into account. My thinking at the moment is that I will create a few ‘Models’ of possible, but random, Portfolio Returns over a 10-year period and to see how lowering the Volatility can affect the Overall Return at the end of the 10-year period. To an extent this is more an exercise in how the mathematics works rather than looking at real Returns that are achieved in practice – although I have tried to incorporate a sense of Realism, based on my own experience and from the parameters of my own Portfolio etc. (clearly if you hold far fewer Stocks than I do, then your overall Volatility will be higher). What I mean by the mathematics is how a sequence of Numbers which are added and subtracted but at the same time based on a multiplier of a previous Number in the sequence, actually behaves when run through time. Hopefully it will make sense when you see the Examples and especially if you create some Random Examples yourself. After mucking about with that exercise, I will look at ways in which the Volatility of a Portfolio can be reduced although I won’t write loads on each method because I have done this before many times. I will however include links to relevant blogs etc. at the end, that I have written already. Something that I have quickly noticed from my early scribbles around a potential plan for this blog is the concept that it is much better to have a Bad Year early in a 10-year period than at the end of the period. I intend to look into this further and the conclusion that struck me as a result was that it would make sense to lower the Volatility of a Portfolio as the years go by, and that bigger Portfolios (in monetary terms) would be better served by holding more Positions as they age. Naturally I suspect most people do this anyway and when they start they just have 5 Stocks or something because they lack capital. As time goes by, and they make some good investments and they add more capital from earned income etc., then the numbers of Holdings most likely goes up. That seems to be a good thing. It is also likely that the Quality of the Stocks that are held improves as well. I also hope to look at how erratic Portfolio Returns over the years leads to less good results in the long run and how ‘Smoothing’ of the Volatility can help improve things. Clearly there are also other benefits from lowering Volatility apart from just the impact on Returns – I will try to look at those as well. Examples of Random Yearly Returns I have created the Tables that follow based on the following Assumptions:
Note: In Examples 1 and 2 below, the bad year occurs early in the 10-year period. I was hoping to get them to fit the page in the full 10 years going left to right, but sadly they were just too small so I have had to stack them as shown. The Numbers shown for each Year are the Value of the Portfolio at the end of that Year. If you find any mistakes in my calculations, then please blame Texet, because they made my Calculator and it was extremely expensive at £1.99 from Tesco. 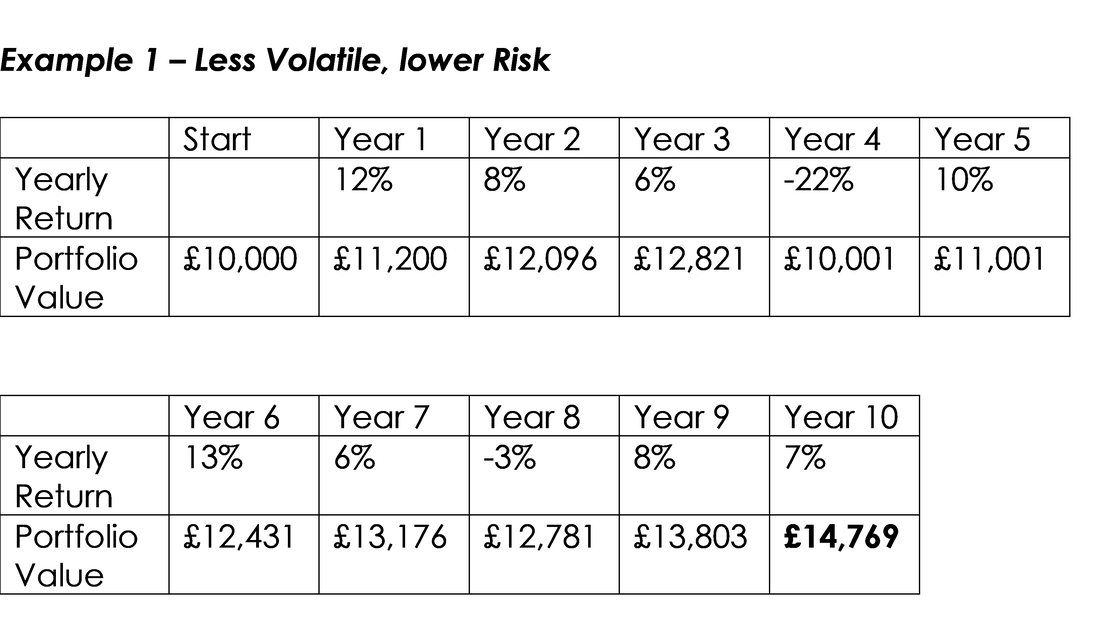
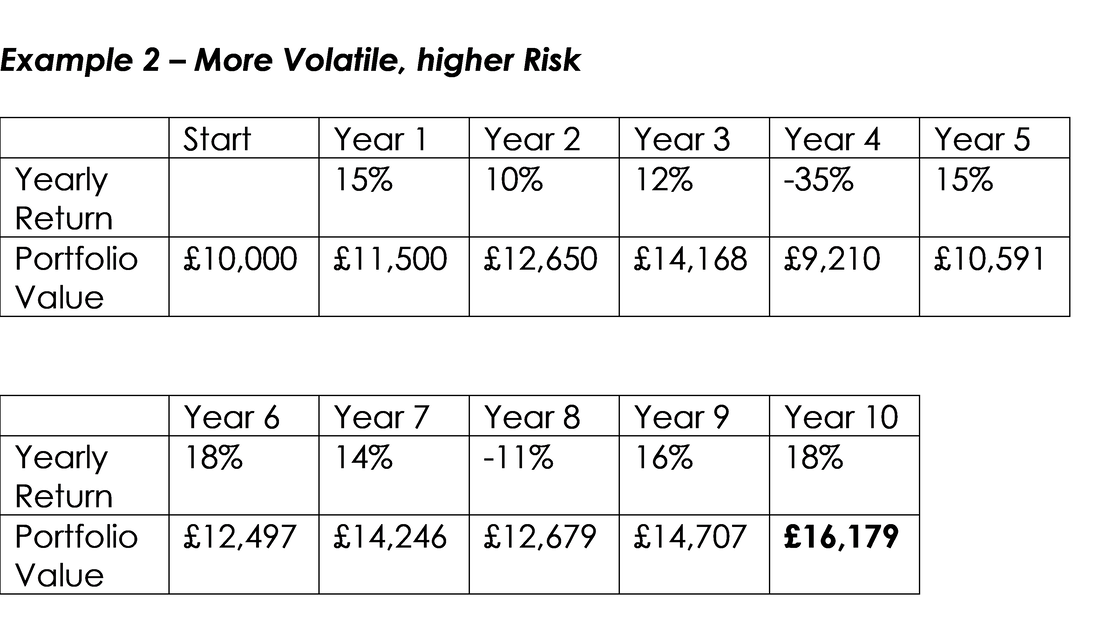
Observations on Example 1 vs. Example 2:
Note: In Examples 3 and 4 below, the bad year occurs late in the 10 year period. 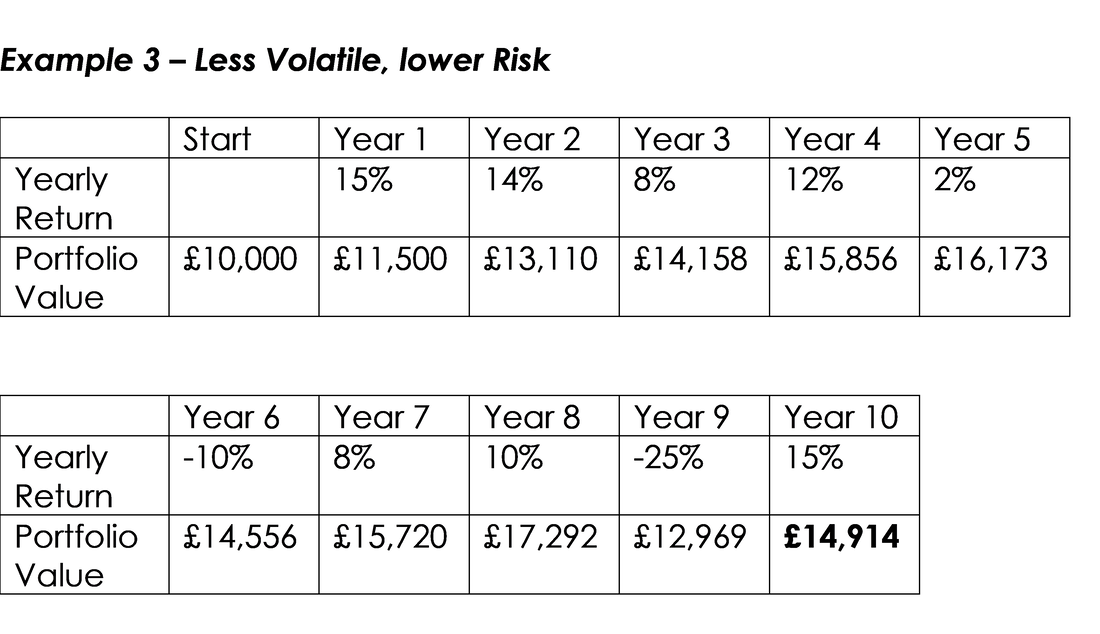
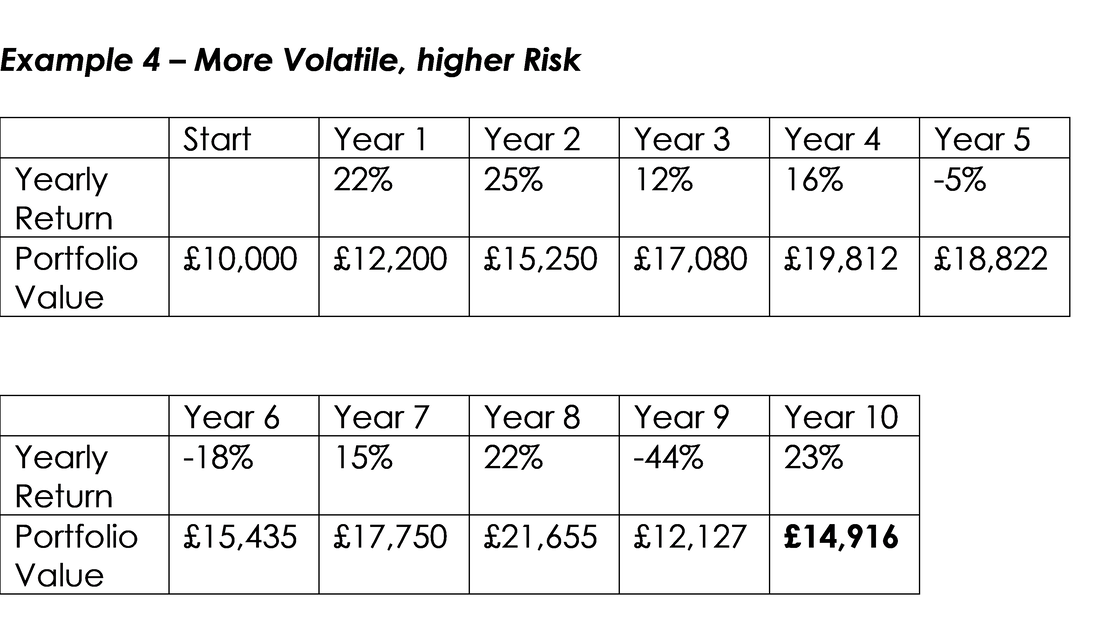
Observations on Example 3 vs. Example 4:
The Danger of a Big Drop in the later Years I am really quite taken by how all those Example Portfolios have failed to even get near to 7% CAGR – I had not expected that at all. I suspect this is because all the Examples include either some pretty big bad years or they have several poor years and those have eroded performance. My earlier thought was that having a Big Drop in later years was a particular problem but having looked closely at these Tables, I am not quite sure how true that is and it might actually be a lot more complex with just a series of small Bad Years being enough to hurt the 10 Year Performance a lot. It is quite eye opening. For myself, the jury is out on whether or not the Big Drop in the later Years hurts more (I would need to think about it a lot more and run a lot more Random Example Models), but what is apparent is that my earlier comments about having 5 Possible Yearly Outcomes and that avoiding the ‘Big Decline’ Years was important, seems to be very much borne out. If the Big Decline Years were removed from these Tables they would probably look a lot better. Let’s try it on the Table in Example 4: 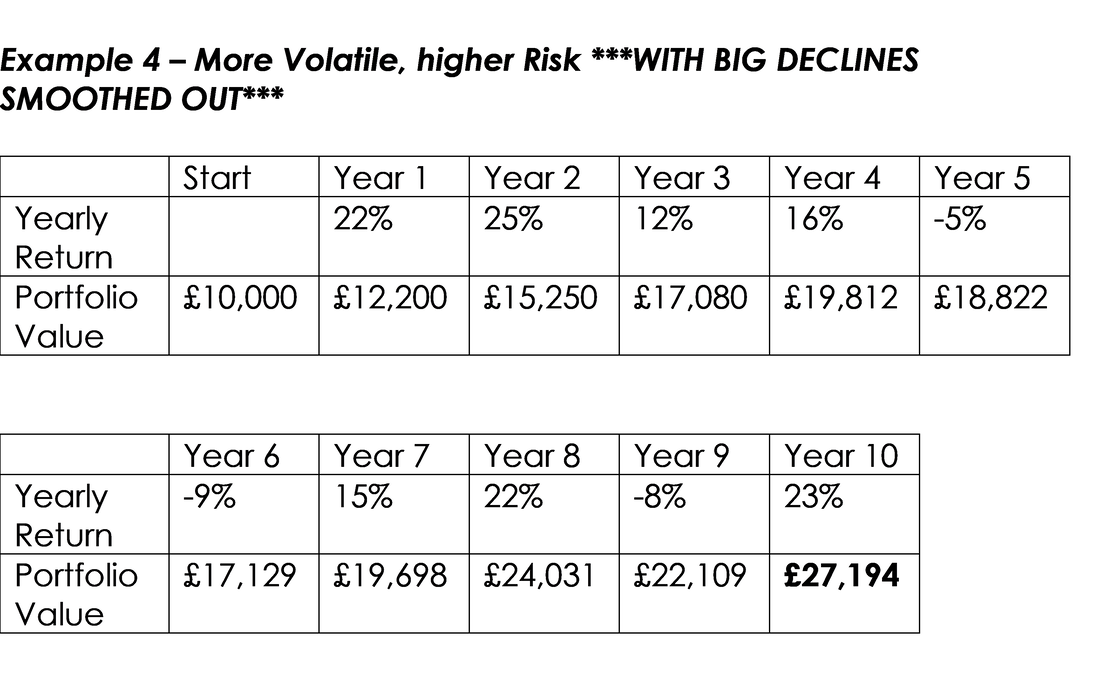
Now I have mucked about here by being quite extreme, but it certainly shows how removing the really Bad Years improves the overall Result for 10 Years hugely. What I did was to change the Year 6 Return from -18% to -9% and I changed the Year 9 Return from -44% to -8%. For both these years we still had a drop but nothing like as extreme was it was before; and the end Result after 10 years is a huge difference.
On reflection, I don’t think this is all that unrealistic – certainly by using Hedging you might be able to reduce an overall Drawdown a lot. When I think back over the years, I’m sure the worst Year I have had in recent years was around 2009 and it was probably down 20% or something – and I was certainly not Hedging much then (although some small Shorts did give me the idea that Hedging in size using the Indexes might be able to help reduce the damage), so for me I think my adjustments are not all that daft. To be clear, I am sure that in 2001 and 2002 I might have suffered a lot more, but those were early days for me and I really didn’t have much clue as to what I was doing, and it was just after the Dotcom Boom went Boom in a big way !! It is by no means conclusive and I have been pushing the envelope on the adjustments I have made, but it certainly suggests that avoiding the really Bad Years can help significantly over time. I leave it to Readers to make of this what they will, and feel free to play around with your own examples. Other Benefits of lowered Portfolio Volatility This blog has mostly been about the impact on Returns but lowering the overall Volatility of a Portfolio can have some other benefits. Firstly, the most obvious is that it helps you sleep at night and is beneficial in a psychological sense. I hold loads of Stocks with a lot of diversification and this reduces Volatility a lot – as a result, when we have those horrible big Market Sell-offs which always come round perhaps as much as once a year, then I don’t get too stressed and I can stay objective and relaxed. I know many people that have large Portfolios in monetary terms but they don’t have that many Stocks, and as a result they can get huge swings in their Portfolios and that would simply stress me out. It is horses for courses to a large extent and about what you are comfortable with. If you are fairly young and have a solid source of decent Income from a good job or something, then you can take more Risk with your Portfolio because you have the years to make it up if you take a big hit and you don’t rely on the Returns from your Stocks to feed the family. To an extent I need to make Money from my Stocks so I cannot take crazy risks. I use a fair bit of Leverage (Gearing) via using Spreadbets where I in effect create a ‘Mirror’ Portfolio out of Spreadbets that copies my normal Shares Portfolio. This Leverage is from borrowed money and if you have too much Volatility in Returns then it can be very difficult (and scary !!) to manage – by tamping down the choppiness I can optimise the use of other people’s money. Lowering the Volatility of your Portfolio means that the size of any Drawdowns is reduced and that gives you the psychological benefits and makes managing Leverage a lot easier. I have included a blog in the ‘Related Blogs’ section regarding Spreadbets. And of course, as we have seen above, big hits to a large Portfolio can really hurt overall Returns over a series of many years, and therefore as your Portfolio grows in value, it makes sense to aim to lower the Volatility and the amount of Drawdown in any bad years. I think in practice most people do this without even thinking specifically about it. You start off in your 20s or 30s or something and of course you have a lot less Capital to start with, and as a result you don’t hold so many Stocks so your Portfolio will be more Volatile. Then as the years drift by and you add Money to the Portfolio and you have some good years, the overall Money invested grows and grows and you naturally buy more Stocks so the number held increases. Such things as reinvesting the Dividend Income and focusing on keeping Costs down will help build the Portfolio as well. Then at some time I suspect you suddenly decide you hold too many Stocks and you start chopping them back !!! That most definitely happened for me and I have seen many mates doing a similar exercise. However, the basis idea of lowering Volatility as your Portfolio grows in value probably makes good sense and it might be worth giving this aspect some serious consideration. Ideal Lockdown Pondering…… Ways to Reduce Portfolio Volatility The most obvious way to lower Volatility of a Portfolio is to hold more Positions. I tend to view this as something that each individual will figure out for themselves over time; and usually when people start out they have less Stocks but as the Pot grows they tend to add more. I am also sure that in time most people end up with too many Stocks and then they start thinking hard about how many they should be holding and I would guess this means they gradually reduce the total number. The type of Stocks you hold makes a huge difference as well. This is quite obvious really – for example, if you were to hold 15 FTSE100 Stocks and some boring stuff like the Healthcare and Supermarkets or something, then it is likely the total Drawdown on the Portfolio in tough times won’t be all that much. This is particularly the case if you have some diversification across sectors; it is no good holding 15 FTSE100 Mining type Stocks (there clearly aren’t that many anyway, although if you include Oil related Stocks you could get to 15), as you would get huge Volatility because they would likely all move together because they would have very close correlations. If you were to hold 15 AIM Stocks, and in that you had a few speculative ones as well, then you could probably see your Portfolio utterly battered in a big Market panic Sell-off. It would not surprise me if your Portfolio were to fall 60% or more, whereas a Portfolio of big FTSE100 Stocks might only fall 25% at the most. As I mentioned, Diversification across Sectors and in particular making sure you have a mix of Stock types in terms of Cyclicals, Defensives, Growth, Value, Momentum etc. will help to lower overall Volatility. In a similar way, if you are to focus on buying Quality Stocks (in essence this means real businesses, that make money, generate Cash, have little or no debt, and are well established with a good track record etc.), then this will reduce your Volatility as well. If you just buy High Risk Speculative AIM Stocks then your Portfolio will have bonkers levels of Volatility and you will be miserable when the seriously moody Market strikes. The other way I use to lower the Volatility of my Portfolio is via Hedging. I usually do this using Index Shorts and I probably keep it to a maximum of about 50% of my Long Portfolio – the best way I find is to not be too greedy, but to just try to lower the damage when Markets go nasty. For example, if my Portfolio was to fall something like 35% without any Hedging, then the sort of degree of Hedging I am aiming for would reduce such a Drawdown to about 20% or something. If you try for perfection and aim for 100% precise Hedging, then experience tells me you will probably get caught out and things will be very painful. Conclusion I’ve found this quite an enjoyable blog to write because it has thrown up a few surprises and made me think about how the mathematics of the Numbers we achieve each year as our Returns, can have quite profound impacts over a period of time, such as 10 years. The first thing that strikes me is just how nasty a big drop can be on your Portfolio and reinforced in my mind the importance of avoiding such big falls in a particular year, and with a focus more towards having only small down years and working hard to even avoid these. I have not really modelled this, and in truth the really bad down years I have shown in the simple models are quite extreme; and from memory, I have never had a bad year myself of such a magnitude – although I suspect if somebody just has perhaps 8 holdings or something, they might open themselves up to some pretty massive falls. Ah, what I was trying to say was that I have not modelled the converse situation where you get a really big year and I suspect that mostly has a similar effect and can hugely boost Returns over a 10 year period; but it will depend on timing in terms of whether the big year comes at the start of the sequence or later on. Which leads me to the other key point I notice which is how the timing of a Bad year can affect the total return over the 10-year period. It seems that a Bad year early on can be recovered from to an extent, but a big Bad year late in the period will do immense damage, with no time to recover obviously. Anyway, it is important to appreciate that these are not real Portfolio Returns and the numbers I used are entirely random and if you run the exercise yourself you will get totally different outcomes. I have probably exaggerated things a bit although I have tried to keep it within the realms of possibility for yearly Returns for my own Portfolio, which has a lot of Stocks. I would recommend that Readers run their own Tables and just see how things come out. Let’s be honest, you are on Lockdown and have naff all else to do !! In truth I don’t think I have really learnt a conclusive determination on whether or not lowering the overall Volatility of a Portfolio will give superior Returns over time, but for myself I am more of the view that I do not like the big drawdowns that we get in moments of panic (like back in March 2020) and for that reason alone I want to hold plenty of Stocks for diversification and also to Hedge to try to reduce the damage and make the angst far more manageable. Part of the reason for this is because I tend to use a fair bit of Long Leverage via Spreadbet Positions where I ‘mirror’ my normal Share Portfolio. The big danger is that if we get too damn scared then we run the risk of making very bad decisions and this could be as daft as selling most of our Portfolio right at the bottom, because we are so terrified and not thinking in a calm, rational, way. You might find that statement amusing now, but believe me, back in March you probably weren’t laughing and I suspect many Private Investors panicked and dumped a lot of Stocks just before the bounce. That is something important to realise about the Human Brain – it is superb at blotting out bad things from even the fairly recent past – but in Investing and Trading that is not necessarily a good thing. On balance, such an ability to forget immense pain can have the advantage that it enables you to keep pushing forwards and taking on the Risks inherent in the Markets. Something I have not considered before but I am just lobbing this paragraph in now shortly before I publish this blog, is that over a longer Time Period than 10 years, the effects of Volatility could be more damaging in certain cases but at least you would likely have more time to correct any big mistakes that occur earlier in the Time Series. I will leave you to think about this, but I suspect if you are making big failures on a shorter Time Period, then those mistakes will be amplified over a longer Timeframe, unless you alter your behaviour. You could of course create an Example Model to test this. So, after playing with this blog and the Models for a while now, I have certainly not changed my view of things much although the ‘Smoothed’ Example which I did at the end of the Models above does suggest that cutting out the really bad years could be very positive for a Portfolio over an extended time period. With this in mind, I see no reason to change what I am doing with regards to my Diversification, Number of Holdings and Hedging when appropriate; but I must say that in recent months/years I have tried to be a lot more selective and careful and fussy about what Stocks I buy; and I am sure that this increase in discipline and consideration has been paying off nicely and will continue to do so. Anyway, plenty there for you to think about whilst in your Lockdown House Arrest, I am sure !! Regards, WD. Related Blogs This is an epic tome about Hedging: https://wheeliedealer.weebly.com/educational-blogs/topiary-time-aka-all-you-ever-wanted-to-know-about-hedging-but-were-afraid-to-ask I wrote these Blogs 6 years ago regarding Position Sizing (but it’s most definitely still valid !!): https://wheeliedealer.weebly.com/educational-blogs/the-wheeliedealer-approach-to-position-sizing-part-1 https://wheeliedealer.weebly.com/educational-blogs/the-wheeliedealer-approach-to-position-sizing-part-2-stocks This Blog talks about how many Stocks to hold etc: https://wheeliedealer.weebly.com/educational-blogs/how-many-stocks-should-an-investor-hold-are-you-drowning-in-stocks-or-is-there-a-drought-in-your-portfolio These Blogs cover Diversification: https://wheeliedealer.weebly.com/educational-blogs/diversification-am-i-enjoying-too-much-of-a-good-thing-part-1-of-3 https://wheeliedealer.weebly.com/educational-blogs/diversification-am-i-enjoying-too-much-of-a-good-thing-part-2-of-3 https://wheeliedealer.weebly.com/educational-blogs/diversification-am-i-enjoying-too-much-of-a-good-thing-part-3-of-3 This Blog explains the ‘Rule of 72’ for doubling: https://wheeliedealer.weebly.com/educational-blogs/the-rule-of-72-and-its-implications-on-our-expectations I was hoping I had already written something about focusing on Quality Stocks but I am not sure I have. However, the ‘Stock Buy Checklist’ below (even though it is more about Blue Sky Stocks !!) includes links to the other ones which are more to do with selecting Quality Stocks: https://wheeliedealer.weebly.com/educational-blogs/stock-buy-checklist-aim-blue-sky-story-stocks Here’s the infamous ‘Bear Market’ Blog which really deserves its place here: https://wheeliedealer.weebly.com/educational-blogs/taming-the-bear-how-i-handle-nasty-markets Here’s a Blog I wrote recently about Spreadbetting: https://wheeliedealer.weebly.com/educational-blogs/the-only-numbers-that-matter-in-your-spreadbet-account
1 Comment
25/1/2023 04:45:53 pm
Leave a Reply. |
'Educational' WheelieBlogsWelcome to my Educational Blog Page - I have another 'Stocks & Markets' Blog Page which you can access via a Button on the top of the Homepage. Archives
May 2024
Categories
All
Please see the Full Range of Book Ideas in Wheelie's Bookshop.
|
