|
Readers who are actually awake might have spotted that I recently stacked the shelves in Wheelie’s Bookshop with countless copies of Kerry Balenthiran’s book - ‘The 17.6 Year Stock Market Cycle - Connecting the Panics of 1929, 1987, 2000 and 2007’.
As I cryptically commented in the text I put with the Book, here is a Guest Blog that Kerry has kindly put together for us which gives a lot more detail and explanation about the subject matter of his Book and it certainly gives something to think about. The last part is particularly worth concentrating on because Kerry shows how his Cycle ties in with many recent events and more crucially he gives a Road Map to a likely future. Kerry is on Twitter as @17_6YrStockCyc and I am sure he will be happy to discuss any connected matters and you can leave a Comment below if need be. Enjoy, WD.
To Understand The Future You Must Know The Past
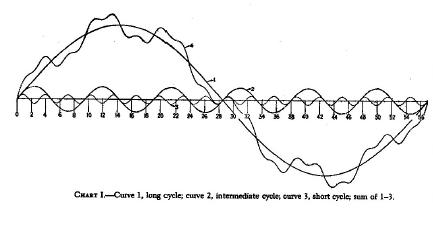
With major equity markets making new all-time highs once again, there is a temptation to think that what goes up must come down and that we are once again on the cusp of a bear market in stocks. Kerry Balenthiran, author of ‘The 17.6 Years Stock Market Cycle: Connecting the Panics of 1929, 1987, 200 and 2007‘, believes the opposite and thinks that we are about to see the long term secular bull market continue through to 2035 !! Now that the FTSE 100 has surpassed its previous highs, a debate has begun about whether we are in a new secular bull market or whether we are still in the secular bear market that began in 2000. The discussion goes something like this: Bulls: "who cares, markets are going up and we are making money." Bears: "yes, but only because the Sterling has fallen 20% since the Brexit vote." Bulls: "who cares, stocks are going up." Nothing is going to get in the way of bulls at this time, not even Brexit, Trump, European elections. The ‘great rotation’ has most people believing that equities will stay high as bond money finds its way into the stock markets. What can go wrong? Historic Stock Market Cycles Booms and busts occur much more frequently than many imagine and by studying historic stock market cycles we can learn a lot about their expected duration and also what to expect along the way. In the late 1800s/early 1900s businessmen and scientists such as Joseph Kitchin, William Stanley Jevons, John Mills, Clement Juglar and Nikolai Kondratieff, to name a few, started to formulate theories about recurring business cycles of various lengths and established the concept of the business cycle. A cycle doesn’t mean that the same exact thing will happen over and over again - a cycle is a sequence of events that repeat over time. The outcome won't necessarily be the same each time, but the underlying characteristics are the same. A good example is the seasonal cycle. Each year we have spring, summer, autumn and winter, and after winter we have spring again. But the weather can, and does, vary a great deal from one year to another. And so it is with the stock market. General interest in cycles wanes during the boom times ("who cares I am making money") only to resurface during prolonged corrections, as economists and investors seek to understand why the usual short sharp recession has not been followed by a recovery. This was true in the 1930s and is the case once again. Business Cycles In the 1930s economists Joseph Schumpeter and Simon Kuznet did much to progress the concept of cycles in innovation and economic development. In his book ‘Business Cycles: A Theoretical, Historical and Statistical Analysis of the Capitalist Process‘, Schumpeter suggests a model in which the four main cycles (Juglar, Kitchin, Kuznets and Kondratieff) are multiples of each other and can be added together to form a composite cycle.
Schumpeter wrote: "But there is no rational justification that the writer can see for assuming that the integral number of Kitchins in a Jugular or of Juglars in a Kondratieff should always be the same. Yet from the study of our time series we derive a rough impression that this is so. Barring very few cases in which difficulties arise, it is possible to count off, historically as well as statistically, six Juglars to a Kondratieff and three Kitchins to a Juglar—not as an average but in every individual case."
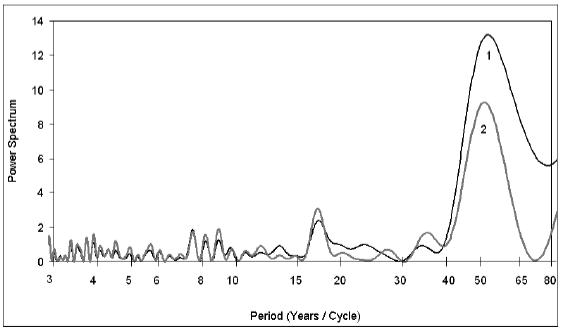
(Source: Joseph A. Schumpeter, ‘Business Cycles: A Theoretical, Historical and Statistical Analysis of the Capitalist Process‘.) Analysis of world GDP growth rates by Andrey V Korotayev, and Sergey V Tsirel identifies cycles of approximately 4 years, 9 years 18 years and 53 years that correspond with Kitchin, Juglar, Kuznet and Kondratieff cycles respectively. (Source: Andrey V Korotayev, and Sergey V Tsirel, ‘A Spectral Analysis of World GDP Dynamics: Kondratieff Waves, Kuznets Swings, Juglar and Kitchin Cycles in Global Economic Development, and the 2008–2009 Economic Crisis‘).
Stock Market Cycles
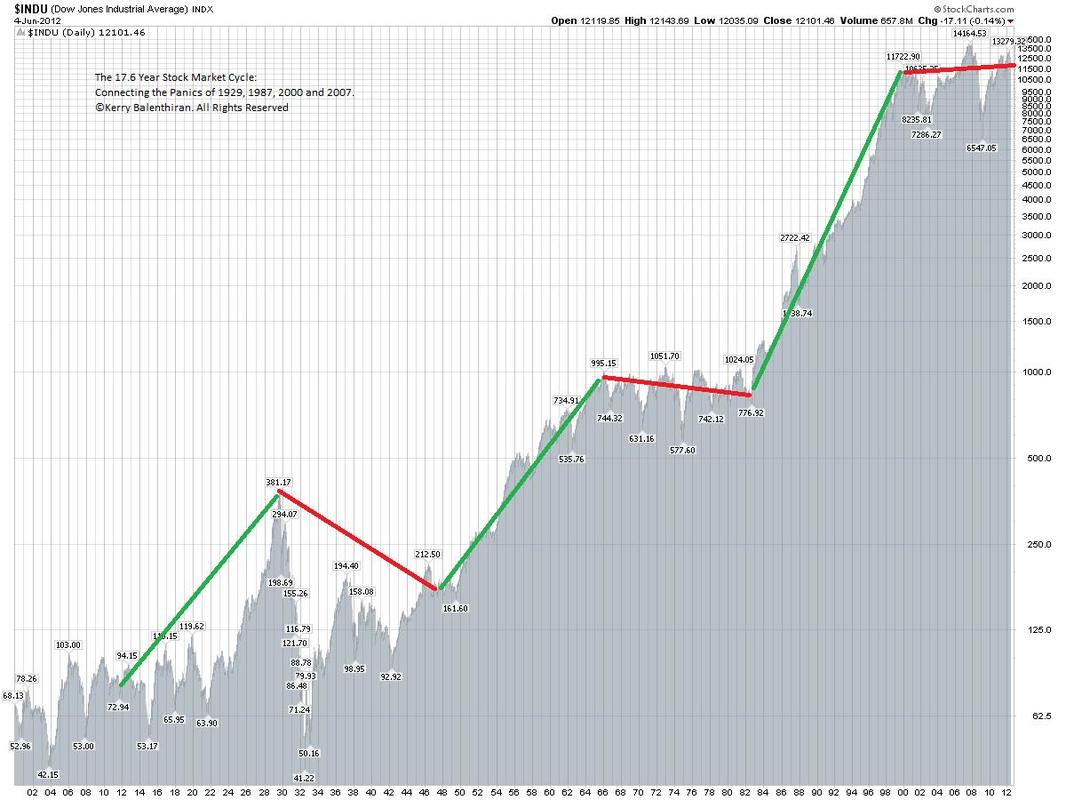
We can see that there is good evidence for regular business cycles of fixed durations but how does this apply to the stock market? JM Hurst was a former NASA engineer who used frequency analysis to identify stock market cycles. The longer term cycles that Hurst identified were 18 years, 9 years, 4.5 years and 3 years - these are described in his book ‘The Profit Magic of Stock Transaction Timing‘. Hurst set out a number of principles of cycle theory and also believed that the larger cycles are multiples of the small cycles. Well known investors such as Warren Buffet and Jim Rogers have both written about 17/18 year stock market cycles and numerous analysts have constructed charts showing 18 year bull and bear market cycles. Cycles of approximately 18 years have been documented by many stock market commentators. The 17.6 Year Stock Market Cycle Art Cashin was, as far as I am aware, the first person to mention the 17.6 year stock market cycle. In an interview on CNBC he mentioned why the bear market would last until 2017. Steven Williams from CyclePro Outlook has also written about the 17.6 year stock market.
(Source: Kerry Balenthiran, ‘The 17.6 Years Stock Market Cycle: Connecting the Panics of 1929, 1987, 2000 and 2000’/Stockcharts.com)
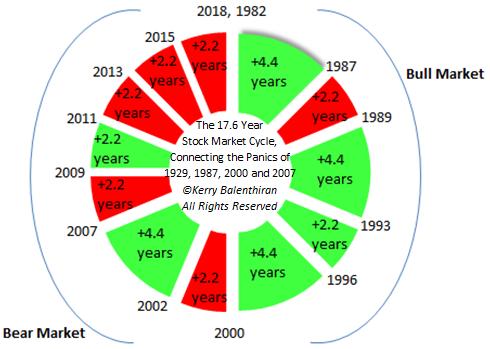
My own research, without knowing about Art Cashin and Steven Williams, also identified the existence of a 17.6 year stock market cycle. When I read about Cashin and Williams I found it incredible that three people could independently identify such a specific cycle. However I have gone a step further, crucially I have discovered a regular 17.6 year stock market cycle consisting of increments of 2.2 years that correspond to major cyclical stock market turning points such as 1929, 1987, 2000 and 2007 and beyond. I have called this cycle, rather modestly (and, after all, it has to be called something), the Balenthiran Cycle. Balenthiran Cycle
(Source: Kerry Balenthiran, ‘The 17.6 Years Stock Market Cycle: Connecting the Panics of 1929, 1987, 2000 and 2007‘.)
The diagram above shows how the Balenthiran Cycle looks for the bull market from 1982 to 2000 and the current bear market from 2000 to 2018. In general cyclical bull markets last 4.4 years and cyclical bear markets last 2.2 years. By studying stock market data going back 100 years I have demonstrated that this cycle works from 1929 to 1947, 1947 to 1965 and 1965 to 1982. I have then been able to extrapolate the cycle forwards to provide a market roadmap stretching out to 2053, which outlines the changing character of the stock market through the different phases of the 17.6 year stock market cycle.
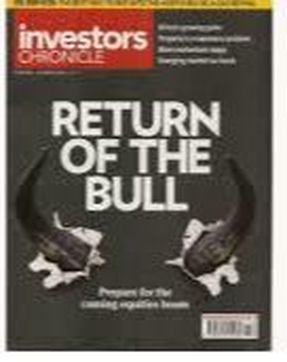
Using the Balenthiran Cycle I forecast that 2013 was likely to see a significant stock market correction that would provide a fantastic opportunity to buy into equity markets ahead of the next great bull market. This formed the basis of my cover story for Investors Chronicle in May 2013. I forecast that current long term bear market in stocks is likely to continue until 2018, but after that we should see another period where equity investment comes back in vogue and buy and hold rules again, just like from 1982 to 2000.
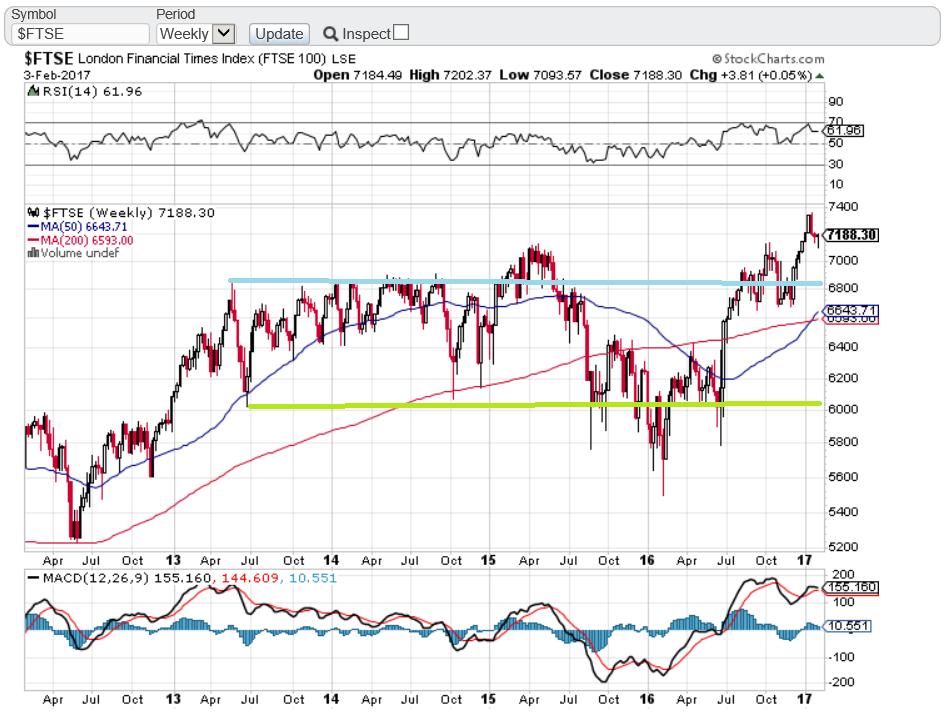
The red cyclical bear markets shown above are just as likely to be a period of sideways performance as they are to be negative performance. Sometimes the low comes early in the 2.2 year period (like 1987 or 2011 or 2013) and sometimes it comes at the end (like 2000-2002 or 2007-2009). By contrast, the green cyclical bull market ends with a market high turning point. The Balenthiran Cycle also shows a significant correction in 2015 and in my book I wrote that I believed that this would be caused by a bottom in commodity markets. I now believe that the 2015-2018 correction which started in May 2015, bottomed in February 2016 and the breakout from FTSE 6954 is indeed the start of the new long term secular bull market. This may seem obvious now, but in 2013 it was a bold call to say that I forecast the market to go sideways for the next 4-5 years, and I now believe that the long secular bear market that began in 2000 is over.
As major world wide stock markets hover around all-time highs and the media is full of articles stating that a new bull market is underway, it is worth remembering that, as we are all aware, stock markets do not go up in a straight line. Investors tend to forget that big falls occur when they least expect them. However I expect a retest of 6954 during 2017 and I am alert to the possibility of one final 10%-20% correction before we say goodbye to FTSE 6XXX forever.
The tendency to expect outsized returns to continue, aka greed, means that people tend to ignore the warning signs and are unprepared for the inevitable change in trend that occurs. This happens on the way down as well as up. By being aware of long term secular cycles as well as the intermediate cyclical turning points, investors will be better equipped to ensure that they have the right strategy for the prevailing stock market conditions. The good news is that a new secular bull market from 2018 to 2035 is very close by. Buy and hold will work once again and the rising tide will lift all boats, just like in the period 1982 to 2000. We are a long way from mass participation in the stock market that truly signifies a stock market bubble top. Kerry Balenthiran
5 Comments
mr catflap
11/2/2017 06:39:41 pm
Pretty bold call. The concern for long term investors must be that the cyclical bust has not been allowed to play out fully. Equity valuations are not trading at bargain low values like at the start of the other bull runs (1947,1982) and debts are higher now that at the top of the boom. With the clowns running the central banks, anything could happen from here really.
Reply
WheelieDealer
13/2/2017 09:26:30 pm
Hi mr catflap, Thanks for your thoughts. No doubt it does seem very brave to be calling the start of a multi-year Bull Market and of course it is so difficult to predict. I guess what I find interesting is a confluence of factors that all point the same way - i.e. Trump Expansionary Policy, Stockmarket breakouts and Kerry's Cycle Analysis.
Reply
Kirk Cornwell
29/7/2017 04:00:06 pm
I find Kerry's work fascinating and essentially "on the money" but I wonder about his choice of DJIA as his main measure. It is no secret that the components of this index are changed fairly often to make the Dow 30 "current", often picking up relatively "hot" stocks. Will this alter "cycles" or make them more pronounced. Interested in anyone's take.
Reply
Kerry Balenthiran
4/8/2017 05:46:20 pm
Hi Kirk, pleased to hear you like my work, thanks for the great feedback. I chose the Dow 30 as it is the oldest index mainstream index that I could get data stretching back to 1900. The fact that it is only 30 stocks is not of a concern to me as I am interested in the peaks and troughs of price, rather than the absolute value. The index will change to reflect current economic activity, but when the Dow goes down, so does the S&P 500 and FTSE 100 etc, generally speaking. You can think of my cycle as a cycle in greed and fear (sentiment) and it impacts the UK/US indices in the same way. So, to answer your question:
Reply
18/3/2021 10:19:22 am
The site is really amazing and the knowledge you share with me is just fantabolous . I really appreciate your efforts.
Reply
Leave a Reply. |
'Educational' WheelieBlogsWelcome to my Educational Blog Page - I have another 'Stocks & Markets' Blog Page which you can access via a Button on the top of the Homepage. Archives
May 2024
Categories
All
Please see the Full Range of Book Ideas in Wheelie's Bookshop.
|


