|
THIS IS NOT A TIP OR RECOMMENDATION. I AM NOT A TIPSTER. PLEASE DO YOUR OWN RESEARCH. PLEASE READ THE DISCLAIMER ON THE HOME PAGE OF MY WEBSITE. IF YOU COPY MY TRADES, YOU WILL PROBABLY LOSE MONEY.
Earlier today I bought more Glencore GLEN at 285p via a Spreadbet - I already hold quite a few and felt a need to add to my collection. The thinking behind this was as follows (note this is only high level stuff and not comprehensive or particularly detailed):
Main Risks:
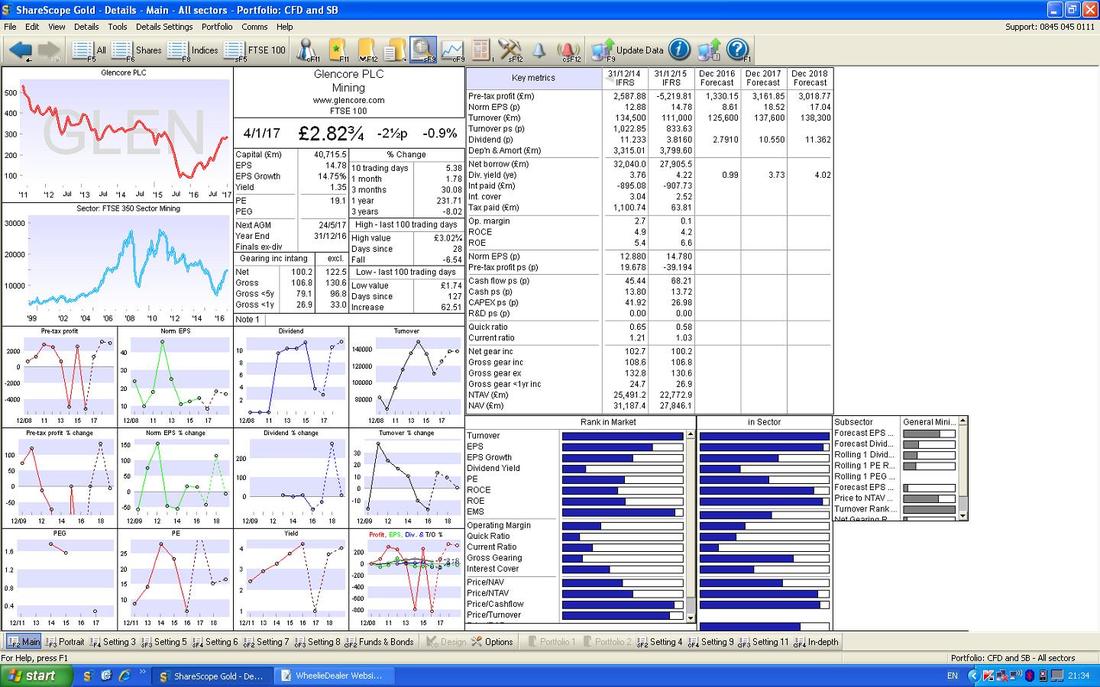
Valuation The Screen below is from the ShareScope Software I use and is as things were on the Night of Wednesday 4th January 2017 when I made my Decision to buy more GLEN. As ever, I had been thinking about buying more GLEN for some weeks and I have been ‘stalking’ the Share Price for a decent Entry Price and hopefully I have timed it OK. If you look in the Top Right Hand Corner, you should see ‘Norm EPS (p)’ for ‘Dec 2017 Forecast’ of 18.52p. On my Buy Price of 285p, this gives a Forward P/E Ratio of 15.3 (285p divided by 18.52p). This might appear reasonable value and I suspect many Market Punters will just take that on face value and think it is a decent buy. However, with these kind of Stocks it is very difficult to Value them accurately - the Consensus of Brokers/Analysts (and remember most are 12 years old !!) will have come up with the 18.52p number but it is entirely guesswork. The simple fact is that it is all dependent on the Underlying Price of Commodities (OK, it also depends on some other factors like how much ‘stuff’ GLEN actually digs out of the ground, etc.) and that is essentially unknowable. Anyway, those are the numbers and make of them what you will - but bear in mind that with how Commodity Prices change so fast, the Earnings GLEN actually makes could be largely higher or lower than these numbers. Anyway, of more interest really is the Dividend - at least the Management of GLEN might be more driven to actually deliver what they are guiding the Market to here. If you look at ‘Dividend (p)’ for ‘Dec 2017 Forecast’ then you should see a figure of 10.550p. On my Buy Price of 285p, this gives a Forward Dividend Yield of 3.7% (10.550p divided by 285p multiplied by 100%). For the reasons I just stated, there must be a fair chance GLEN will deliver this so that wouldn’t be a bad Yield although this is really a play on Capital Growth and Share Price Momentum.
Technicals
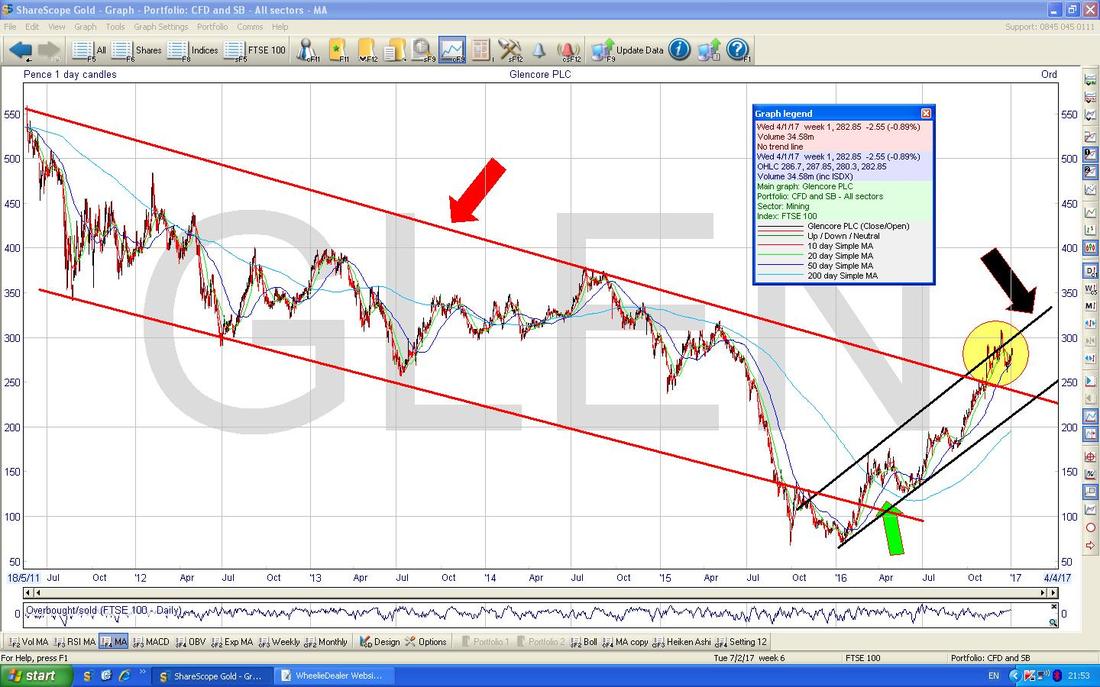
The Chart below is the ‘Big Picture’ view and as I have probably drummed into Readers’ addled Brains by now, it is always correct and proper like to start off with the Wider View when delving into the Charty stuff. This is the Daily Candles for GLEN going back about 5 years or so and the main feature here is the Downtrend Channel which I have marked with my Parallel Red Lines and pointed at with my Red Arrow. Look how this was in force for almost all of the Chart but in Early 2016 we seem to hit the Low Point and an Uptrend Channel which I have marked with my Black Parallel Lines and Black Arrow has been in force ever since. My Yellow Circle marks the recent Price Action and how the Price broke-out from the Downtrend Channel back in Early November 2016. Another important happening on this Chart is marked with my Green Arrow. This is where we had a ‘Golden Cross’ between the Darker Blue Wiggly Line which is the 50 Day Moving Average and the Lighter Blue Wavy Line which is the 200 Day MA - in this case the 50 crossed the 200 from underneath and this is a very Bullish Development for the medium term. Note that since that Golden Cross, the 50 Day MA has been nicely above the 200 Day MA and both are rising - this is sweet and what we wanna see. Remember, all these Charts are exactly as they were last night (4th January 2017) because I want to show my Decision process for Buying.
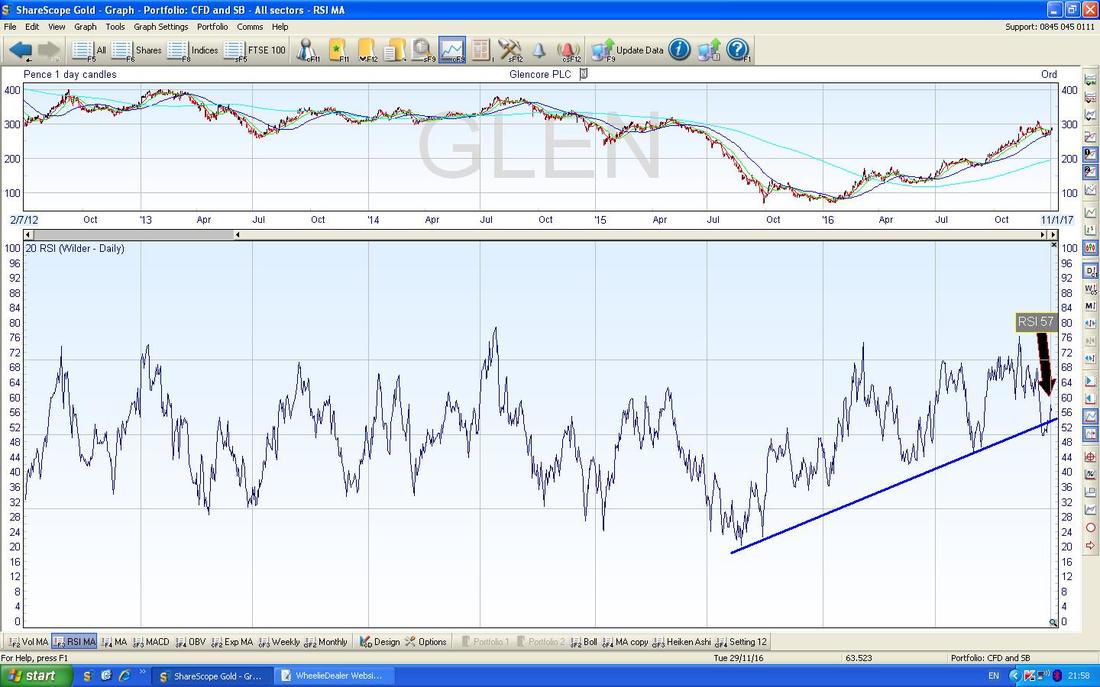
In the bottom window on the Chart below we have the Relative Strength Index (RSI) for the Daily Candles on GLEN. With a reading of RSI 57 it is not particularly high and note how it is turning up from that Blue Uptrend Line I have drawn in. I’m liking this.
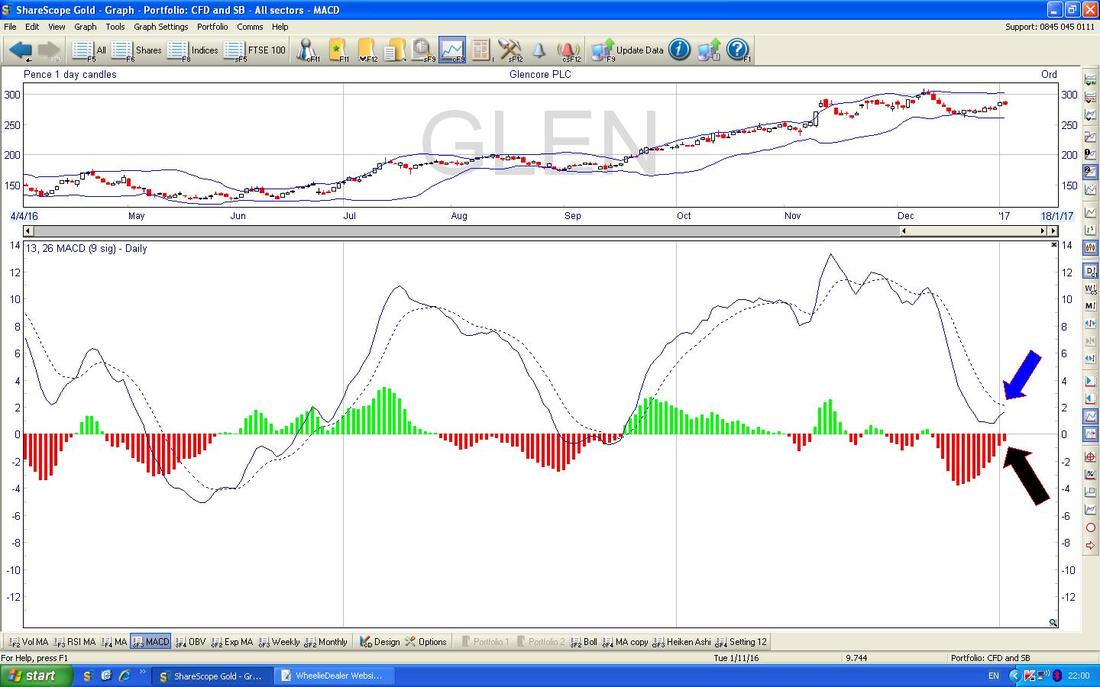
In the bottom window below we have the MACD (Moving Average Convergence Divergence) for GLEN Daily - note how we are very near a Bullish MACD Cross - this is shown in the Signal Lines format where my Blue Arrow is and via the Histogram Bars where my Black Arrow is.
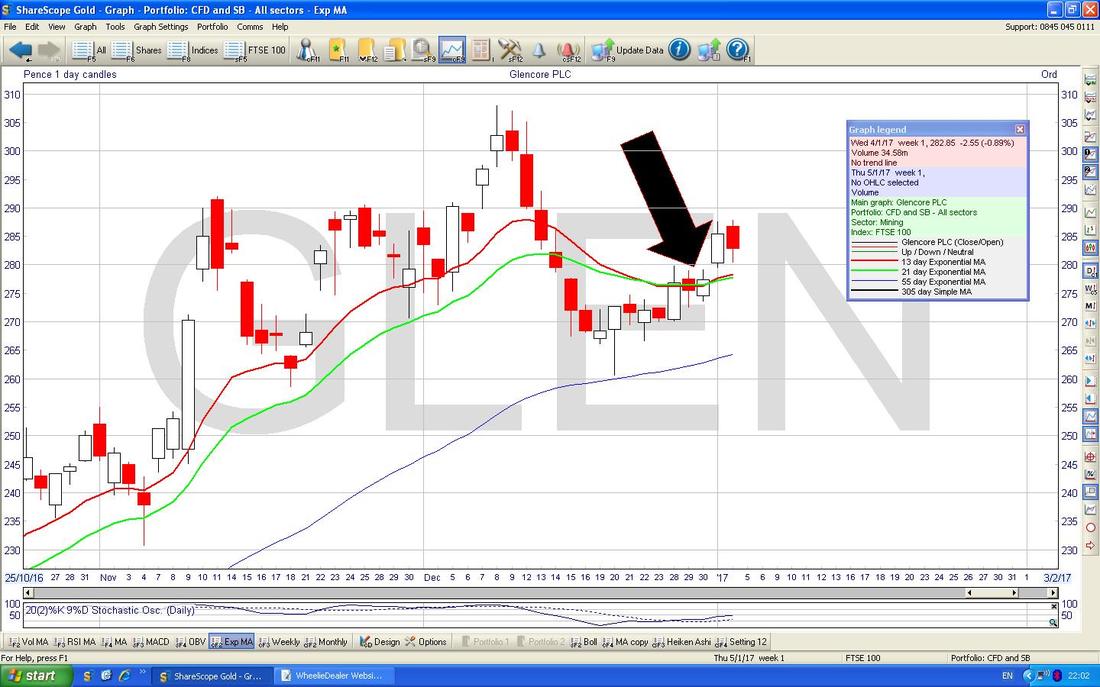
On the Chart below my Dirty Huge Gert Black Arrow is pointing to where we have a Golden Cross between the Red 13 Day EMA (Exponential Moving Average) and the Green 21 Day EMA - when these happen, we tend to get a few weeks of gains. By the way, an Exponential Moving Average is where a Moving Average is calculated but with more Weighting given to more recent Prices - so it tends to be more ‘timely’ than a Simple Moving Average.
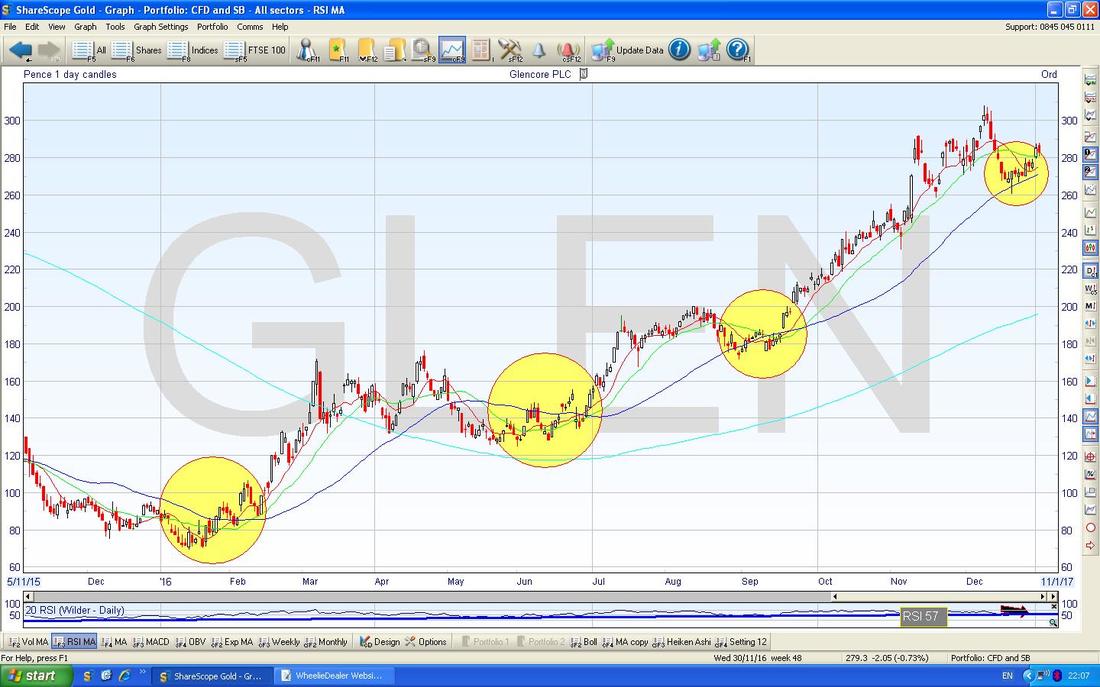
On the Chart below my Yellow Circles are attempting to point out how over the last year the Price of GLEN has tended to move Upwards off of the Blue Wavy Line which is the 50 Day Moving Average. This was a key factor in my Buy Decision as clearly we have done that yet again.
I also want to add that just before where my Yellow Circle in the Top Right Hand Corner is, the Price made a new Peak up around 310p and then I tracked it as it fell down again and I was waiting for it to start to turn up again as the Buyers got the upper hand again.
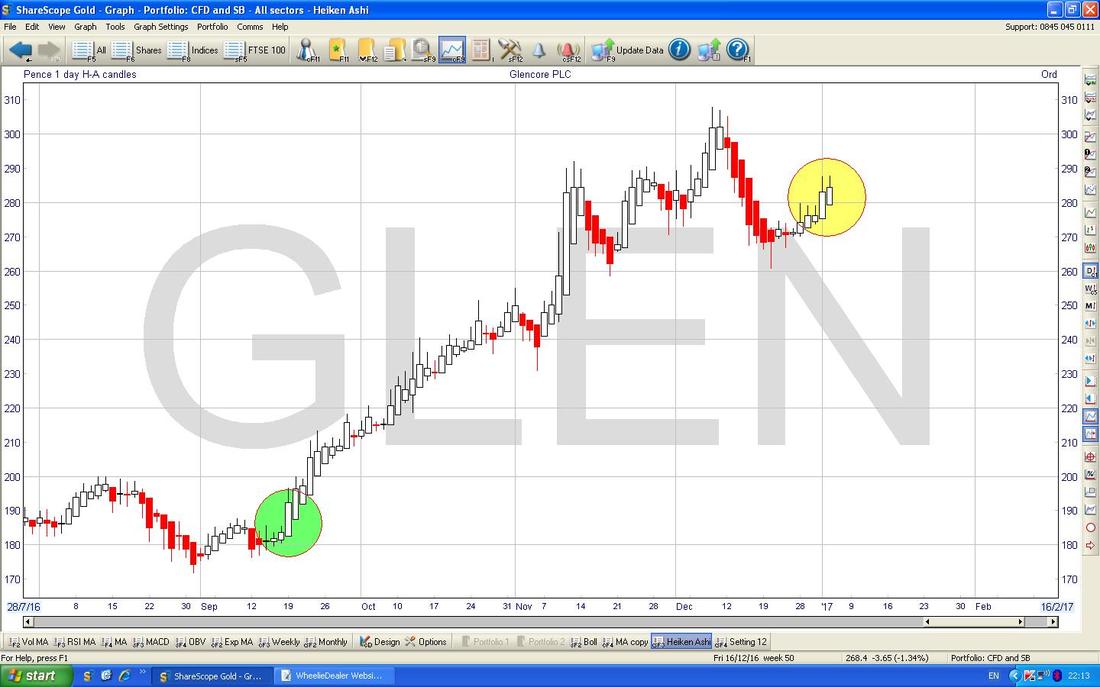
The Chart below has the Heiken Ashi Candles - as you may know I am really getting to like these gorgeous little devils as they give really clear Signals to Buy and Sell and I find they are particularly good for ‘Cutting out the Noise’ and keeping me in a Trade when I would otherwise be tempted to Sell.
My Yellow Circle pretty much envelopes were we have had some Small White Up Candles that have started to grow bigger as the days have passed - this is nice Bullish behaviour. Note my Green Circle which shows where a similar sort of thing occurred. Of course there are no Guarantees and all Charting/Technical stuff is probabilistic, but the Seaweed and Pigs Entrails look promising on GLEN…….. Right, that’s enough, I am bored senseless of it now…… Oh, before I forget, in terms of a Target I am thinking 400p must be quite possible and perhaps if the Trumpflation Trade has legs, then maybe as much as 500p could be on the cards - it’s pretty hard to tell really but at the moment GLEN looks to be going up and I want to be riding it quite heavily. Cheers, WD.
2 Comments
Jean black
10/1/2017 03:10:26 pm
Very interesting, keep up the good work
Reply
WheelieDealer
16/1/2017 08:38:13 pm
Hi Jean, thanks for the feedback. GLEN trade working out nicely so far :-), cheers WD
Reply
Leave a Reply. |
'Educational' WheelieBlogsWelcome to my Educational Blog Page - I have another 'Stocks & Markets' Blog Page which you can access via a Button on the top of the Homepage. Archives
May 2024
Categories
All
Please see the Full Range of Book Ideas in Wheelie's Bookshop.
|


