

|
educational blogs |
|
I probably didn’t hear it - I have had some sort of problem with my Left Ear for a while and I have been shoving that Earex Olive Oil stuff in it for about a Week and now I am at the stage where I am still partially deaf but I am not sure if the Ear is the problem or if it is because it is full of Oil !! I think it is time to stop pouring Mazola into my lughole.
Stoplosses are such a funny subject area - there is nothing like it to provoke a heated and busy discussion on Twitter and I merely mentioned that I was thinking of writing a Blog related to this and it kicked off a torrent of Tweets on Friday !! Anyway, I have produced a decent Draft of the Blog and I will mention that more in a bit.
I’m a bit irked today because I thought I had pretty much completed all the Painting and Sanding and suchlike on my BMW and now it was ‘just’ a case of Polishing the Lacquer Clearcoat layer with T-Cut to get it shining and looking nice. To this end I actually invested £25 in a Cordless Polishing Machine thing which hopefully will turn up in a few Days and that should enable me to make better progress. I am finding that on most of the Areas I have tarted-up I can polish them well by hand (the issue is that they need to be ‘buffed’ quickly rather than just rubbed a bit) but I am struggling with the Panel at the Rear partly because it is by far the largest Area and also because being a Wheelchair User I can’t position myself in a way that I can easily shine it up.
Anyway, I felt like I was making progress but in recent Days of polishing I have noticed on a bit at the Front of the Bonnet (by the BMW Badge so it is right in your eyeline) where it has sort of gone silver as I polish and I suspect I have pressed too hard and actually gone through the Lacquer and have now exposed the Paint Layer - it is a nuisance and I suspect I will have to repaint and re-Lacquer it which is annoying. The only positive is that it is a small Area and I don’t think I will need to sand it back to the Bare Metal or anything and I can skip the Primer Layer - I have not totally decided but I am heading in the direction of having to re-do it but that is also weather-dependent. Ugh. On the subject of Cars, I received an Email a couple of Days ago saying that my New Leon Cupra has a ‘Build Slot’ at the Factory in Barcelona in September - so it looks like I might be getting it in October which is a little bit earlier than I expected. It is not ideal to get it just before Winter but at least I might have a few Weeks to play with it before the Weather gets pants. WheelieBash Saturday 15th September At last I have got it confirmed that the WheelieBash will be held in my preferred Location which is the same as last Year in the White Hart at Winkfield near Windsor. I have not yet had time to amend the Text on the Homepage but if you go there you can see all the other details and I had assumed that the White Hart would be available anyway. Everyone is welcome and there is no charge to turn up or anything but it would be great if you can let me know you are coming because we are limited to about 40 People and it is filling up fast. Last Week What a strange Week - I suspect a jump up in On The Beach OTB helped me a lot and somehow I managed to limp out with a Gain of 0.2% for the Week on my Portfolio. My US focused Unit Trusts were Flat on the Week with not much changing in the Currency side of things I guess. What really surprised me was that Wednesday seemed a really bad Day so ending up slightly ahead has turned out rather well. A typical August sees the first few Weeks being rubbish and then a Rally in the last 2 Weeks - we are now on the dawn of that final half of the Month so it strikes me as very likely that the Seasonal Pattern will be followed again and of course any move up as August closes out would set-up the usual Seasonal Pattern of September being flippin’ awful and Markets falling for 4 consecutive Weeks - it would be silly to ignore this Pattern I suspect and therefore my Strategy of doing very little is going to continue and if anything I will be looking to Sell a bit and increase my Cash Levels - with some recent Trimming and with the Esure ESUR Takeover looking pretty much done, my Cash Levels are pretty decent now and I am feeling quite well prepared for the worst part of a typical Year and of course we have the Brexit worries as well and the US Midterm Elections are on the way. I will of course be looking to Short an Index to Hedge if I see an Opportunity. Quote from Chris Dillow I was reading this Week’s copy of Investors Chronicle earlier today and on Page 16 Chris Dillow has the usual Article (’Beating the Professionals’) about Disadvantages and Advantages that Retail Investors and Fund Managers have. It is well worth reading and largely a rehash of stuff Chris has written many times before, but there are some important messages in it. Anyway, this bit hit me as it chimes with my own thinking and I thought it was worth chucking in this Weekend’s Blog: ‘Even if stock markets are inefficient they are not so much so that they throw up big and obvious mispricings very often. This means that hard work doesn’t necessarily pay. If there are no mispricings, no amount of hard work will uncover them any more than hard work digging on Skegness beach will strike oil. Investors should therefore spend most of their time doing nothing but research, thinking and waiting. People who are stuck in offices are less able to do this; they feel obliged to look busy. Retail investors however, are better able to do nothing.’ It is my Bold Text which I have done to emphasise the Key Point and more and more I realise the importance and the value in this (it is also much easier !!). As an aside, any bets on how long it will be before we see a new AIM Listing which is an Oil Exploration Company operating on Skegness Beach ?!!! A Ramper’s delight (didn't the Sugar Hill Gang do a Song about that?). Blog Slate In the Week just gone I published the Final Part of the superb Guest Blogs on Short Term Trading kindly supplied by @vilage_idoit - even if you are not interested in a Short Term kind of Approach, this is well worth reading as there are lessons and principles that apply whatever your timeframe - and in addition it is extremely well written which is unusual as this is Michael’s first effort (go back and look at my First Blog and you will see what I mean !!!). Seeing as things are a bit quiet on the Markets at the moment (pretty normal this time of year), I will probably publish a Blog this Week that has nothing to do with Stocks. If you are in the habit of reading my Weekend Blogs then you might recall a few Weeks ago I included a Link to a Video of an appearance I did on Top Gear many years ago in a piece called ‘The World’s Fastest Disabled Driver’ and I have since written a Blog which talks about how the Filming went and then the bit we did in the Studio. I suspect Readers will find it quite funny in parts. Last Night I wrote a fairly complete Draft of a Blog about ‘The Diminishing Problem’ which relates to how when you get a Stock with a Falling Price (for whatever reason), the damage it can do to your Overall Portfolio reduces as it Falls - this is something that amazingly gets very little coverage (in fact, I have never ever read anything about this and it was only once on a Bulletin Board that I saw some Random Person actually make this point) and I think Readers will find it very interesting. Of course it relates to the Stoploss or not Stoploss Debate and it was me mentioning this that kicked off the Twitter torrent on Friday. I will see how things go but I am keen to get this Blog out because it is so unusual so maybe I can finish it off for 2 Weeks time. Other than that I have loads of part written Drafts now so there will be a good flow of stuff in coming Weeks. Jumping into the Tardis Following on from the Twitter Debate on Stops I noticed someone had sent me a Direct Message which I have not fully read and responded to yet about Position Sizing. To pre-empt this DM, I am chucking in these Links which are with regards to some Position Sizing Blogs I bashed out years ago !! http://wheeliedealer.weebly.com/blog/the-wheeliedealer-approach-to-position-sizing-part-1 http://wheeliedealer.weebly.com/blog/the-wheeliedealer-approach-to-position-sizing-part-2-stocks 3 Technically similar Situations In recent Weeks/Months, several of my Stocks have been in determined and relentless Downtrend Channels and the Power of Negative Momentum has clearly been in evidence. However, in 2 of these Situations the Downtrends have broken with rather pleasant outcomes - first off we have Esure ESUR which last Week received a Takeover Bid. As ever the Charts that I show are taken from ShareScope and if you click on them they should get bigger so you can see more detail. On the Chart of ESUR below the Downtrend Channel between my Black Lines (marked by the Black Arrows) must be easy to see and note how this Channel corralled the Price as it drops downwards and it had got to quite an Oversold Level where the Forward Dividend Yield was up to something like 7% + and I flagged on Twitter a lot that this looked overdone. As it happens I was spot on because they got the Takeover Bid and jumped 32% or so - despite a pretty weak Trading Update. When the Bid came in the Downtrend Channel obviously broke where my Yellow Circle is. Note where my Pink Circle is that there was a Bearish ‘Death Cross’ between the 50 and 200 Day Moving Averages - and as you would expect, this predicted further falls which duly arrived. 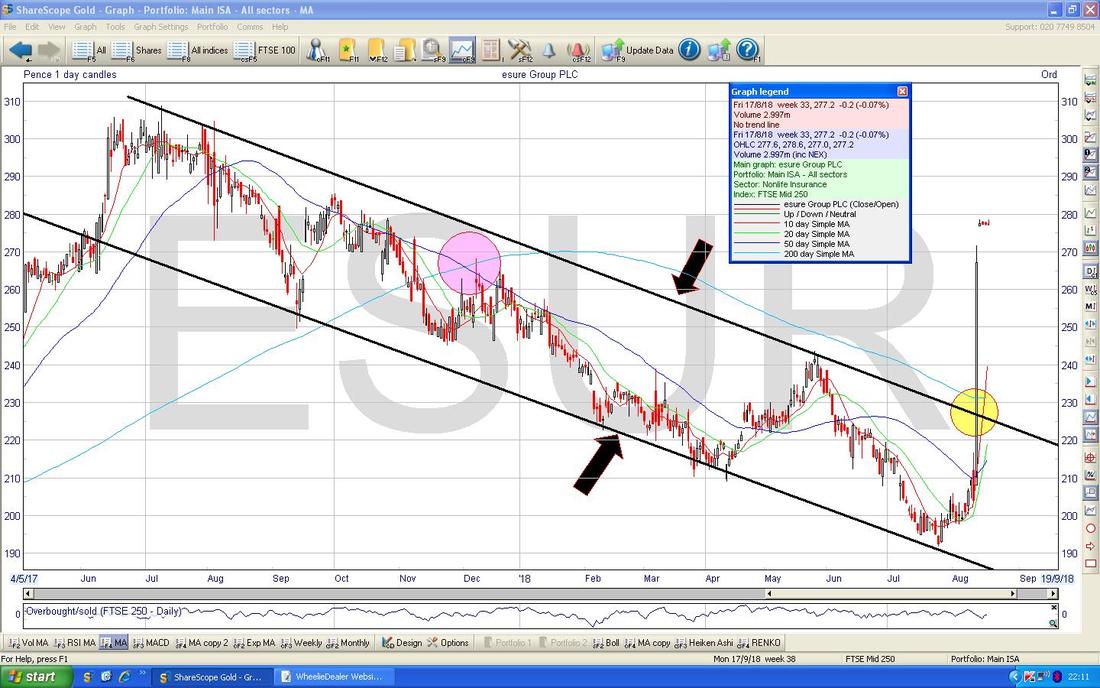
On the Beach OTB
The Chart below has the Daily Candles for OTB and again we had a bit of a Downtrend going on and my Black Line (Black Arrow) marks a Downtrend Resistance Line. Last Week OTB came out with a mixed Trading Update which said they were “Broadly in Line” with Expectations which would often cause a drop in the Share Price (especially because Revenues were down) but at the same time they announced an Acquisition which they say will be “Earnings enhancing”, and as a Result the Shares jumped up and Broke-out of the Downtrend Line where my Yellow Circle is. Where my Green Arrow is there is a Bearish ‘Death Cross’ between the 50 and 200 Day Moving Averages and this predicted some Falls and of course we might fall further from here - we need the Price to hold up around the current Level or to move higher in order to get the 50 Day Moving Average Line to flatten out and start moving up itself - technically this Chart is a bit mixed I would say but the jump up last Week hints that things could improve from here. From a fundamentals point of view I really like OTB and the expansion into Scandinavia is particularly positive and this recent Acquisition looks very shrewd. I still think we are at the early stages of much of this Internet stuff and a lot of Holidays etc. are still bought in High Streets and suchlike and the potential for OTB to expand is significant. On a Forward P/E of 18.1 and nearly 1% Forward Divvy these are not bad numbers and bear in mind OTB has a lot of Cash and there is a chance of Upgrades following that Acquisition. On the downside, the drop in Revenues is not so good but some of this looks short term and it is interesting that as their Revenues fall, their Costs do as well so the Profit stays up. 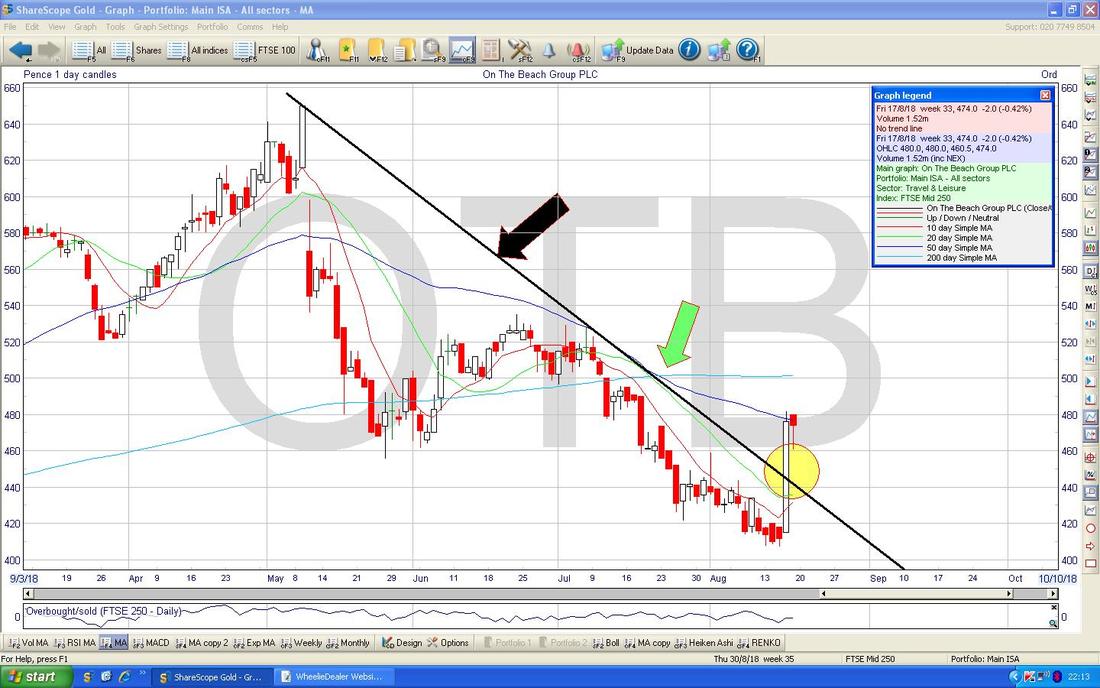
The other aspect of note on both these Stocks is that if I had used Stoplosses, I would have missed out on the ESUR bid in the first example and in the example of OTB it is a Stock that I want to hold for the Long Term and a Stoploss would merely kick me out of a Stock that I expect to make me a lot of Money over the next few Years - of course there are no guarantees of this but that is the essence of Long Term Investing - you buy Great Stocks and you stick with them. Anything else is ‘Trading’.
Here is another where a Stoploss would have kicked me out (OK, that could turn out to be a good thing but somehow I doubt it and this is another one that I want to hold Long Term as the potential is huge). On the Chart of Hostelworld HSW below, we have a similar situation to ESUR where it is clearly in the Downtrend Channel as marked by my Black Lines but it looks to me like it is overdone and HSW represents very good value here. Where my Yellow Circle is the Price is now at the Top of the Downtrend Channel and we need it to Breakout if the Price is going to recover some lost ground - this could happen soon or of course it could continue falling. Yet again note the Pink Circle which marks a Bearish ‘Death Cross’ between the 50 and 200 Day Moving Averages. The interesting thing about HSW is the way the Business Model works which is extremely Cash Generative. When a Punter signs up for a Hostel (or a Hotel because HSW does have some Hotels on its Website), HSW takes a 10% Deposit and HSW keeps that Money. The Punter goes on their Holiday or whatever and stays at the Hostel and they pay the Hostel for their stay. So HSW gets all their Money upfront. On Fundamental Numbers, HSW is on a Forward P/E of 16.5 and a Forward Dividend Yield of 4.8% and they have a lot of Cash and a Special Dividend is very possible (note that the Forecasts I have seen are in Euro Cents - so you need to convert but SharePad already does the conversion for you). Yet again a Stoploss would have kicked me out of a highly attractive Stock which I suspect will deliver very good Returns for me in coming Years - and in the meantime I get paid handsomely with that Dividend while things play out. It is also worth considering that combining the Technical Situation along with the Fundamentals can work very well to pinpoint Opportunities. Somewhere in my Blog Archive you should be able to find Buy Rationale Blogs on both HSW and OTB. 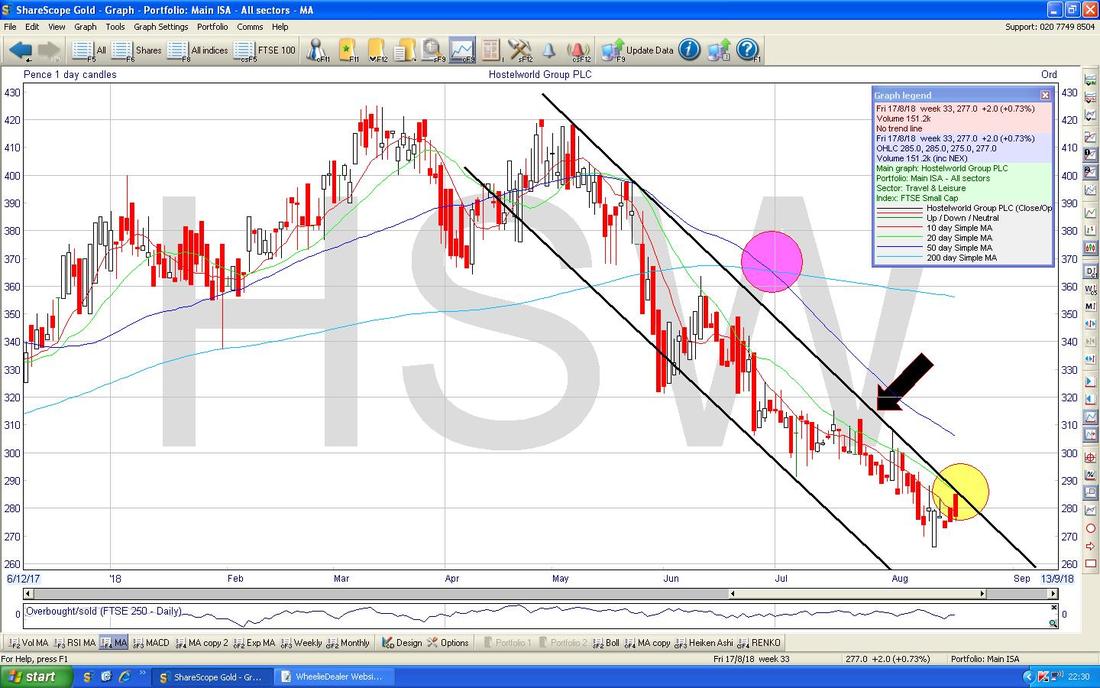
Time is ticking on but let’s just quickly look at some Index Charts before I knock this on the head.
Dow Jones Industrials Index This looks quite Bullish really. First off note that the 50 and 200 Day Moving Average Lines are both rising. Next look at my Blue Arrow which is pointing to the Upper Blue Line which seems to be part of an Uptrend Channel with the Lower Blue Line. My Yellow Circle is catching an Up Candle from Friday which looks like it just about got over the nearby Peak from where my Red Arrow is - that is important to have got over a previous Resistance Level. Next up there is Resistance at around 25800 and then up at 26000 and above there is a Zone of Resistance which might be difficult to wade through - especially with us approaching the Worst time of the Year. 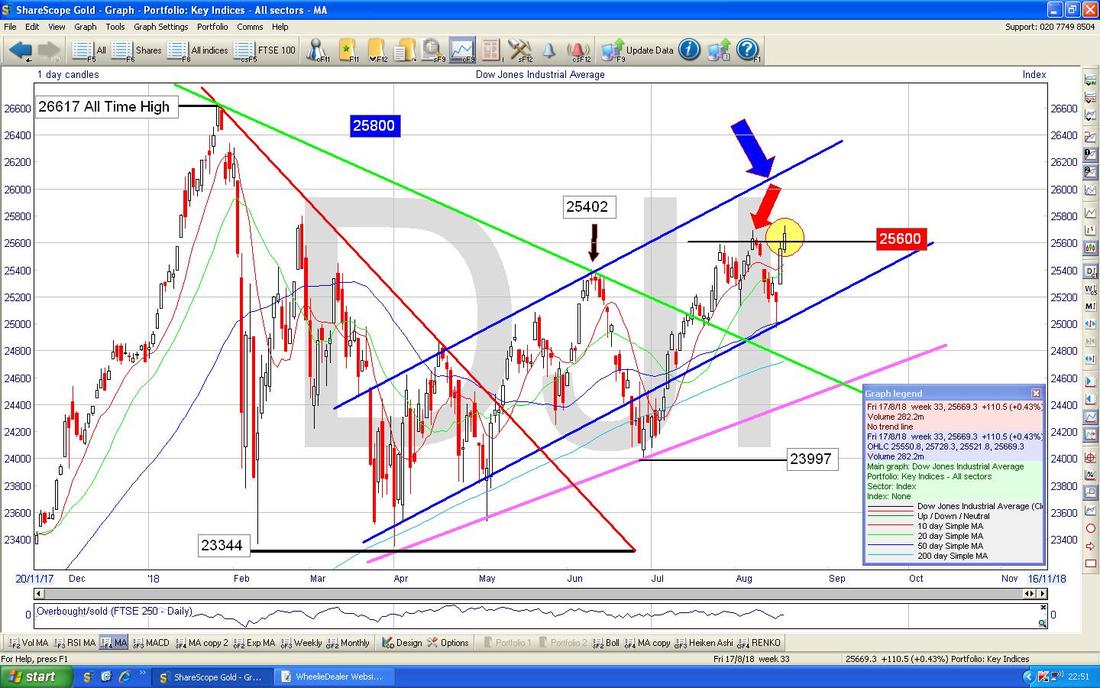
The S&P500 looks very similar to the DOW and the Nasdaq is doing its own thing but also looks very Bullish.
FTSE100 It looks to me like the FTSE100 is chopping around within a Sideways Range with roughly 7500 at the Bottom and 7700 to 7800 being the Top. The crucial thing is that 7500 and just below holds as Support and in particular the 200 Day Moving Average which is marked with my Black Arrow on the Chart below. If we drop below that, then the next Support is down around 7326 and down to the worst case 6866 - fingers crossed we won’t be going that low and at the moment there are no clear signs that is going to happen. My Red Arrow is pointing at where we had the Big Red Down Candle last Wednesday and then on the Thursday we had the Smaller White Up Candle and the 2 combined formed what looks like a Bullish Harami Pattern. On Friday we got a pretty indecisive looking Candle and if we are to rise from here then we need a good rise on Monday really to show things are moving up again off that Harami. 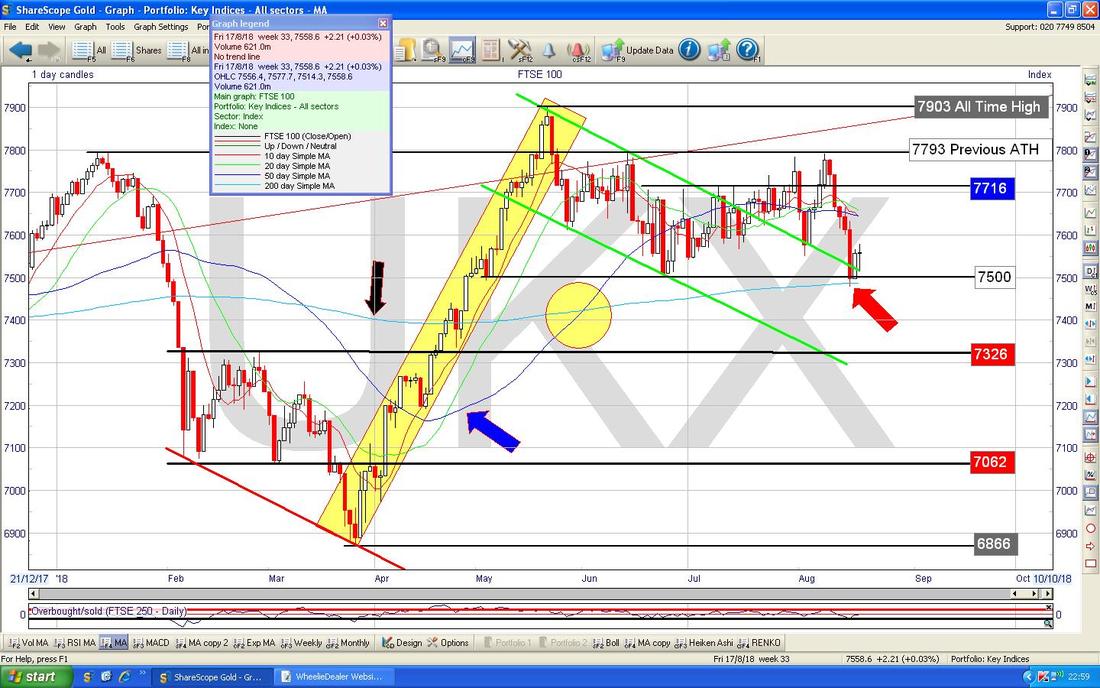
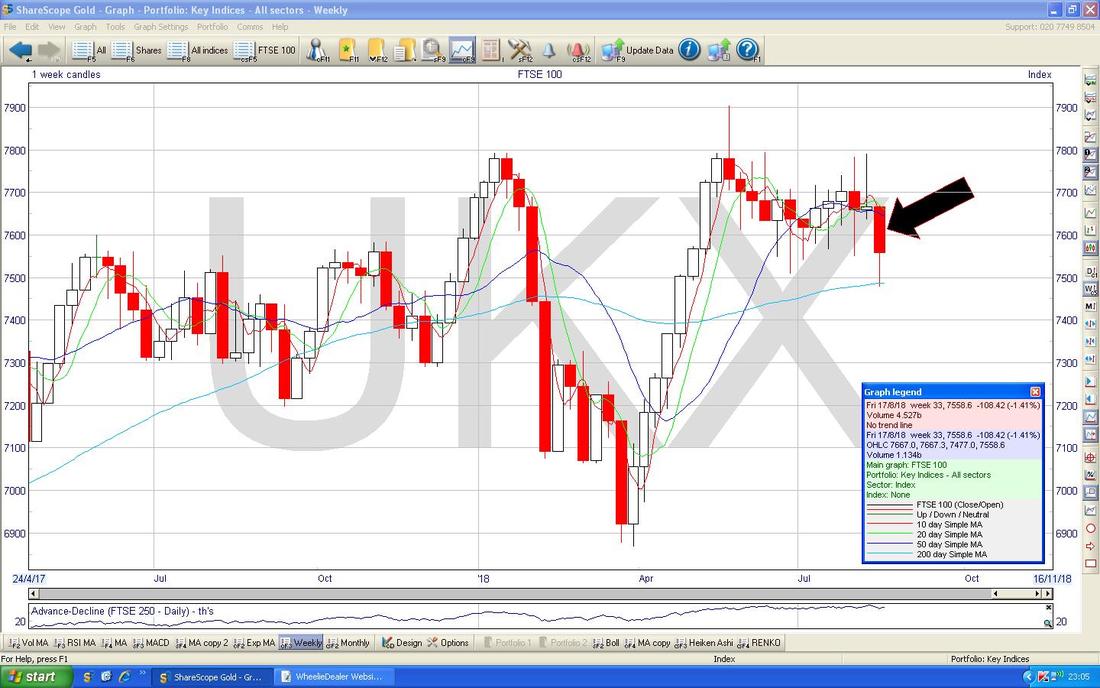
The Chart below has the Weekly Candles for the FTSE100. My Black Arrow is pointing to a Big Red Down Candle from Last Week which doesn’t look all that nice but of course it has quite a long ‘Tail’ pointing downwards which shows how it recovered off the Low of the Week where the 200 Day Moving Average Line is. If anything, this Chart reiterates the importance of that 200 Day MA Line.
Next we have the Daily Candles for the FTSE100 with the Blue Wiggly Bollinger Bands above and below. My Yellow Circle is highlighting how the Price is very near the Bottom BB and in theory it should rise off of this.
I need to end it here. Have a great Week everyone and don’t do anything rash !! Cheers, WD. 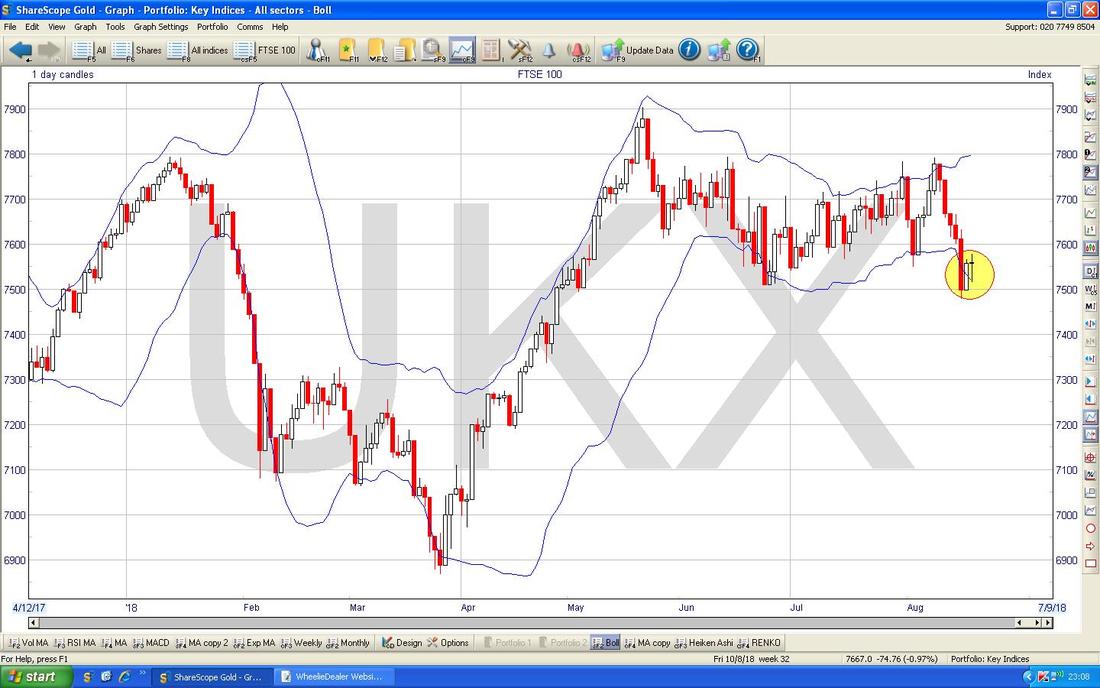
0 Comments
Leave a Reply. |
'Educational' WheelieBlogsWelcome to my Educational Blog Page - I have another 'Stocks & Markets' Blog Page which you can access via a Button on the top of the Homepage. Archives
May 2024
Categories
All
Please see the Full Range of Book Ideas in Wheelie's Bookshop.
|
