

|
educational blogs |
|
THIS IS NOT A TIP OR RECOMMENDATION. I AM NOT A TIPSTER. PLEASE DO YOUR OWN RESEARCH. PLEASE READ THE DISCLAIMER ON THE HOME PAGE OF MY WEBSITE. IF YOU COPY MY TRADES, YOU WILL PROBABLY LOSE MONEY.
As usual on a Sunday Night, I wanted to look at the Indexes and get a view on where things are most likely to go in coming Weeks. Obviously the horrific events in Paris on Friday could have an impact on the Markets, particularly the French CAC40 and perhaps the German DAX. However, because the attacks happened out of Market Hours and with a Weekend for reflection, we might not get the kind of panic selling which probably would occur if this kind of Terrorist attack occurred whilst Markets were open.
If anything, perhaps the events may have more impact on the Oil Market as it seems to me that The Western Powers are probably nearer increased military intervention against ISIS than before. Anyway, I will just look at how the Charts are currently shaping up.
FTSE100 As ever, I want to start with a Longer Term Chart and the ShareScope screenshot below shows the FTSE100 going back to 2009. Please note the Red Parallel Lines which denote the 5 year uptrend and then my Blue Arrow points to how the Price Action in the last 3 months ish has been mainly outside of this Uptrend - not a good thing. 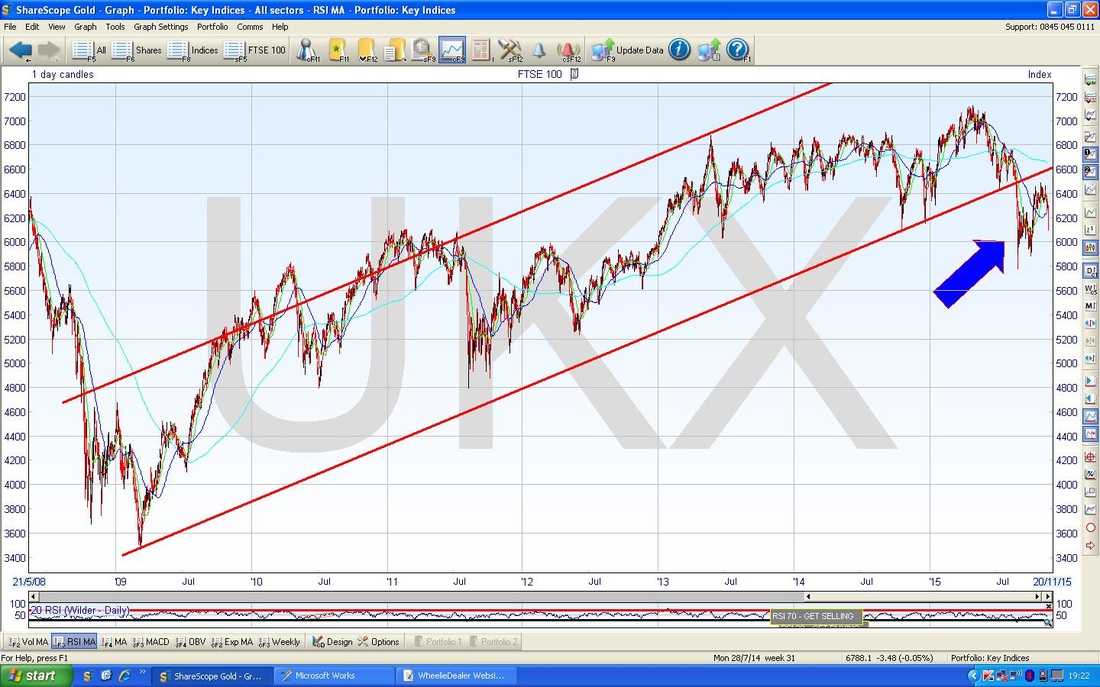
On the Chart below I have drilled in to the last 7 months or so. Note the 2 Parallel Blue Lines I have drawn in which might be an early Uptrend but it is not really established and it is very possible that the Price could breakdown badly and drop below the Lows of August 24th Black China Monday at 5768.
The Red Sloping Line from the Peaks back in May mark a Downtrend Line which is still dominating. My Green Arrow points to where the Price Action in recent weeks broke out of the Red Downtrend Line but it was a ‘False Breakout’ and the Price has fallen back inside the Downtrend. If we are to make real progress (and to get the fabled and highly desired Santa Rally), then the Price has to get back outside that Downtrend Line. My Black Circle envelops the Daily Candlestick which was produced on Friday 13th November and there are 2 slightly positive elements. Firstly it is sat on the Bottom Blue Uptrend Line - so maybe it can find Support here and move up, and secondly there is a bit of a ‘Tail’ pointing downwards which shows that the Price recovered a bit Intraday from its Low Point on Friday. Sadly the latter is not hugely reliable as a predictor - we would ideally want a larger Hammer with a Long Tail downwards. Another positive is that Friday was quite a sell off - Markets usually reverse Up once there has been a ‘Capitulation’ move where Weak Holders finally give up and throw in the towel - it felt a bit like that. Note there is a lot of Horizontal Support just below where we are now particularly at 6000, 5900 - it is likely we can get a bounce off these levels. Whatever happens it is UTTERLY CRITICAL that the Black China Monday Low of 5768 holds - if that fails, we are TOAST. 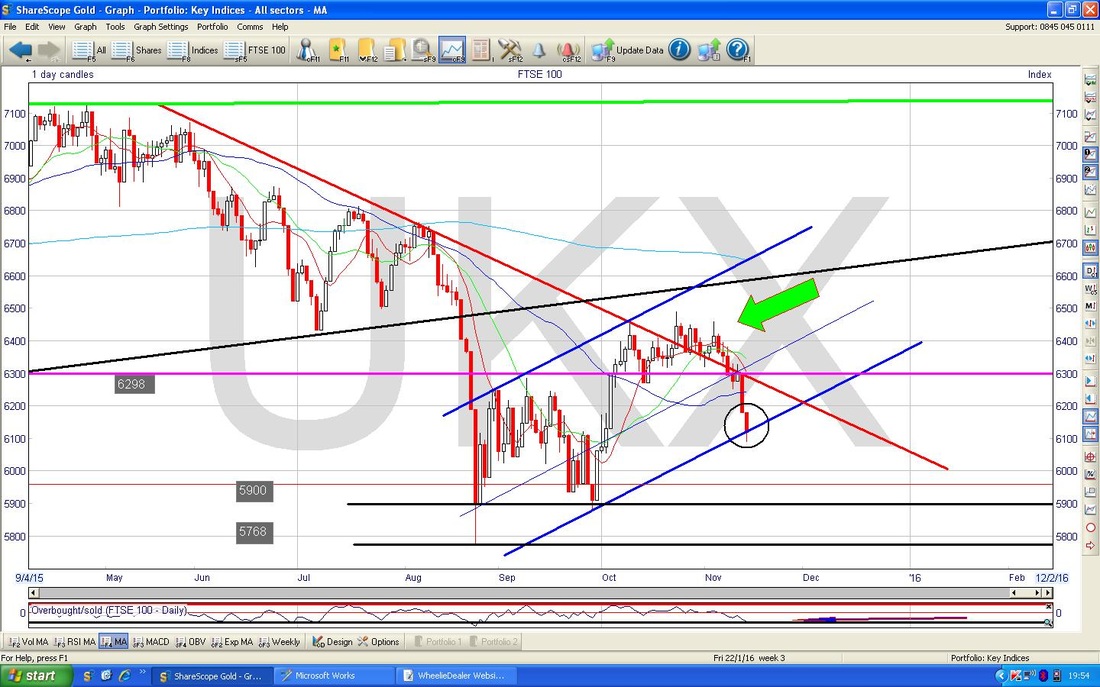
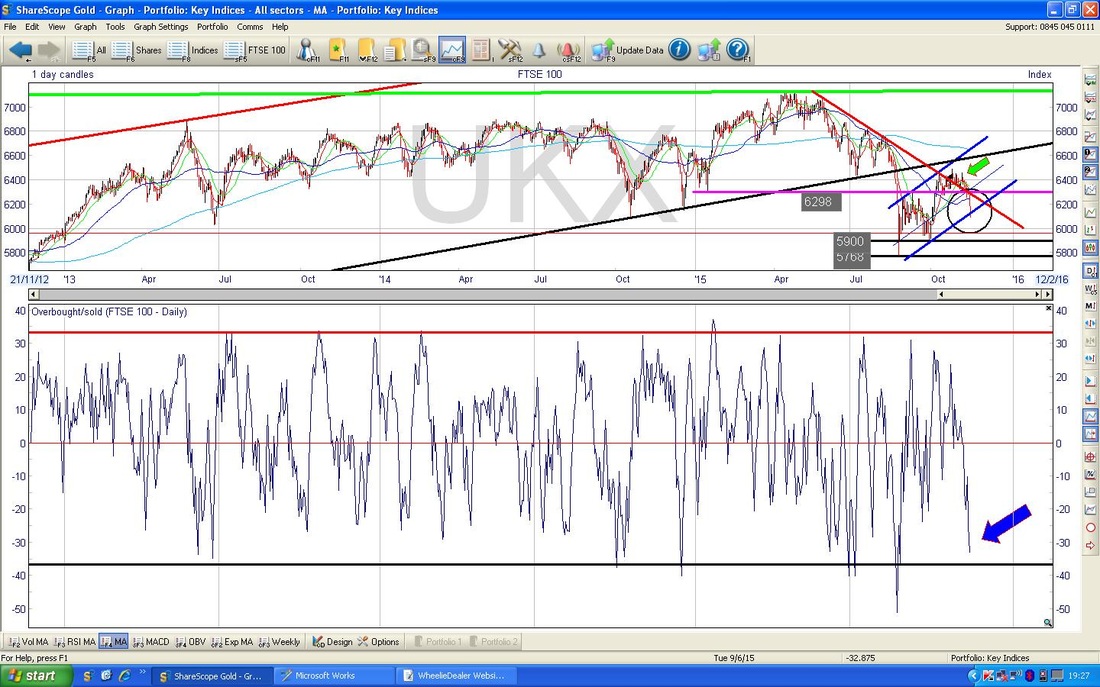
If you look at the Bottom Window on the Chart below, this shows the ‘Overbought/Oversold’ Oscillator - this thing is pretty good as a very short term indicator and my Blue Arrow shows that it is very low and at the point where the FTSE100 usually starts to reverse upwards.
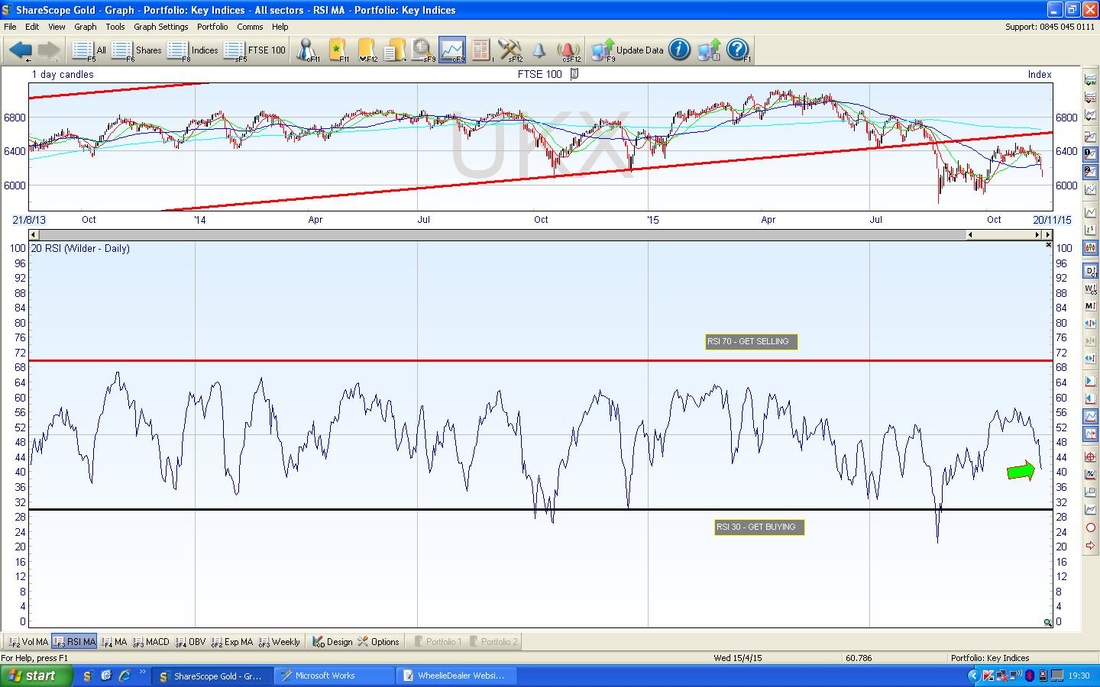
On the Chart below, please look at the Bottom Window - this shows the RSI (Relative Strength Index) and my Green Arrow points to where we are now with a reading around RSI 40 - this is low (RSI 30 is usually taken as oversold) but it can go lower before we bounce. However, if you look across to the left, you can see that the FTSE100 has bounced from a reading of RSI 40 several times before.
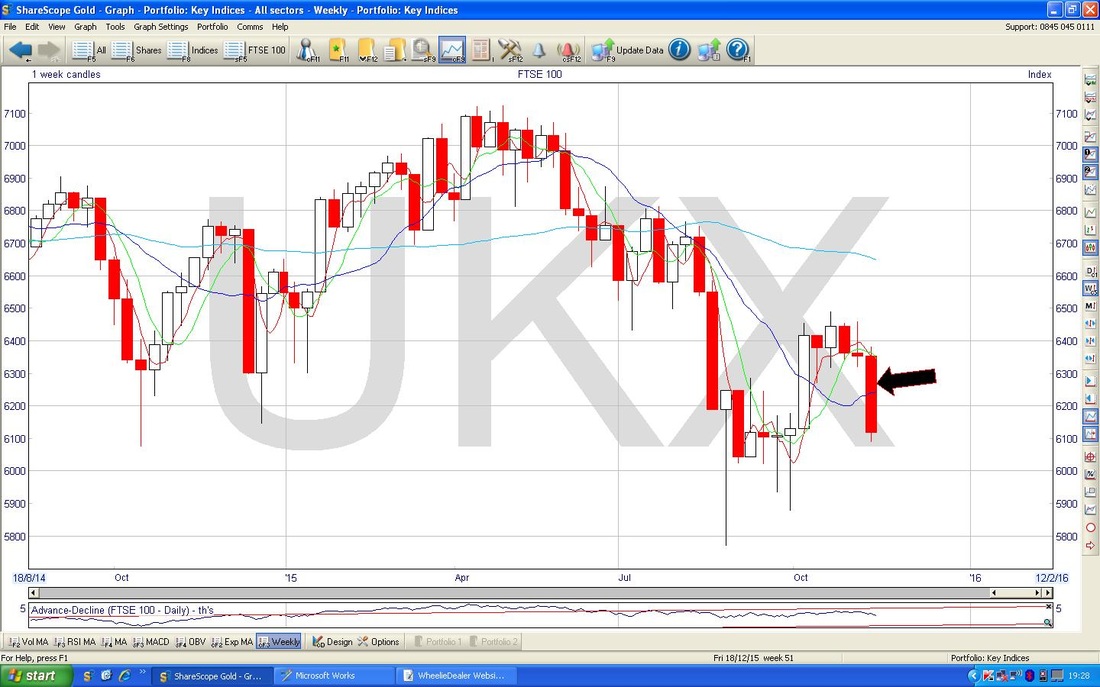
The Chart below shows the Weekly Candles - my Black Arrow points to a pretty nasty looking Red Down Candle - this is not good and we need some sort of Reversal Candle or combination of Candles to really mean it can turn up. This coming week could still be painful I suspect although if we had a good Up Week, then we would form a 2 Week ‘Harami’ Pattern (the Pregnant Woman viewed from the side thing) which would be very bullish. Failing this, we need a Hammer Candle to be created this Week if we are to drive upwards in December - this would probably mean a couple of crappy days and then a good rally at the end of this coming week.
DAX
It seems likely that the DAX could get impacted by the Paris events - but let’s just check out how things were looking before those awful atrocities took place. The Chart below is the Long Term Picture and shows the Uptrend firmly in place - this is very bullish. 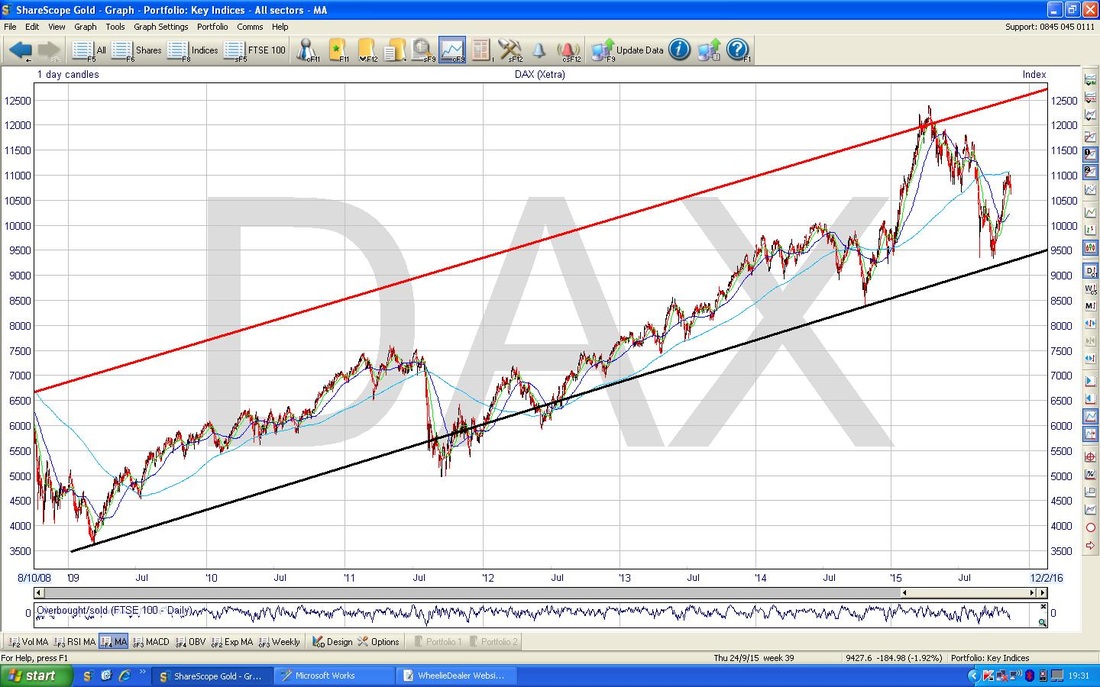
My Chart below shows a shorter timeframe, going back to around March this year. My Blue Line (marked with the Blue Arrow) shows a Downtrend Line which really needs to be broken for the DAX to go higher. My Green Arrow points to where the Price moved up to the Blue Downtrend Line recently but failed and dropped back.
My Black Circle encloses a Hammer Candle - this is a positive development and often the Market can rally from this - unclear if this will happen in the light of the Paris Shootings. 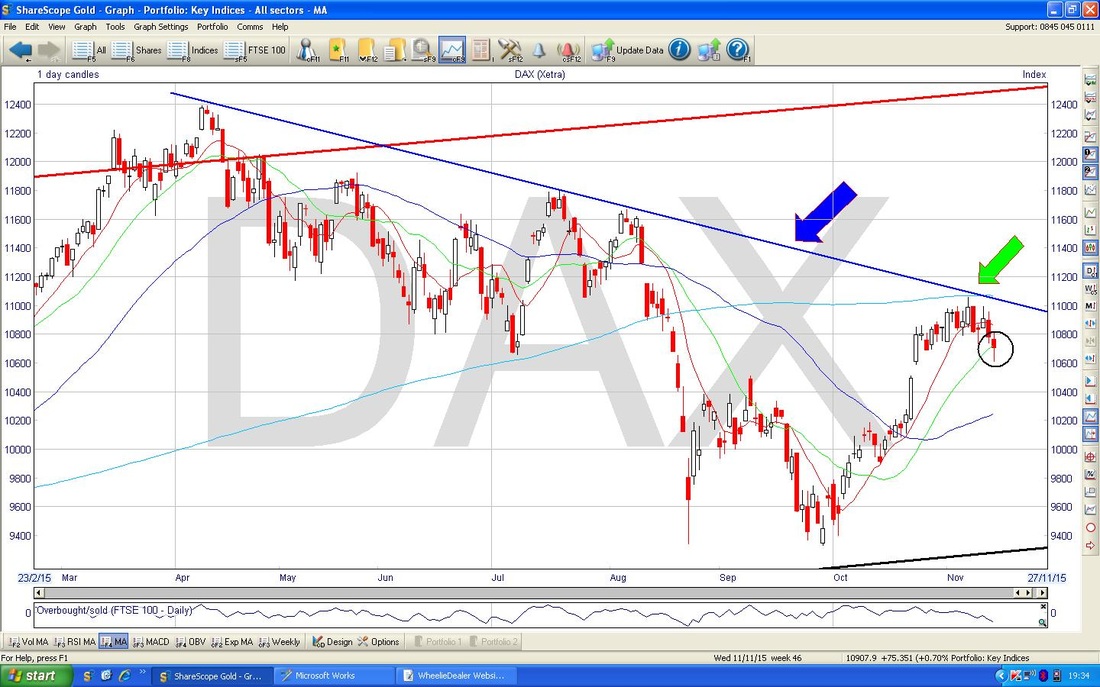
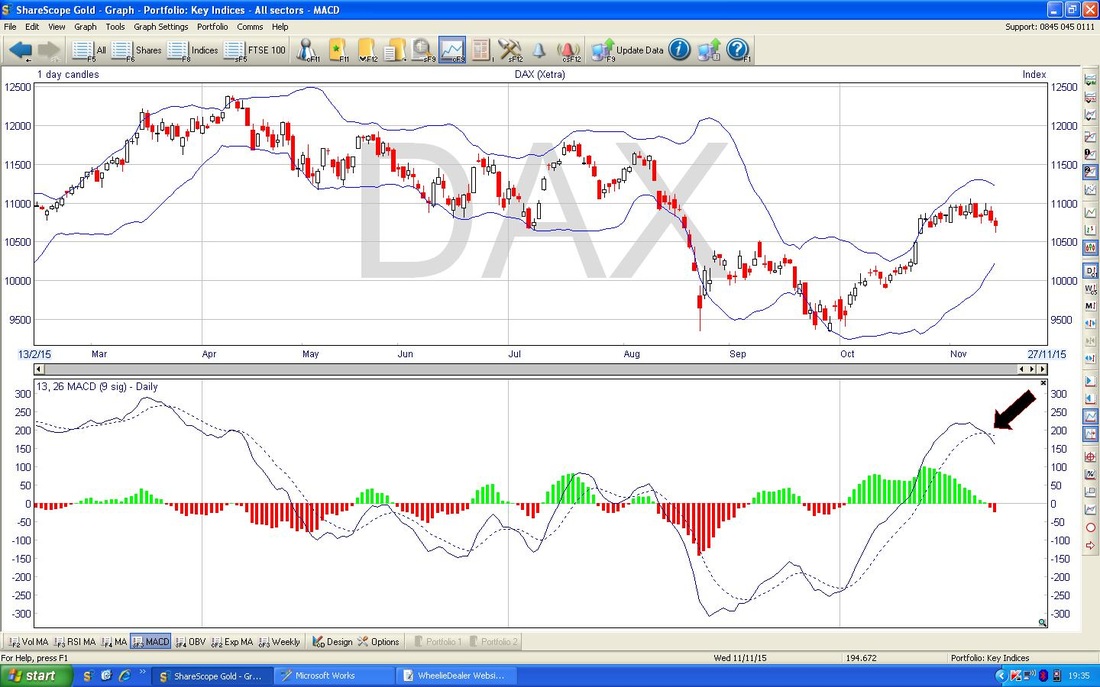
In the bottom Window on the Chart below, this shows the MACD (Moving Average Convergence Divergence) Indicators - my Black Arrow points to a Bearish Crossover and it is suggesting that the Price will fall more.
S&P500
The chart below shows the Long Term uptrend in the S&P500 - please ignore the numbers at the top right hand corner. This is a Bullish Uptrend. 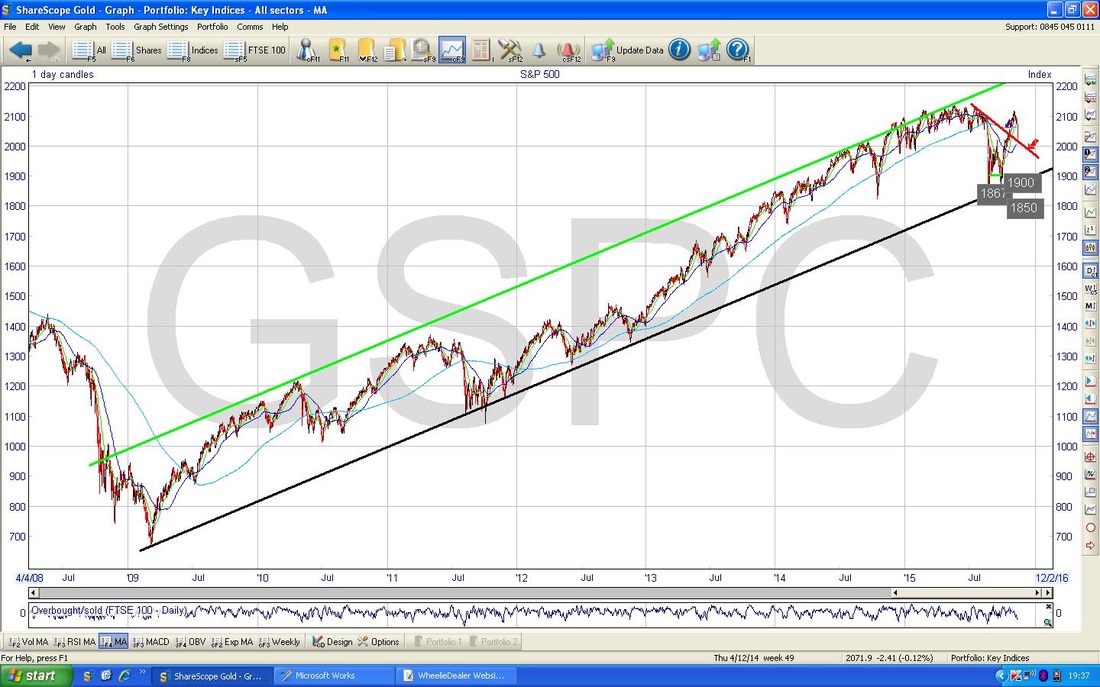
As usual, on the Chart below I have drilled in to the picture since about April this year. Please note the Red Downtrend Line that I have marked with the Red Arrow. My Black Arrow points to where the Price broke out of this Red Downtrend Line in the October Rally but note how it then peaked out and has been moving down.
My Black Circle shows the Candle generated on Friday which is an ugly big down thing - never good. However, note how it is sat pretty much on the Red Downtrend Line and this former Resistance, may now act as Support and we might bounce from here. My Blue Arrow is pointing at the Blue Wiggly Line which is the 50 Day Moving Average. Note how it is not far from the current Price and it might act as Support - this would be around 2010 ish or just below. Also note that the 50 Day MA has turned up - this might be a positive thing. 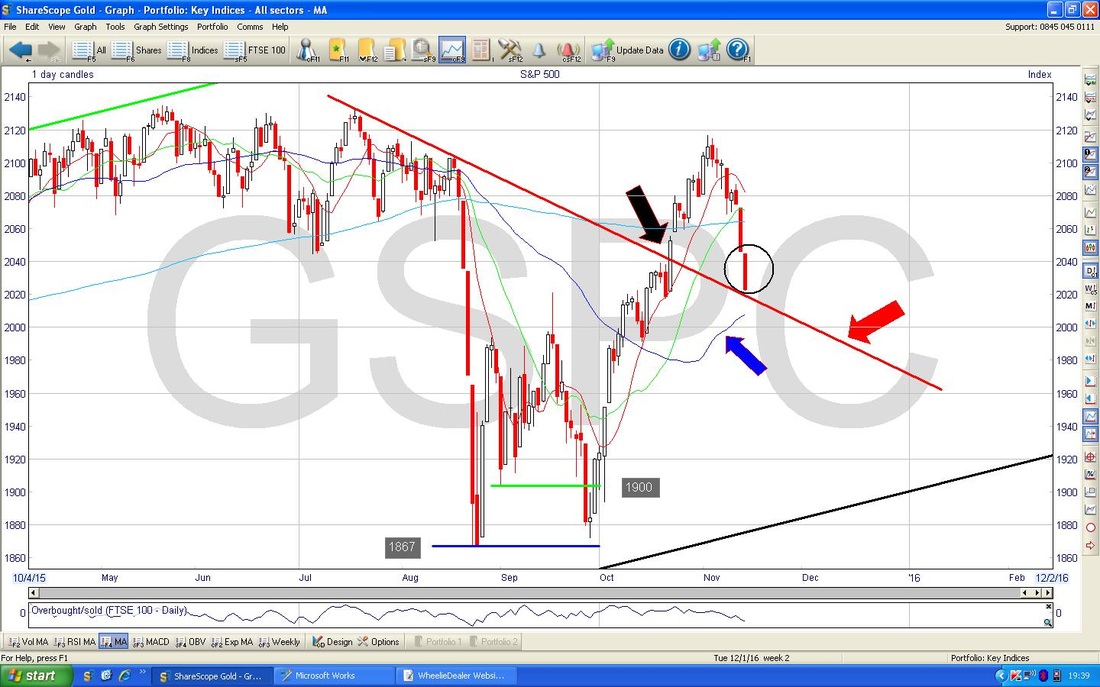
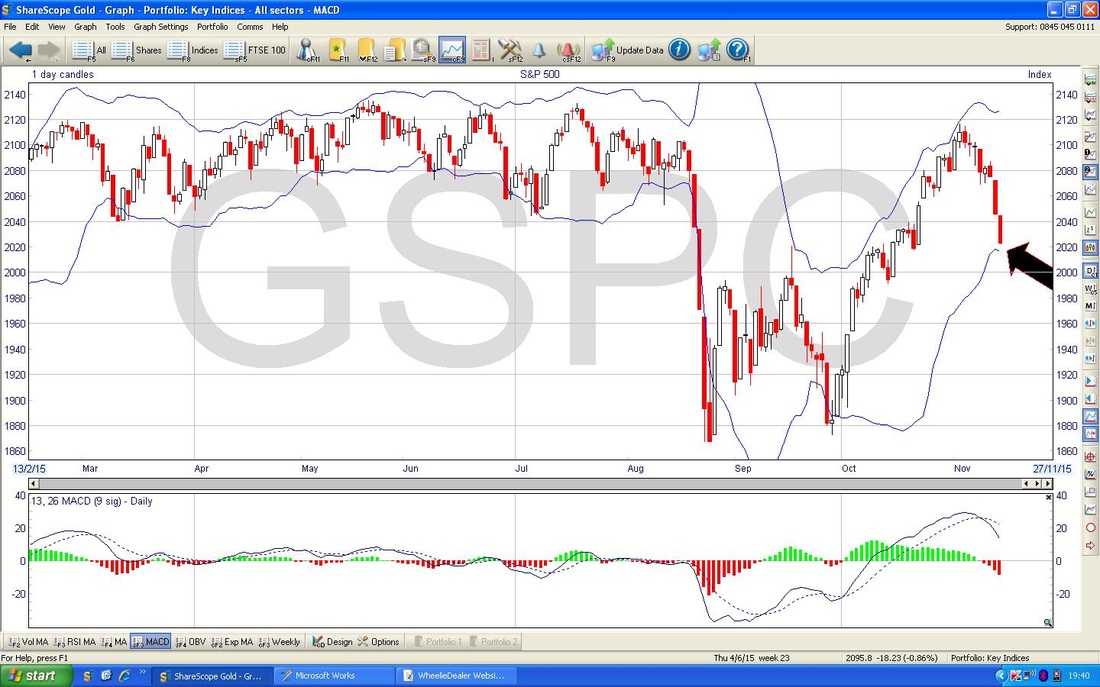
The Screen below shows the Bollinger Bands in the Top Window - these are the Blue Lines which wobble around above and below the Price Action. Note my Black Arrow points to where we are now - and we are pretty much on the bottom Bollie Band so perhaps we can reverse up soon.
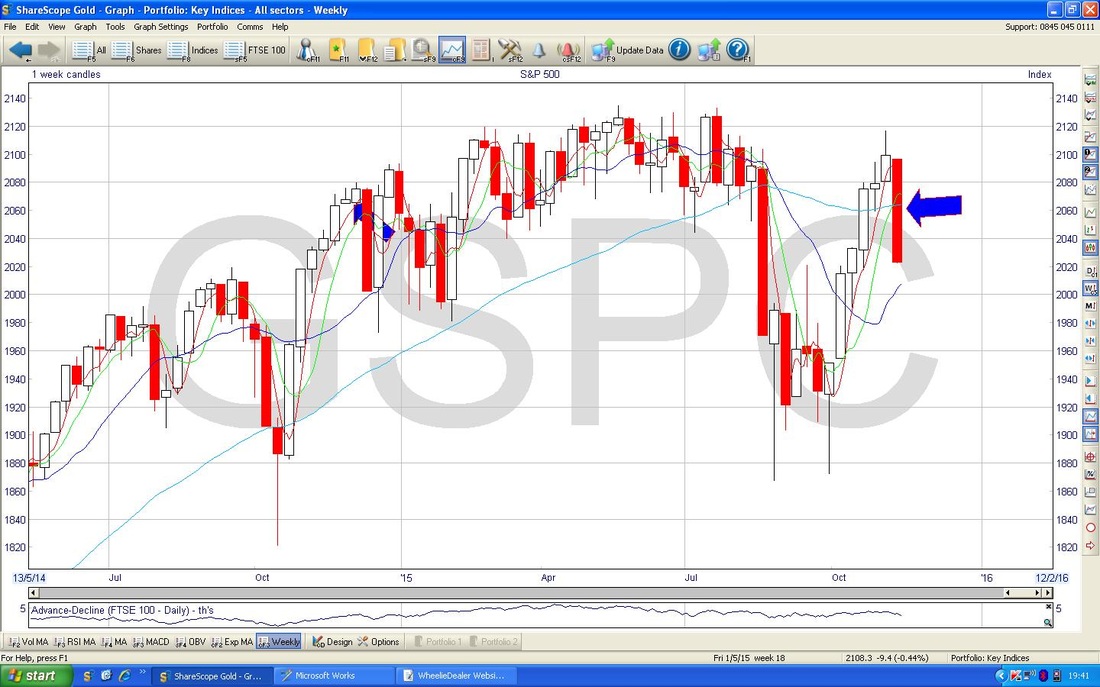
The Chart below shows the Weekly Candles for the S&P500 - my Blue Arrow is pointing to a pretty nasty Big Down Red Candle - this is not a good sign. As with the FTSE100 Weekly, the best we can hope for is a good Up Week now and a Harami forming.
On the Screen below, please look at the Bottom Window for the RSI Indicator. This is reading about RSI 46 and is not particularly low - on this evidence alone I would expect a bit more downside before we can Rally.
Right, that’s it - a pretty mixed bunch with nothing really conclusive. Things look pretty weak so my guess would be a bit more Downside early in the coming week and then we start to recover. At the moment I have no Short Positions on and I can’t see much point in doing so - I think any downside now is limited and this is historically the most bullish time of the year so Shorting could be very dangerous. The UK Stockmarket Almanac shows the coming week as pretty flat usually - it is saying Up 50% of Years with an Average Loss of 0.1% - so the past is not leading me to expect much. It also says that Thursday in the coming week is historically the 7th Weakest Market Day - we shall see. Happy Hunting, WD 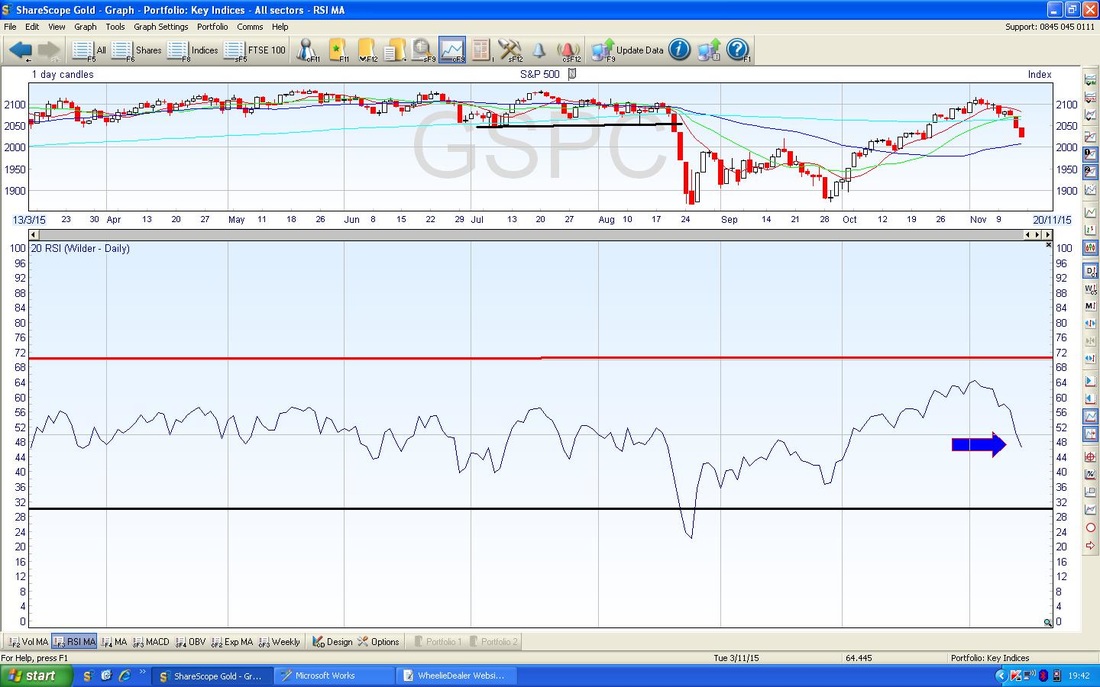
2 Comments
catflap
15/11/2015 09:37:29 pm
Thanks. Yes, I reckon a couple of bad days is probable. Europe may take a cue from the far-eastern markets. Not sure how they look in the morning.
WheelieDealer
16/11/2015 11:45:34 pm
Hi catflap, I am typing this on Monday night so we all know what happened and it was a pleasant surprise - great to see that people held their nerve despite the Paris Attacks. Markets look well set now so hopefully we will get a good week. Thanks, WD Leave a Reply. |
'Educational' WheelieBlogsWelcome to my Educational Blog Page - I have another 'Stocks & Markets' Blog Page which you can access via a Button on the top of the Homepage. Archives
May 2024
Categories
All
Please see the Full Range of Book Ideas in Wheelie's Bookshop.
|
