

|
educational blogs |
|
THIS IS NOT A TIP. I AM NOT A TIPSTER. PLEASE DO YOUR OWN RESEARCH. PLEASE READ THE DISCLAIMER ON THE HOME PAGE OF MY WEBSITES. Hopefully this will be short and sweet. You may have seen on my ‘News’ bit on the Homepage or on Twitter that I sliced off a chunk of my CRST holding at around 440p early this morning. As usual, I made the decision in the ‘cold light of day’ (ok, it was dark) last night after the markets were well and truly shut, and it was partly driven by Chart based timing as I will outline below. I have held CRST for about 2 years having bought my first chunk just after the IPO - because it looked flippin’ cheap. I have quite a lot of Shares and Spreadbet positions and I chopped off about a fifth of my holding - banking a Profit of over 62% and there were Divvys on top of this as well - not too bad. Hopefully I can shift some more of the Holding with similar banked profits or preferably better !! My reasons for selling were as follows:
Technical Factors As usual, I will bung in a few charts and explain what was going on when I looked at these Last Night - note they are from then, they have not been updated with today’s Price Action. I have been thinking about selling CRST for some time, and I have been waiting for Technical Signals that the time is right to start chopping away at it. If you look at the Chart below, you will see a pretty good Uptrend - no problem here and it could well go higher - but that is fine with me, I still have 4/5 of the Holding I had yesterday. That’s the beauty of Topslicing, you are still in the game but if it drops, then you at least banked some Profits. I am a firm believer in ‘Scaling In, and Scaling Out’. The only thing to notice here is that there was a Previous Peak a few days earlier - this could form some sort of Resistance and limit immediate Upside. Oh, and it is worth remembering that even the most beautiful Uptrend will end at some point - so it can look great one day, and rubbish the next !! The Trend is your Friend…….until it is not………. 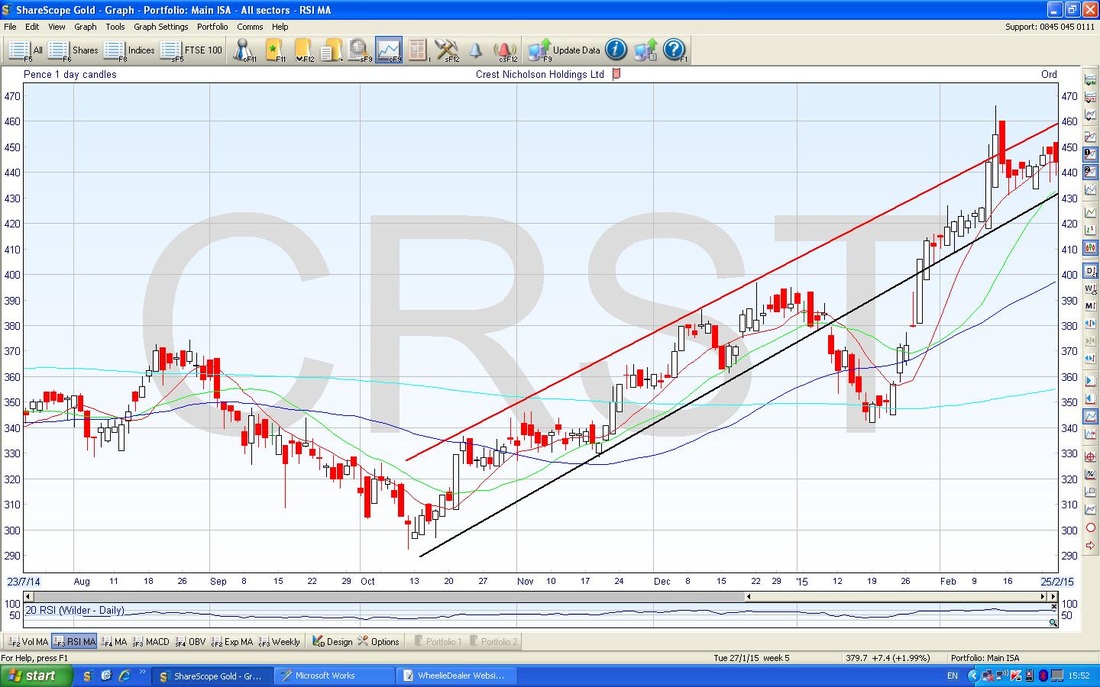
The Chart below looks more closely at the Daily Candles that I could see last night. The Black Arrow marks a Hammer Candle that was formed on Tuesday which is a Bearish Indicator after an Upmove - this was then ‘Confirmed’ by the Down Candle yesterday (marked with the Green Arrow) - this combination is a good Sell Signal. 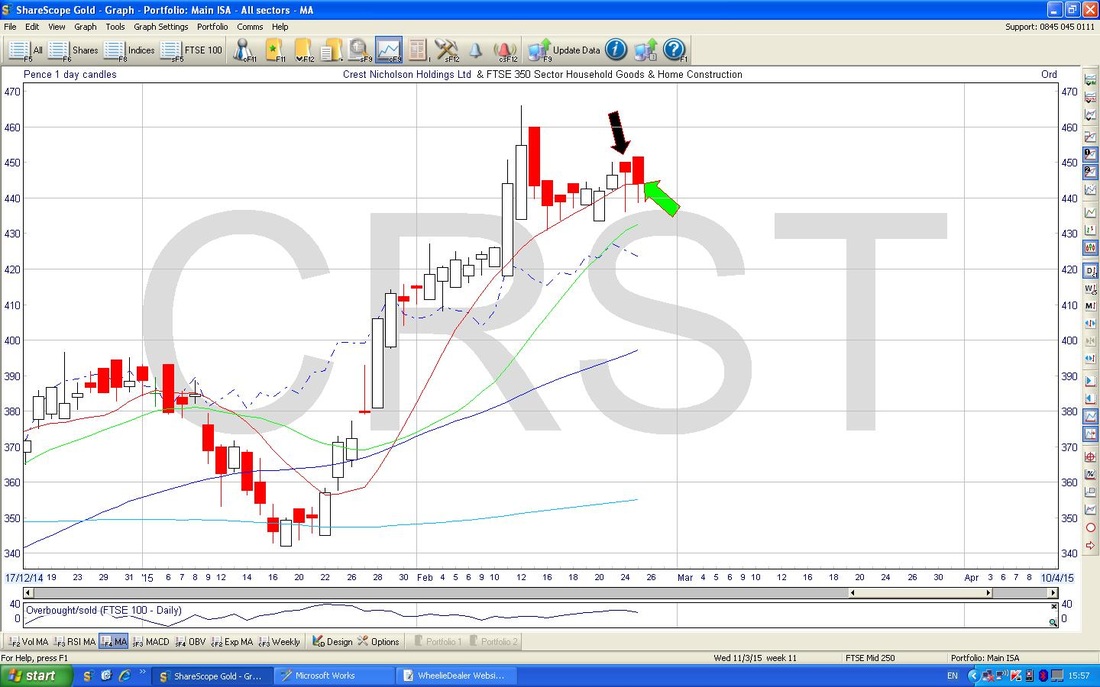
On the Chart below, please look at the bottom Window which shows the RSI (Relative Strength Index). I have marked with the Red Arrow how the RSI has peaked at around 76 and is now falling back - that is bad. If you look to the Left, you will see that the RSI never gets up this high - so that is an anomaly and a chance to Sell. 70 is usually Overbought for pretty much any Asset, although Smaller, Illiquid, Stocks can often have periods where RSI gets up into the 80s or even below the 20s. 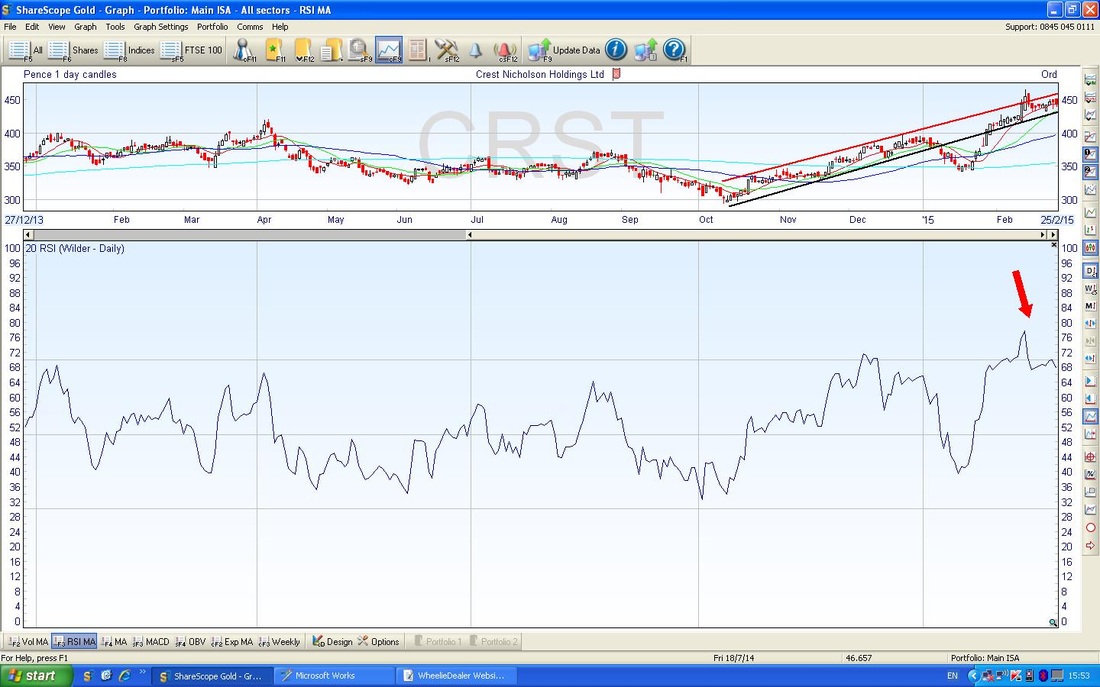
In the Top Window below, please look at the Green Arrow which shows where the Price was touching the Top Bollinger Band (the blue wiggly lines). The Price has now moved away from the Top Bollinger Band - this is Bearish. In the Bottom Window, I have marked with the Black Arrow where the MACD (Moving Average Convergence Divergence) Histograms have gone from Green to Red - Sell Signal. This is backed up by the Little Blue Arrow which marks where the Solid MACD line has crossed the Dotted MACD ‘Signal’ Line - this is bearish. 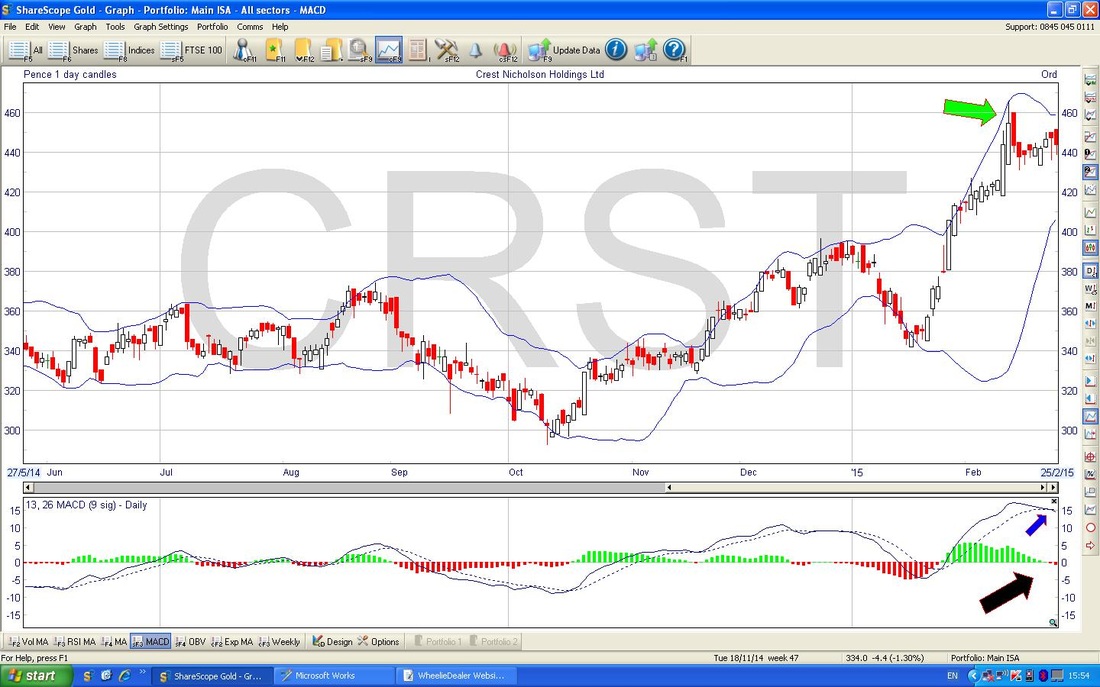
Please look at the Bottom Window in the Chart below. This shows the Stochastic Oscillator - it is a new Indicator I am testing out and I thought I would just bung it in to show you what I have been bleating on about. The Red Arrow shows where the Solid Blue Line has crossed down through the Dotted Signal line - bearish but I have yet to be convinced of the value of this Indicator. It is very timely and gives early Signals in theory. 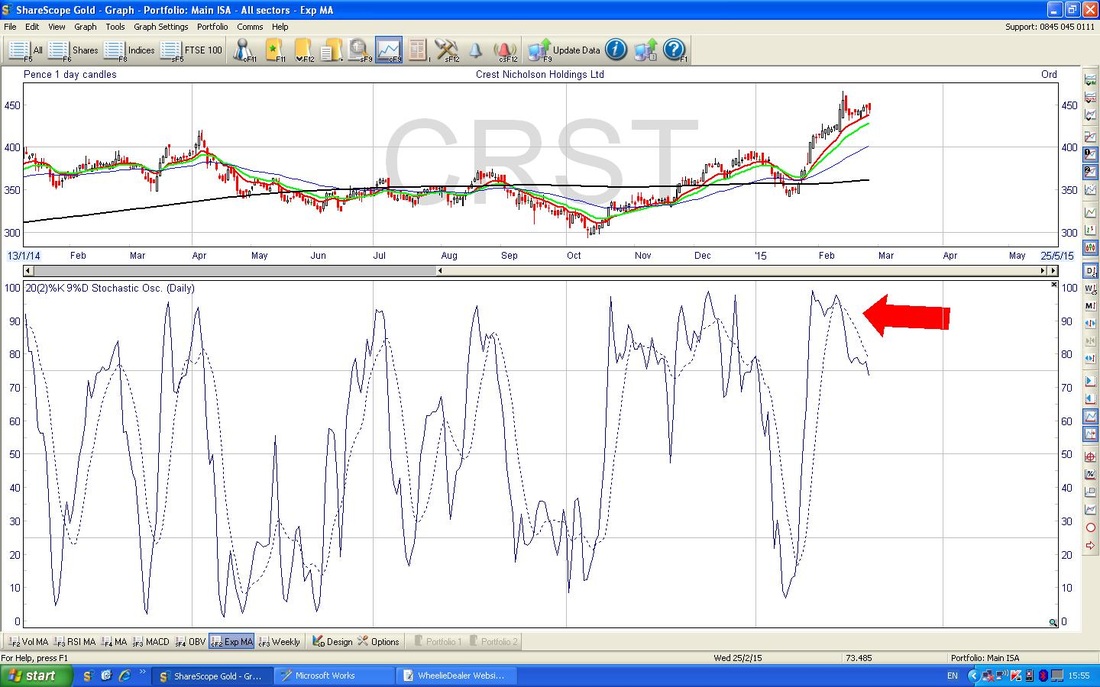
The Chart below has the Weekly Candles. The Blue Arrow marks a sort of Inverted Hammer Candle (although not a great example) which is Bearish in this context of Price moving upwards. This was then followed Last Week by the Candle marked with the Black Arrow - this is clearly a nice Hammer and very bearish. OK, that should do it. Hope this helps, wd 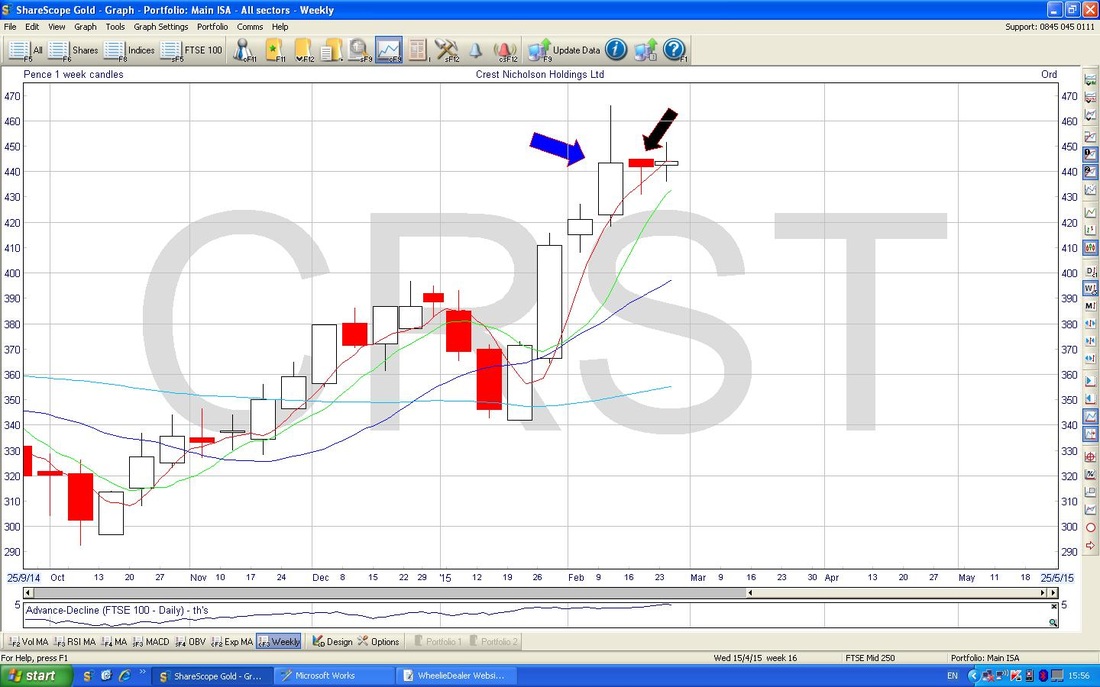
0 Comments
Leave a Reply. |
'Educational' WheelieBlogsWelcome to my Educational Blog Page - I have another 'Stocks & Markets' Blog Page which you can access via a Button on the top of the Homepage. Archives
May 2024
Categories
All
Please see the Full Range of Book Ideas in Wheelie's Bookshop.
|
