

|
educational blogs |
|
THIS IS NOT A TIP OR RECOMMENDATION. I AM NOT A TIPSTER. PLEASE DO YOUR OWN RESEARCH. PLEASE READ THE DISCLAIMER ON THE HOME PAGE OF MY WEBSITES.
I recently sold out of my Costain (COST) Shares at 339p as they seemed to have peaked in the Short Term and I am trying to reduce my total number of Positions and take a bit of Risk off the table prior to Summer lulls, the usually weak month of June and of course the Greek silliness. I am a bit annoyed with myself over this trade - the ‘Rules’ are that I should buy a Stock using Normal Shares first and then if it starts to move up, I should add a Spreadbet of a suitable size. The trouble with this one is that I just didn’t buy the Spreadbet for some daft reason. To be fair to myself, COST is a choppy little bu*ger and it just never seemed to give any clear Buy Signals for the Topup - but I am kicking myself (not easy when you are Paraplegic !!) because I really threw away a pile of easy money here. Perhaps I should be more mechanical and when I buy Normal Shares, I should just Buy a Spreadbet as well - I could always add more later.
It’s simply maths. The way I do things, I ‘mirror’ my Normal Shares with a ‘Virtual’ Spreadbet Portfolio where I use Leverage to get more Bang for my Buck (if you click on the ‘Spreadbetting’ Category on my Blog Page, you can find a Series of about 6 Blogs which describe in detail how I do this). If I make 20% on my Normal Shares then I will make 20% pretty much on the Spreadbet Portfolio - but because it is leveraged, the Return on Capital Employed is huge. For instance, with the COST trade I made about 25% on the Normal Shares, but a Leveraged Spreadbet ‘Mirror’ would have produced about a 125% Return on the Capital used as ‘Margin’ (another word for Deposit).
Anyway, back to COST. I still like the Company and think it is a very well managed business which has taken excellent steps in recent years to move to a more predictable Construction, Maintenance and Engineering model where it serves Regulation driven demand from the likes of Utilities, Water Companies, Energy Companies etc. The main reason for selling was Valuation. If you look at the Graphic Below from ShareScope, you should see in the Top Right Hand Corner that the ‘Norm EPS (p)’ for 2016 is 22.54p (Earnings Per Share). At my Selling Price of 339p, this gives a Forward P/E Ratio of 15. This is not overly expensive for a quality business, but experience tells me that Construction Companies, which are highly Cyclical, rarely are given this kind of Valuation by the Market. In fact, Valuations below 10 are common across the Economic Cycle. In terms of Dividend, for 2016 the Forecast Figure is 10.997p which gives a Divvy Yield of 3.2% at my Selling Price of 339p - not bad but not amazing either - Cyclicals are High Risk by definition and I like good compensation for the Risk. As I mentioned above, I am trying to cut down on my Total Number of Positions and COST was a bit of an anomaly because I only had Shares and not a Spreadbet - so it was an easy target to dump. Let me stress that there is nothing wrong with COST as a Company and part of my selling decision is a Portfolio Management issue on my part. 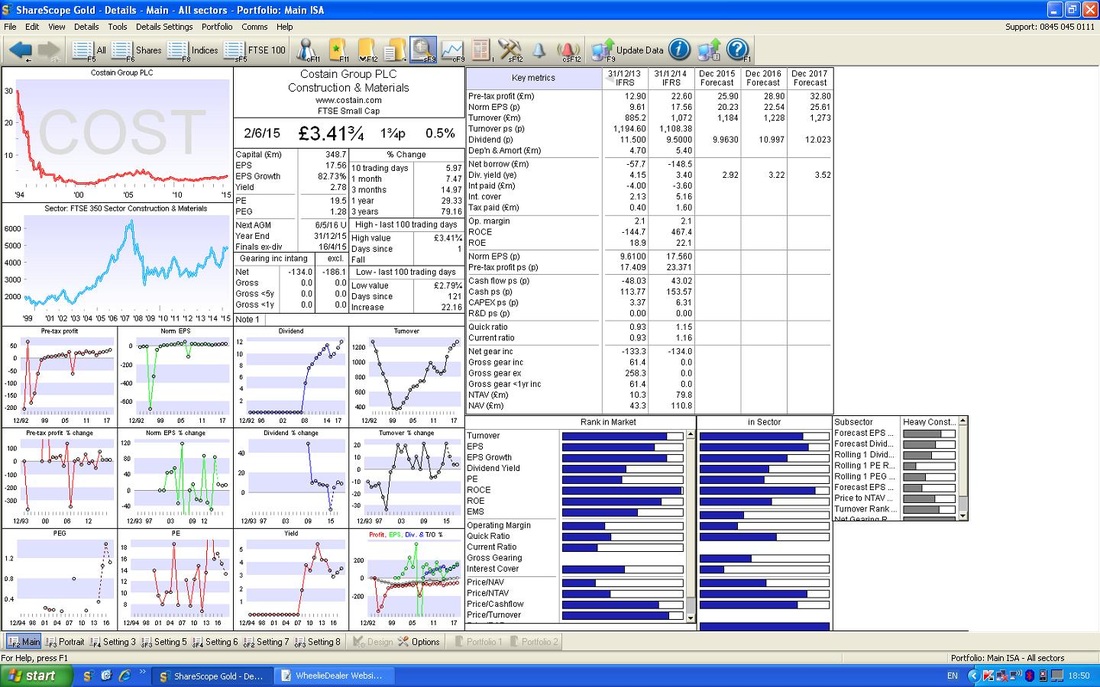
Technicals
As per my usual way of working, I decide whether to Buy or Sell on the Fundamentals of the business and then I use the Charts to give me Timing Signals for when to make my moves. I had decided some time ago that COST would go when it got up around 350p, as there is a lot of Resistance at this Price and I had been watching it closely on my Nightly Chart Checks. If you look at the ShareScope Screenshot below (as usual, please note these are the Charts from the Night before I sold the COST Shares - so this is the situation I was confronted with when I made my ‘Out of Hours’ unemotional decision to Sell the next day), this shows a Very Long Term Chart going back to about 2000. As ever with Technical Analysis, it is correct to start with the Long Term View and then drill down to smaller Timeframes. The things to note here are the Long Term Uptrend which is denoted by the Thick Black Line at the bottom of the Price Line and the Thick Horizontal Red Line which shows the Resistance Level that was caused by the Spike to about 360p back in Summer 2009. These kind of Resistance Levels are targeted by most Traders and it is obvious that Selling Pressure would come in when the Price got up around these levels. You should be able to see how the Price had moved up fairly close to the Red Horizontal Resistance Line and this was a key driver in my Sell Decision. 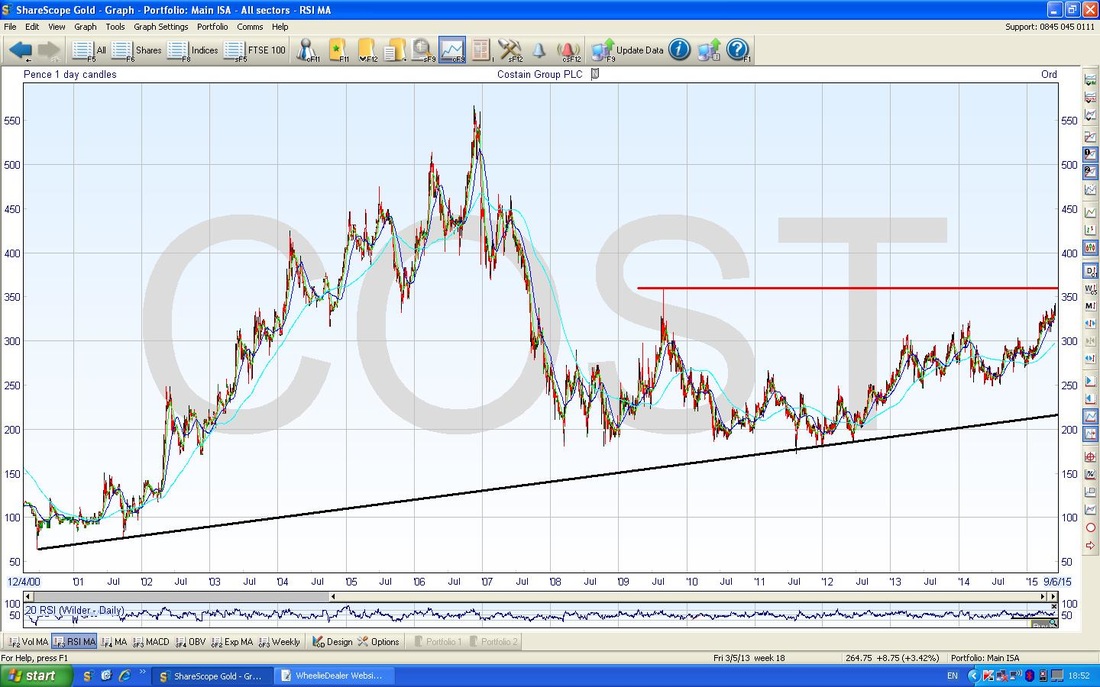
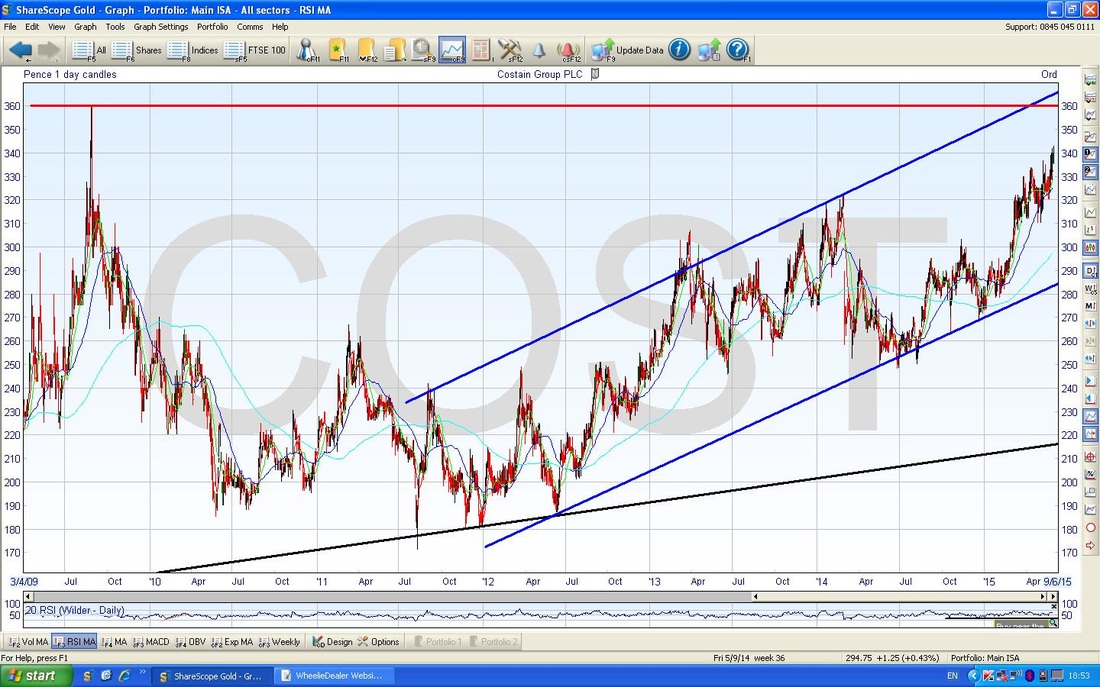
The Chart below is a Shorter Timeframe covering about 5 years. In this case, you can still see the Black and Red Lines from the earlier Chart but I have also drawn in a Short Term Uptrend which I have marked with the Thick Blue Lines. It should be obvious here that the Price is not only up against the Top of the Blue Lines Uptrend Channel but also that it is up against the Red Horizontal Line Long Term Resistance.
On the Chart below, I have zoomed in even more and put in another Uptrend Top Line which I have marked in Green. Yet again, the Price is up against this Line, which acts as Resistance most probably.
Please look at the Candlestick that I have pointed out with the Black Arrow. This is key because it is a ‘Hammer’ (go on, use your imagination) and in the Context of a strong Upmove like this Price has had recently, this is a Sell Signal - implying that the Move Up has run out of puff. 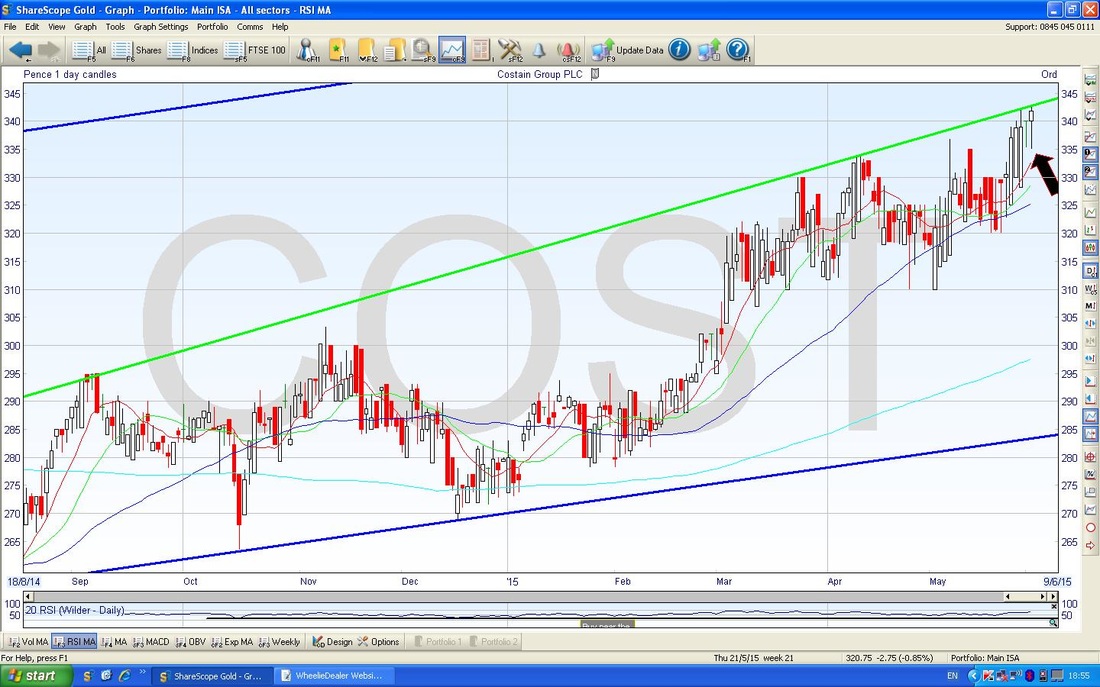
On the Chart below, please look at the Bottom Window. This shows the RSI (Relative Strength Indicator) and I have put simple instructions with regard to how Traders should behave as the RSI moves between the levels of RSI 30 and RSI 70. In this case, the RSI is up near the Top Line at RSI around 64 and this is a good Confirmation of the other Technical Sell Signals that have been generated in the Charts above.
Ok, that’s the COST sell story, wd 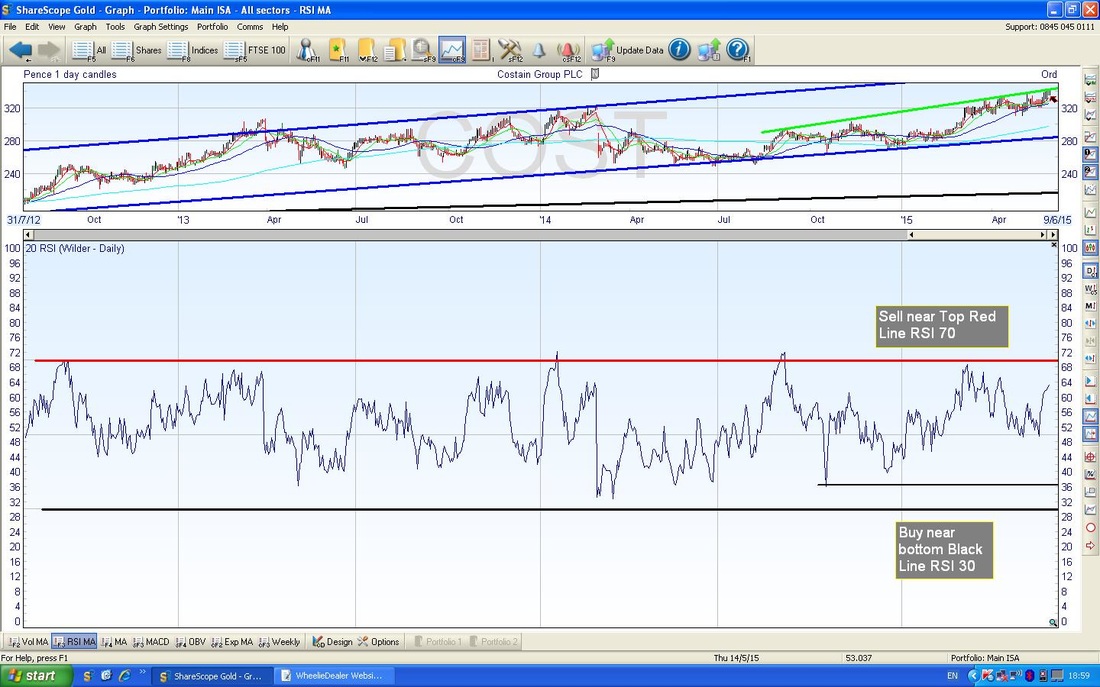
0 Comments
Leave a Reply. |
'Educational' WheelieBlogsWelcome to my Educational Blog Page - I have another 'Stocks & Markets' Blog Page which you can access via a Button on the top of the Homepage. Archives
May 2024
Categories
All
Please see the Full Range of Book Ideas in Wheelie's Bookshop.
|
