WheelieDealer Share trading diary blog with Portfolio and Education
  • Home
  • Trades
  • Educational Blogs
  • Wheelie's Bookshop
  • M3 Manifesto
  • Portfolios
  • WheelieBin / WheelieWatchlist
  • Non-Finance Books
  • Beginners
  • Monthly Performance
Picture

educational blogs

Candle Power

6/3/2015

3 Comments

 
This Blog might be best viewed on a largish Screen - you are gonna struggle to see the Chart and Candlesticks adequately using a Fone Screen.

As you know, I continually bleat on about flippin’ Candles - drives you all nuts right? Anyway, I had been working on the Spreadbet Blog Series and fancied knocking up a quick, easy and nearly fun Blog draft - with the intention that it would probably see the light of day in March ish (and so it has !!).

I have had a lot of Readers ask me about Candles and I seem to have ignited some interest (geddit?), so I fancied a Blog on it. My thinking was that I would randomly pick a Chart of a Stock and then point out how Candlestick Charting techniques enable me to ‘read’ what the Share Price is doing and have some idea of its future moves - the ability to peek into the near future, now that would be handy, would it not?
In reality, I couldn’t just pick any old Stock - I tried to do this and ended up with some highly illiquid piece of AIM Junk that would make my job very hard - Technical Analysis of any type does not work as well on Small Choppy Illiquid Stocks, although it does have some use if you keep it simple. So, I decided to go FTSE350 and randomly picked out this Chart of Grafton Group GFTU (below), from the list that ShareScope chucked out at me.

As ever, Simplicity is always best, particularly with Technical Analysis of any sort. In essence, there are 2 overall types of Candlestick Patterns - Reversal Patterns and Continuation Patterns. The latter are far harder to understand and less useful anyway, so I will ignore them in this Blog (if you want more detail on Continuation Patterns and Candlestickery in general, then pop over to Wheelie’s Bookshop and get a copy of ‘Candlestick Charting for Dummies’ via www.wheeliedealer2.weebly.com).

Click this link to go to a Wikipedia Page which covers the common Candlestick patterns (this link is also at the bottom of my ‘Useful Links’ webpage) http://en.wikipedia.org/wiki/Candlestick_pattern

This means that we are really concerned here with ‘Reversal Patterns’ - which means they are Patterns (or single Candles) that form when an Uptrend (or Upmove) or Downtrend (or Downmove) is coming to an end and is most likely going to change direction and go the other way. Many of the Candle Patterns I highlight below are ‘Context Sensitive’ - this means they only work after a clear Downtrend or clear Uptrend. If they appear in a Sideways Move, then they have no real relevance.

As you will see in the Chart, I have put Black Circles around the Candlesticks I want you to look at, and I have numbered them for easy description and identification. I have also put in 2 Arrows that will be described at the end. I have done a Bullet List for the numbers that follows below the Chart. I have also repeated the Chart further down the page to try and make it easier to read.

Picture

  • CIRCLE 1.  From the Left, there was a bit of an Uptrend for a few days, and then we got the ‘Shooting Star’ type Candlestick that I have circled - it’s the one with the Red ‘Body’ near the bottom with Long ‘Wick’ (or ‘Tail’) upwards. Nice Reversal Warning and worked a treat here. Note, White Candle Bodies mean it was an UP day and Red Candle Bodies mean it was a DOWN day. A ‘Doji’ is pretty much any Candle that has a narrow Body, although a Textbook Doji looks a bit like a Spinning Top.
  • CIRCLE 2.  This is quite a nice one, although I can’t remember the name. It is a sort of ‘3 Inside Up’ 3-day Pattern, where the little ‘Star’ like thing in the middle SHOULD BE followed by a ‘clean’ Up Day to complete the pattern. In this case, we got another ’Doji’ Candle on Day 3, whereas ideally the Day 3 Up would be a nice clean Up Candle with little or no Wicks or Tails (a Marabuzo I think it is called - probably spelt that wrong, my Japanese is a tad rusty, apart from Suzuki, Kawasaki, Yamaha, Honda etc.) However on the next day we got a nice Up White Candle so it was game on, with a sort of delayed ’Confirmation’ of the ‘3 Inside Up’ Pattern. The concept of a ‘Confirmation’ is quite important for Short Term Traders who use Candlesticks - it is less important for Long Term Buy and Hold merchants like me, but is still handy. I won’t dwell on Confirmation but it is simply the idea that the Candle on the day following the Reversal Signal, confirms that the new change of direction is in place. Day Traders and Position Traders are waiting to see the start of these Confirmations being made before they Enter their trade.
  • CIRCLE 3.  After the lovely Up Move from Circle 2, we got the first warning that things were running out of puff at the ‘Long Tails’ Doji Candle which appears to the Left of the Circle marked 3. This Candle has an Up Tail and a Down Tail of about the same length and they are very long. We then got another Doji the next day and the clincher that we are Reversing to a Down Move was the Red Doji which has the Body near the bottom - it’s a sort of ‘Inverted Hammer’ but not a text book one. It is worth noting here than whenever an established Trend is in place, as soon as you start getting Dojis the Trend is starting to weaken. It may not Reverse straightaway off the Doji, but it will Reverse very soon - the Trend (Uptrend or Downtrend) is getting tired once Dojis start appearing. Bear this in mind if you look at any of the Major Index Daily Candlestick Charts now.
  • CIRCLE 4.  Then we got a huge Down Red Candle which was quickly followed by a White Doji Candle with a Long Tail down and it is sort of a Hammer Doji - very nice and clear sign that a Reversal is about to happen.
  • CIRCLE 5.  There was then a lot of higgledy piggledy messing about until at Circle 5 we got a much nicer Red Inverted Hammer Doji - this is much cleaner than the one in Circle 3 but you should see the similarity.
  • CIRCLE 6.  A few down days for the Day Traders and Position Traders to spank, and then we got something pretty near a ‘Dragonfly Doji’ - these are the most beautiful things to get as they are extremely reliable indicators that a Down Move is about to Reverse up.
  • CIRCLE 7.  A Lush Upmove followed, then we finally got a near Hammer Doji that marked the top. To be clear, this is not a good one and would have been hard to trade. However, after the Dojis of the next couple of days, an alert Trader would have realised what was going on. Sometimes the Indicators are not easy to spot. It doesn’t matter - just trade the Clear ones and ignore the poor Signals !!
  • CIRCLE 8.  About 6 days down and then a gorgeous Dragonfly Doji - lovely. That’s the Red Thing with Legs right up to it’s skirtline and a nice thin Body (calm down Wheelie, it’s a poxy Candlestick Pattern man, get a grip - go and take a cold shower or something…)
  • CIRCLE 9.  Wow, if you liked the Dragonfly in 8, then check out this Inverted Hammer - a stunner. That is near textbook and great to trade Short off. I really should be a Day Trader……..nah, can’t be arsed.
  • CIRCLE 10.  Anyway, that Shorting Day Trader after the Inverted Hammer banked a huge amount of Points and then saw a sort of Dragonfly thing again at Circle 10. Close that Short !!
  • CIRCLE 11.  On 11, the Price had been dropping and then we got 2 Red Candles side by side, which led to the Big Up White Candle. This 2 day Pattern is technically a Harami (Pregnant Woman viewed sideways on) but in reality it was a pee poor signal and would have been hard to trade.
  • CIRCLE 12.  Neat little Dragonfly type thing after a down move.
  • CIRCLE 13.  An Inverted Hammer after a short move up.
  • CIRCLE 14.  I think this is a 2 day Pattern called ‘Dark Cloud Cover’ - I tend not to trade off of these - I prefer Dragonflies, Hammers, Dojis in general after big Down Moves to buy. Clean and clear Haramis are pretty good as well.
  • CIRCLE 15.  The White Candle in Circle 15 is a sort of Hammer with a Long Down Tail after a similar Red Candle the day before - would have been hard to trade but look at the run up afterwards.

Picture

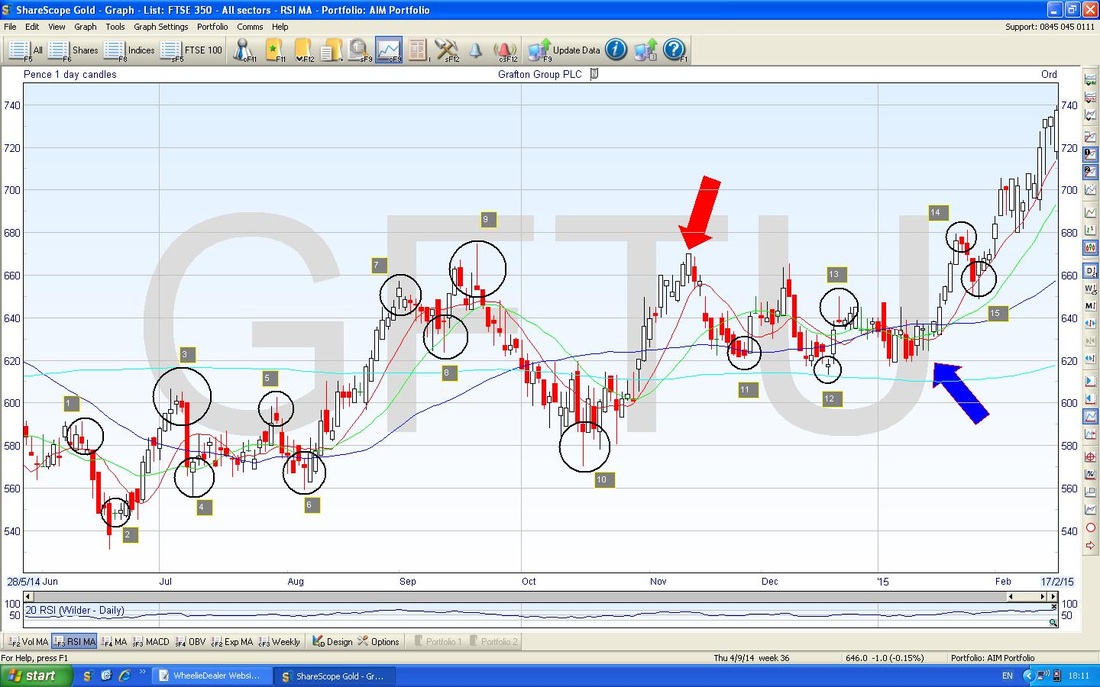
Ok, I hope you liked that, now the Arrows:
  • The Red Arrow points to where it Topped out after a good run up. However, this would be hard to trade except for someone with a lot of expertise - I think there might be a commonish 2 day Pattern here but not one I remember.
  • Where I am pointing to on the Blue Arrow, there is a Dragonfly Doji like thing and a similar Doji on the next day - but they are sort of ‘out of context’ so would have been hard to trade. Combined with other Indicators like Momentum and Relative Strength Index (RSI), maybe it would have been ok for a Trader to see.

It is worth noting that I have kept the above discussion limited purely to the Candles - so you can see their Power without complicating things too much. In practice, if you combine these Indicators with simple things like Trend Channel lines, RSI (Relative Strength Index) and MACD (Moving Average Convergence Divergence), you have a pretty powerful and practicable, Short Term and timely, Prediction Tool. How cool is that?

To be frank, it amazes me how few people use these tricks - simply by reading this Blog you probably are now hugely ahead of the vast majority of Market Participants - this stuff can give you a real and useable ‘Edge’.

Most free Charting Packages will enable you to show Candlestick charts from a Menu rather than simple ‘Line’ charts. I know the ADVFN app on my Fone and Tablets has this function - I use it all the time.

It is worth realising that Candlesticks are ‘fractal’. This means they work on any timeframe - and once you get in the habit, it will amaze you how good they are. You can use on perhaps as little as 5 minutes right up to Months - through a wide span including 15 minutes, Hours, Days, Weeks etc. I use Daily Candles as my main tool and use Weekly ones at the Weekend - Weekly ones are brilliant because as with anything in Technical Analysis, Longer Term Trends/Indicators dominate over Shorter Time Periods.

Hopefully from this Blog you will get a feel for how useful Candles can be - pick up ‘Candlestick Charting for Dummies’ and you can read a lot more on it and boost your knowledge.

Right, I got some washing up to do, see ya, wd
3 Comments
ExPatDealer
6/3/2015 05:38:02 pm

The continual legal disclaimer that "past performance is not an indicator of future performance" does not really seem to stack once one is educated in candlestick methodology. Good summary WD.

Reply
WheelieDealer
7/3/2015 04:04:07 pm

Hi ExPatDealer,

I love the way you put it - Candles are certainly one of the best Predictors out there. In a similar way, it makes a mockery of the Efficient Market Hypothesis - what tosh !!

thanks for your comments, wd

Reply
read more link
16/11/2016 07:30:12 pm

Here, the potential risks are big however the rewards are just as big..

Reply


Leave a Reply.

    'Educational' WheelieBlogs

    Welcome to my Educational Blog Page - I have another 'Stocks & Markets' Blog Page which you can access via a Button on the top of the Homepage.

    I hope you find the Entries here thought provoking and valuable. There is a sizeable Archive starting to build - use the Filters below to take the full benefit. If you have just Landed on this Page, feel free to have a poke around at the rest of my Website (s)....WD

    Blog Index List  now sits on the WD2 Website - click the Button below:


    BLOG INDEX LIST

    Archives

    September 2024
    May 2024
    January 2021
    December 2020
    November 2020
    October 2020
    September 2020
    August 2020
    July 2020
    June 2020
    May 2020
    April 2020
    March 2020
    February 2020
    January 2020
    December 2019
    November 2019
    October 2019
    September 2019
    August 2019
    July 2019
    June 2019
    May 2019
    April 2019
    March 2019
    February 2019
    January 2019
    December 2018
    November 2018
    October 2018
    September 2018
    August 2018
    July 2018
    June 2018
    May 2018
    April 2018
    March 2018
    February 2018
    January 2018
    December 2017
    November 2017
    October 2017
    September 2017
    August 2017
    July 2017
    June 2017
    May 2017
    April 2017
    March 2017
    February 2017
    January 2017
    December 2016
    November 2016
    October 2016
    September 2016
    August 2016
    July 2016
    June 2016
    May 2016
    April 2016
    March 2016
    February 2016
    January 2016
    December 2015
    November 2015
    October 2015
    September 2015
    August 2015
    July 2015
    June 2015
    May 2015
    April 2015
    March 2015
    February 2015
    January 2015
    December 2014
    November 2014
    October 2014

    Categories

    All
    Accounting
    Beginners
    Bonds
    Book Reviews
    Business Information
    Commodities
    Conference Reports
    Danger
    Events
    FOREX
    Fundamental Analysis
    Funds
    Getting Started With Stocks
    Guest Blogs
    Hedging
    Income Portfolios
    Information Sources
    Interviews
    Investment Strategy
    IPO
    Macroeconomics
    Manifesto For Making Money
    Market History
    Market Structure
    Non-Finance Books
    Peer 2 Peer Lending
    Politics
    Portfolio Management
    Psychology
    Retirement/Freedom
    Scores On The Doors
    Selling Rationale
    Short Term Trading
    Social Media
    Spreadbetting
    Stock Buy Rationale
    Stock Ideas
    Technical Analysis
    Templates
    Tools And Techniques
    Trades
    Trading Products
    WD Messages
    Week Ahead Indexes


    Please see the Full Range of Book Ideas in Wheelie's Bookshop.

Powered by Create your own unique website with customizable templates.
  • Home
  • Trades
  • Educational Blogs
  • Wheelie's Bookshop
  • M3 Manifesto
  • Portfolios
  • WheelieBin / WheelieWatchlist
  • Non-Finance Books
  • Beginners
  • Monthly Performance