|
THIS IS NOT A TIP OR RECOMMENDATION. I AM NOT A TIPSTER. PLEASE DO YOUR OWN RESEARCH. PLEASE READ THE DISCLAIMER ON THE HOME PAGE OF MY WEBSITES. IF YOU COPY MY TRADES, YOU WILL PROBABLY LOSE MONEY.
Back on Thursday 29th October 2015, I added to my Aviva AV. Position with a Spreadbet at 490p and now have a nice chunky Stake. I won’t do a huge Blog here but just a quick glimpse of my thinking behind the Buy. At a High Level, you may have seen comments from me on the Website and on Tweets that I think it is a good idea to really pile into the Markets in a big way to take advantage of the Historically strongest period of the Year - i.e the Winter and in particular December (please, please can we have a lovely Santa Rally?)
In order to play to this Higher Order Strategy, I have been looking through my Shares and thinking about which ones I am a bit light on and which ones I can really beef up my Exposure to. You may have seen I closed out the FTSE100 Short Hedge I had running and this obviously gets me much more Long Exposure in one quick action (it‘s a wonderful function of Hedges that you can ramp up and cut down Exposure very fast - much easier than buying and selling stocks and much cheaper). In addition, I have bought a load more 32Red (TTR) as per my recent Blog - just looks very cheap and technically strong. Anyway, along with these actions, it struck me that I could do with more AV. as I think it is very undervalued and I am continually impressed by Mark Wilson the CEO. A side effect of buying AV. is that Life Insurance plays tend to be proxies for the wider Markets - i.e. if the FTSE100 rises then AV. will most likely be dragged up with it.
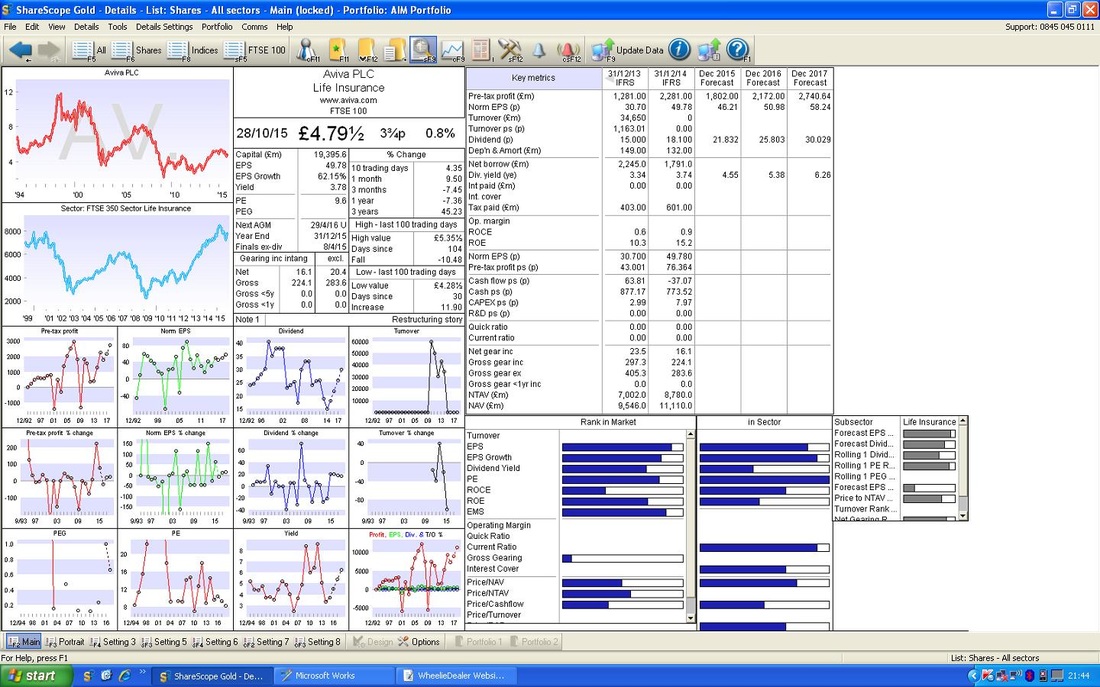
To a large degree my AV. Buy decision was not so much about perfect Technicals - more an urge to get more Cash into the Markets fast. As it happened, things didn’t quite go as I planned. I looked at the Charts on Wednesday Night ‘Out of Hours’ as usual (I always like to make cold, hard, rational, logical, Mr Spock, calculated Decisions when the Markets are closed and not influencing my Emotions so much) and did the usual thing of writing down my ‘Trade Instructions’ for the next morning on the back of an old envelope. So, I went to bed Wednesday Night knowing that I had to buy an AV. Spreadbet of a certain size on Thursday Morning. I then woke up probably around 8.15am or so and thought I would look on my ADVFN app on my Fone (remember, I am still lying in bed at this time and for probably several hours after !!) to see what AV. was doing and as part of this I always check for any new News before doing my Trade. Then, Shock, Horror, I got a huge surprise because there was an Interim Statement that I did not realise was coming. This threw me for a bit - should I do the Trade or not? However, I had a read through the Statement and it looked pretty good so I decided that the Trading Instructions are Set in Stone (no, not the Edstone !!) and I just got on with the Buy. I did a Blog on AV. back in December 2014 which you can read here: http://wheeliedealer.weebly.com/blog/aviva-av-buy-rationale It gives an overview of the Company and most of the stuff is still relevant but the Numbers and Charts have obviously changed. The big fundamental difference is that AV. have since bought Friends Life which was a bit of a surprise but I trust Mark Wilson to not do something stupid and the integration appears to be going well. The recent Interim Statement can be found here: http://www.aviva.com/media/news/ Valuation I won’t dwell on this, but I just want to highlight the undervaluation. As ever, all ShareScope screen images are as per the situation that confronted me on Wednesday Night when I made my Buy Decision. If you look in the Top Right Hand Corner, you should see ‘Norm EPS (p)’ for ‘Dec 2016 Forecast’ of 50.97p. At my Buy Price of 490p, this means a Forward P/E ratio of 9.6 - and I suspect most Readers know that it is generally thought of as Cheap if a Stock trades around a P/E of 10. Something to notice though is that the increase in Forecast EPS between 2015 and 2016 seems quite modest and believable but the increase between 2016 and 2017 looks a lot higher - presumably because the Friends Life Acquisition should have bedded down and Mark Wilson will have increased overall efficiency of the Company - it is clear to me there are Risks around these numbers. As a comparison, Prudential PRU trades on a Forward P/E of 12.3, Standard Life SL. is on a Forward P/E of 16.2 and Legal & General LGEN is on a Forward P/E of 12.4. On this basis, AV. is at least 20% undervalued and I would argue it should be on a Forward P/E of maybe 15 as the Turnaround Story should bring faster growth - if this was the case, then my Target for AV. could be about 765p. Realistically I think AV. could hit 700p with patience maybe in a couple of years. In addition, the Forward Dividend Yield is about 5.2% which is a tidy little bonus while I wait.
Technicals
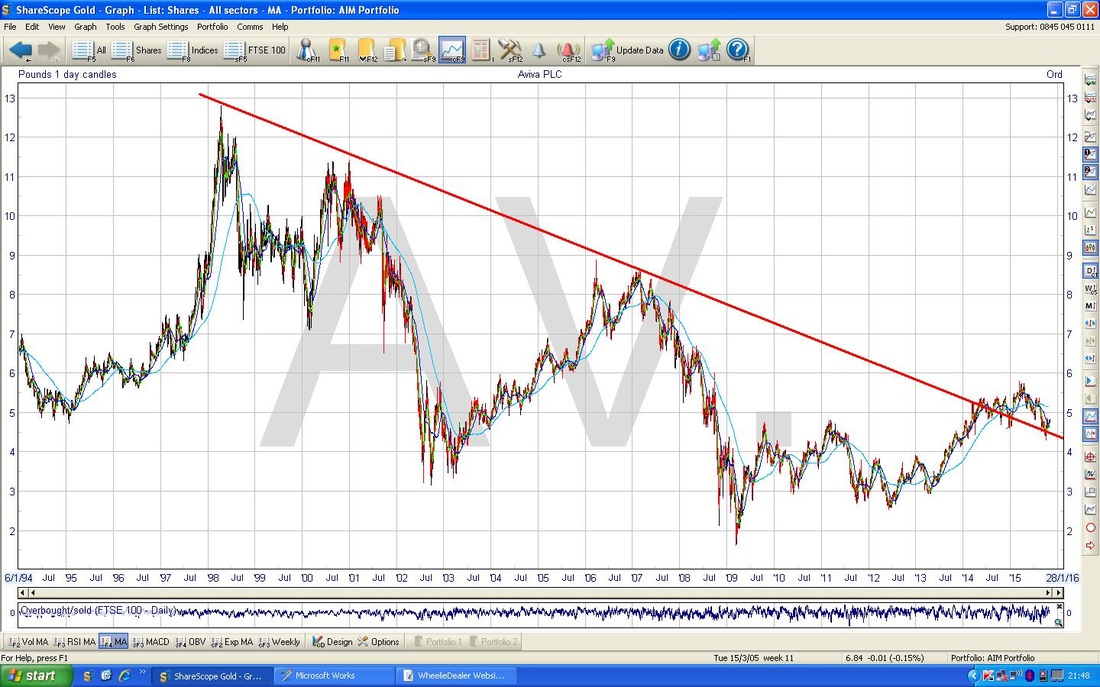
As I hinted at earlier, the Technicals are not perfect on this one in the Short Term but on a Weekly sort of view it is a reasonable Entry Point. On the Extremely Long Term Chart below you should see the clear Downtrend Line in Red that has been going on for about 16 years. Note that last year the Price broke out of the Downtrend and it has since retraced to test Support at that line. This is a very Bullish Development in the Bigger Picture.
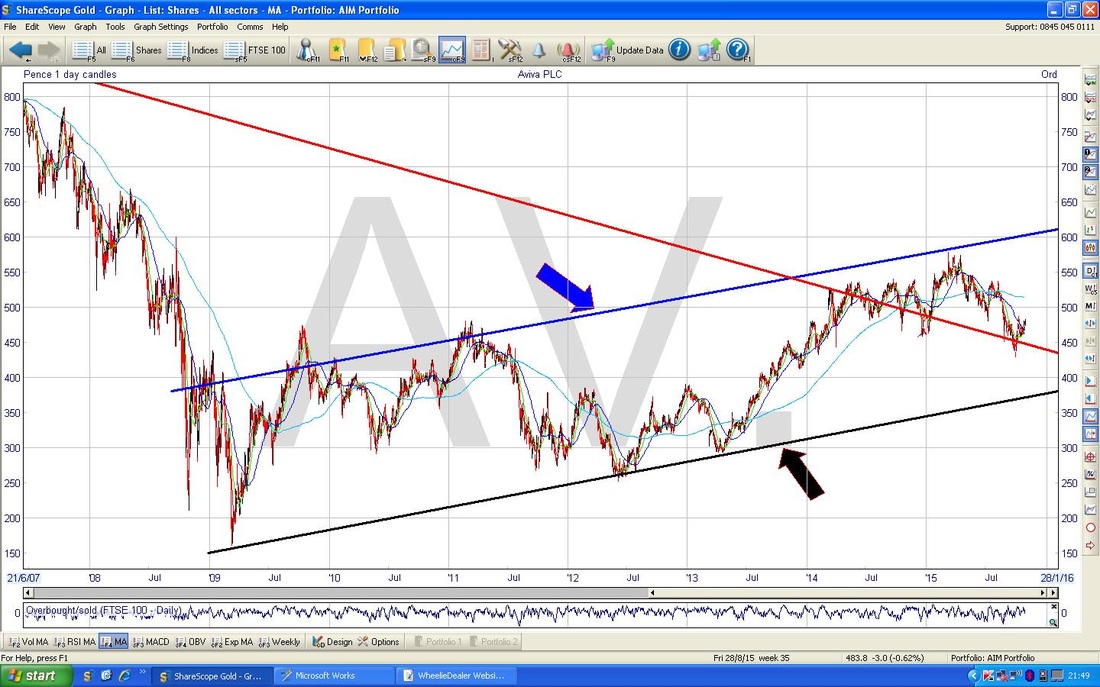
The Chart below is more Medium term - about 5 years. The Red Line is the Downtrend Line from the Chart above but I have added in a new steady, slow, Uptrend Channel which is marked with the Black Line at the bottom (with the Black Arrow) and a Blue Line at the Top (Blue Arrow). My view now is that this slow Uptrend is dominating how things are playing out and the Undervaluation makes me interested anyway.
Note how the Price has recently pulled back to test the Support from the Long Term Downtrend Line and now looks like it is moving back up again.
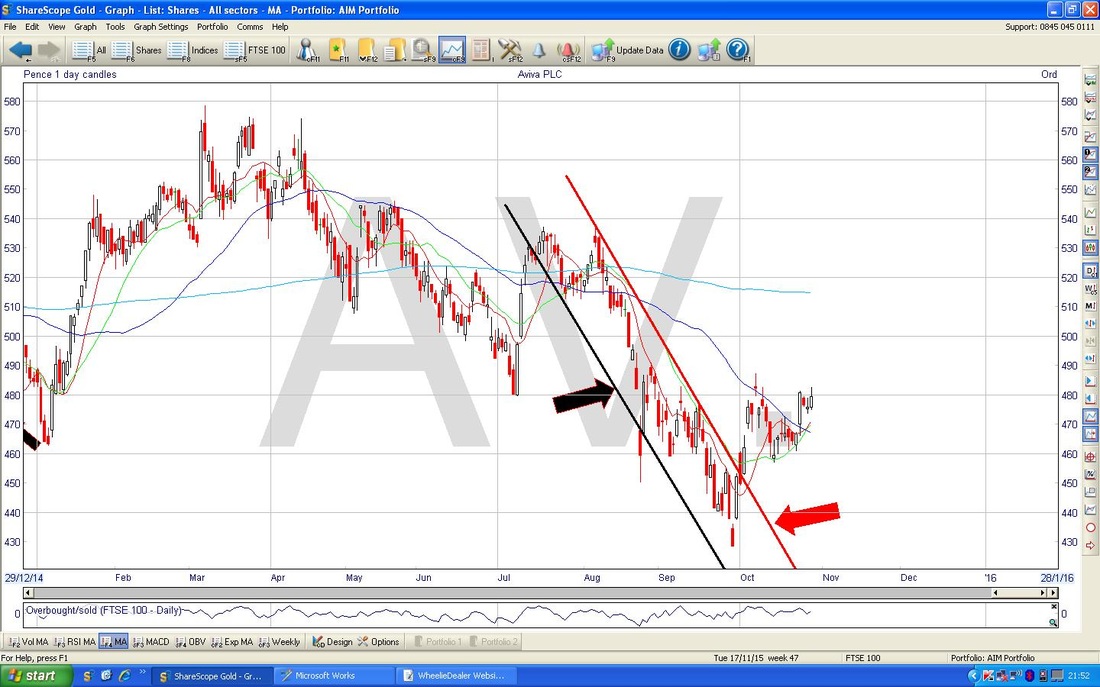
On the chart below I have drilled in to just this year. Note the Downtrend Channel that has been in place since sort of August which I have marked with the Black and Red Lines. Note how the Price broke out of this Channel back at the end of November / start of October. This is a bullish development.
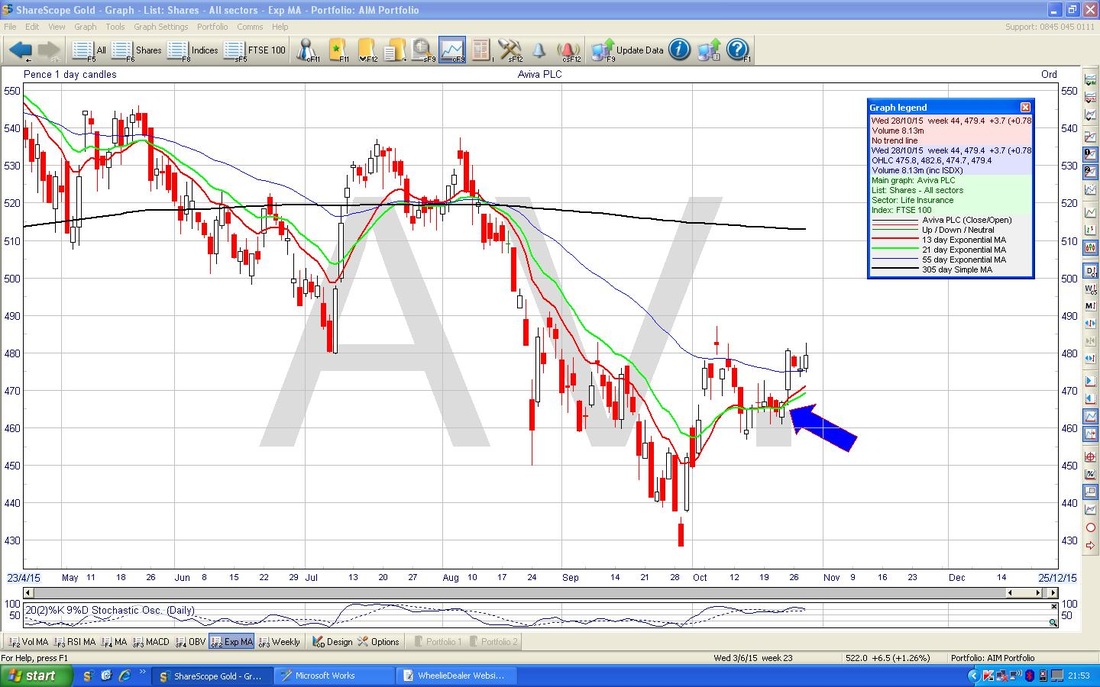
On the Chart below, please look at the Green 2 day Exponential Moving Average (EMA) and the Red 13 day Exponential Moving Average. Note where the Blue Arrow is that the faster (this means it wiggles around more) Red Line crossed the slower Green Line from underneath and is now above - this is a ‘Golden Cross’ and with these EMAs it tends to mean that the Price will keep going up for a few weeks - this would fit in nicely with my wider view of the Markets that they should rise into the end of the year.
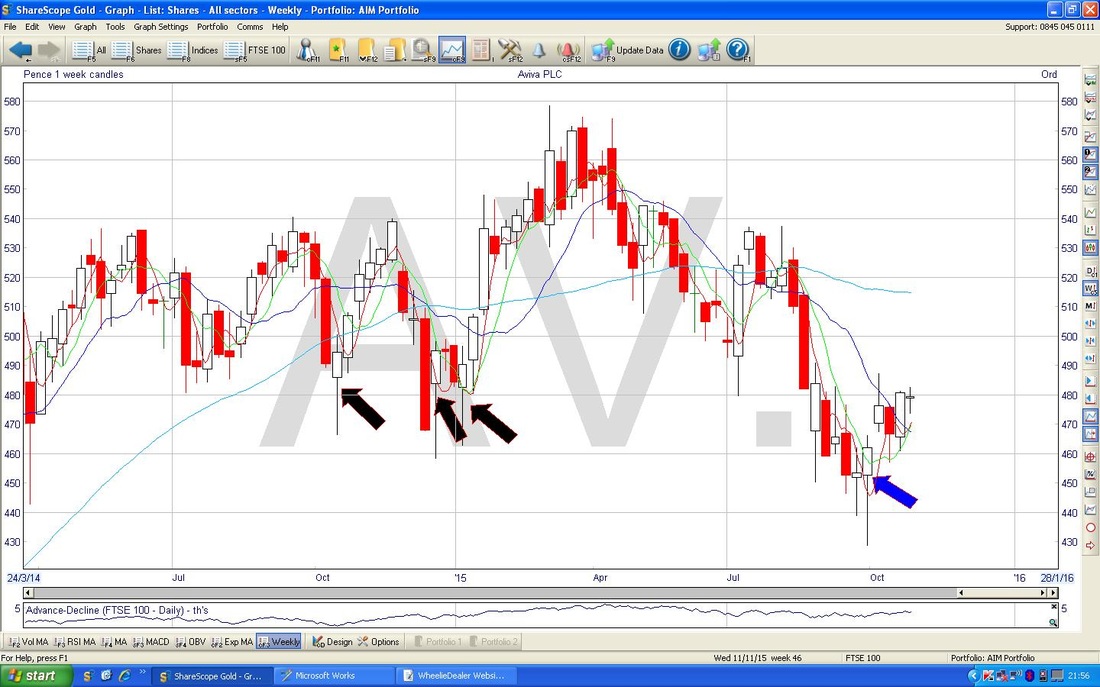
On the Chart below you should see the Weekly Candlesticks. My Blue Arrow points out a ‘Hammer’ candle which I think is marking a Reversal Low where the Bulls have charged in and taken control after the Price was driven down for around 6 months - this is a very bullish development.
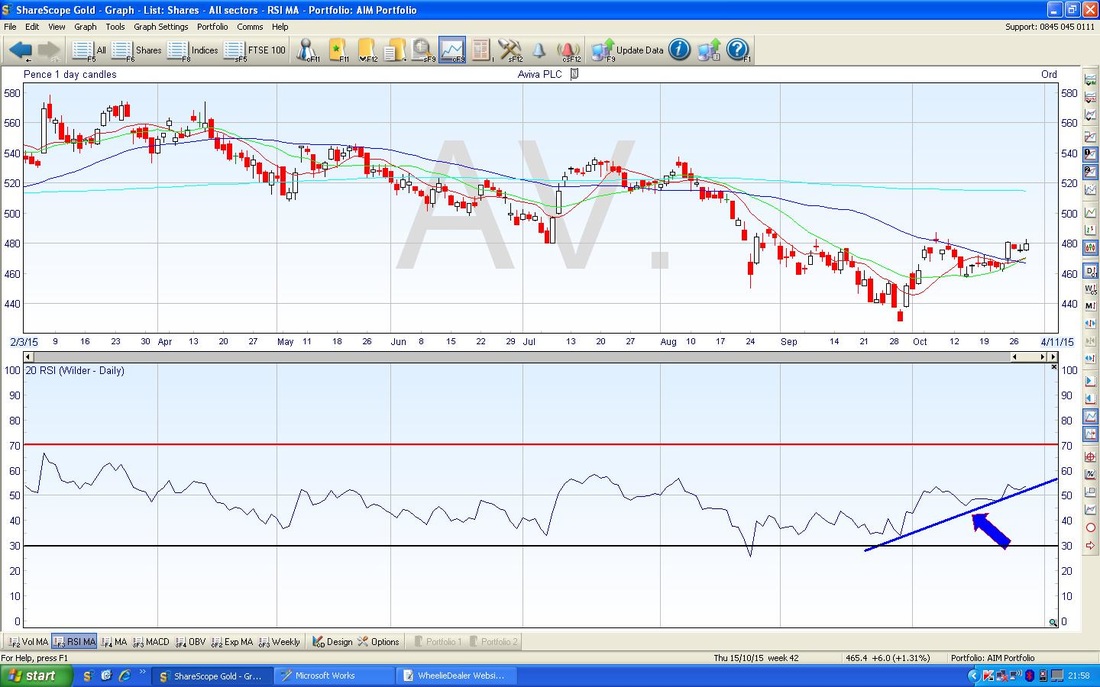
On the Chart below, please look at the bottom window - my Blue Arrow is pointing to an up sloping Blue Line on the RSI (Relative Strength Index) - this is just showing that the RSI is building nicely and recently passed through the 50 mid point - this is usually a bullish thing.
Right, that’s it, wd.
0 Comments
Leave a Reply. |
'Educational' WheelieBlogsWelcome to my Educational Blog Page - I have another 'Stocks & Markets' Blog Page which you can access via a Button on the top of the Homepage. Archives
May 2024
Categories
All
Please see the Full Range of Book Ideas in Wheelie's Bookshop.
|


