|
I was just watching Channel 4 News with them going on about some or other terrible thing that is happening in the World, when something that has been playing on my mind hit me as an idea for a hopefully very quick Blog. Of course, once I actually started bashing it out (this is after starting the Netbook - coal fired, doing the Virus Scan, opening ShareScope, updating ShareScope data, opening MS Works etc. - you get the picture), I found that my very simple idea of one Chart and some words has morphed into 4 Charts and probably a shed load more narrative. To be frank, my original idea was a bit too skimpy and it clearly needed a bit more to give some sensible context for you Reader types.
This Blog is in essence about a possible Short FTSE100 Position which I considered placing on the night of Thursday 17th September 2015, when the S&P500 was screaming at me that it was a good time to put a Short on.
What happened in practice was that I thought about it coolly and carefully for some time but decided that with perhaps just a couple of hundred ‘Points’ on offer, it was not worth putting the Short on. Now I am suffering from chronic Hindsight Bias and thinking that really I should not have been so lazy and I should have taken the Trade because I have really just given away many Thousands of Quids which I could have nabbed.
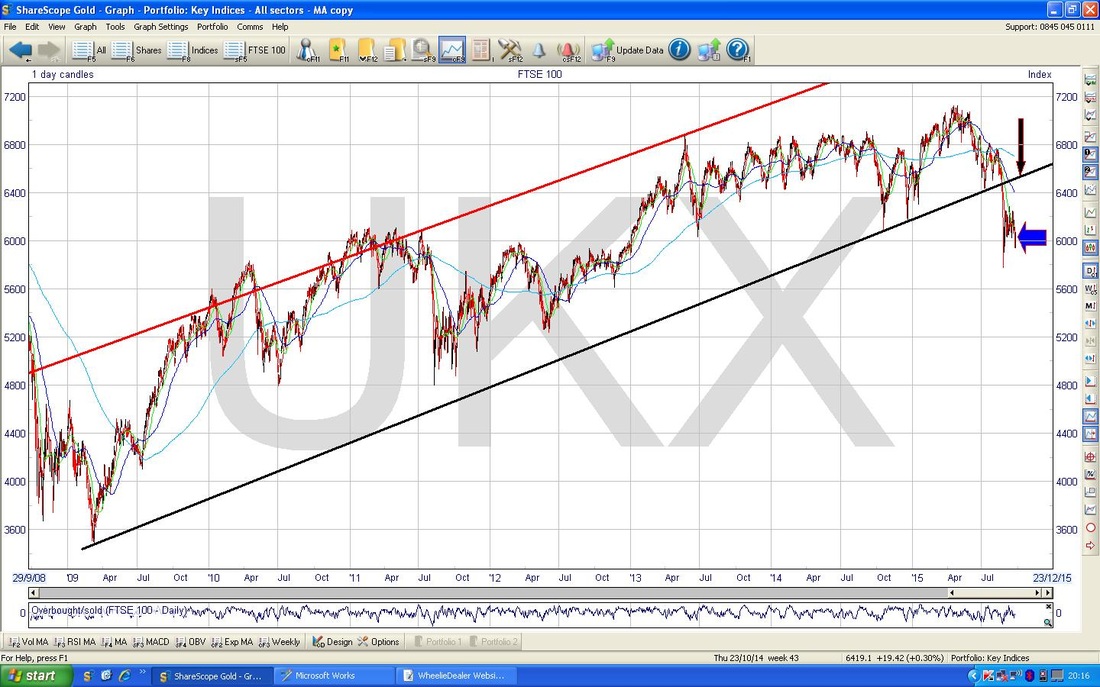
Setting the Scene - FTSE100 The ScreenShot below from the wonderful ShareScope shows the FTSE100 Chart in a Long Term view going back to the Lows in 2009. I have shown you this Chart many a time but I want to just point a few things out - that are perhaps not really truly in line with the real Subject of this Blog but they are worth drawing attention to. You should see the Uptrend Channels with the Red Line at the Top and the Black Line at the Bottom. Obviously the Top Line is long gone and irrelevant probably for a very long time, but the Black Line is a cause of a lot of concern. You many recall that I mentioned this in a Blog before where the Price Line had fallen down through the Black Line and that this was a worrying development - however, at that point, it was retrievable - now things look quite a worry to me. My Blue Arrow points out where the Price Finished at the Close of Play today (Weds 23rd Sept 2015) and you can see this is quite a way down below the Black Bottom Line of the Uptrend. The worry now is that even if we can avoid going lower than the Low put in on Black China Monday (24th August 2015), if the Price rises up from where it is now, it has the obstacle of needing to get over the Black Bottom Line - I have marked this with the Black Arrow. The danger is that the Price moves up to sort of where the Black Arrow is (or probably a bit higher up as it may take a few weeks to do it), but then it bounces down off the Black Bottom Line and fires downwards - this will obviously cap any progress. It is extremely likely that this will happen and it could mean the best possible scenario is that we trade in a Range between maybe 5900 ot 6500 ish for a long period of time - that would be very tedious. Of course, it is possible that we go lower from here and crash down through the Black China Monday Low at 5768 and this would be nasty. Personally, I suspect this is less likely than a rally. I talk about this possibility more further down. Another possibility is that the Price moves back up to where the Black Arrow is and then smashes through the Black Bottom Line and gets back in the Uptrend - this is really unlikely.
S&P500
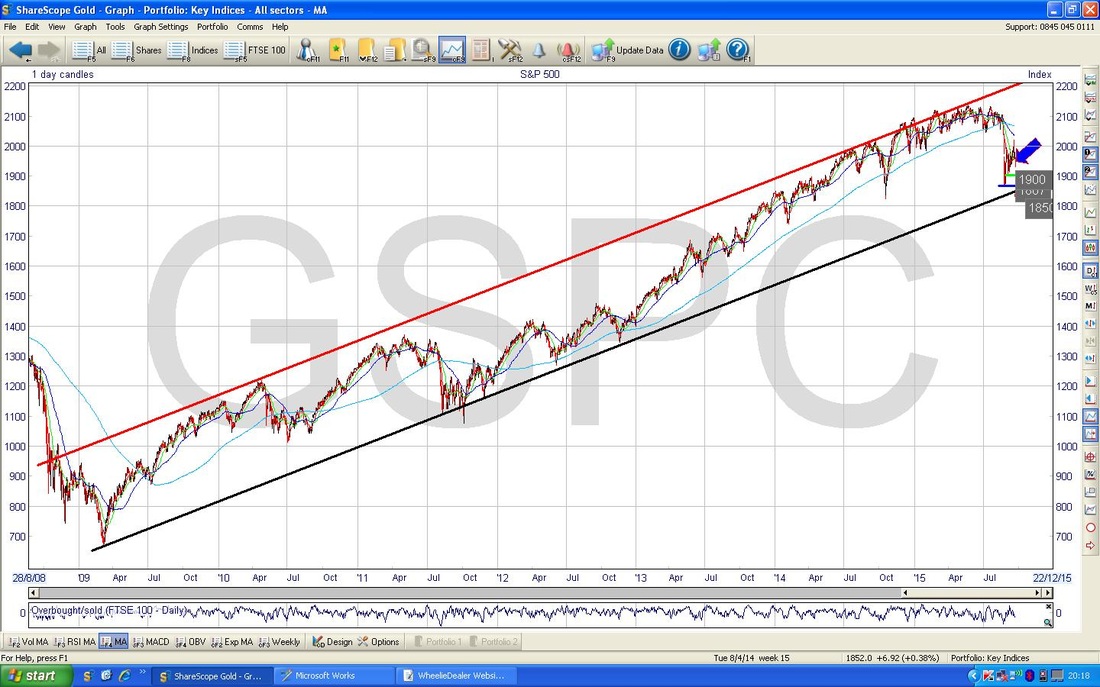
OK, enough Gloom and Doom, let’s try and cheers things up a bit. The Chart below shows the S&P500 going back to the 2009 Lows and you should be able to see the Lovely Uptrend and how the Price is still within the Lines - well, this is with data up to date by End of UK Trading so it does not include the Price Action of the US today (Weds 23rd Sept 2015). My Blue Arrow points to where we closed Last Night. The key level for me here is the 1850 to perhaps 1800 area - if these fail then the Uptrend could be broken and it really is Game Over for the Bulls. At the moment, the US is saving UK and Europe from a big drop.
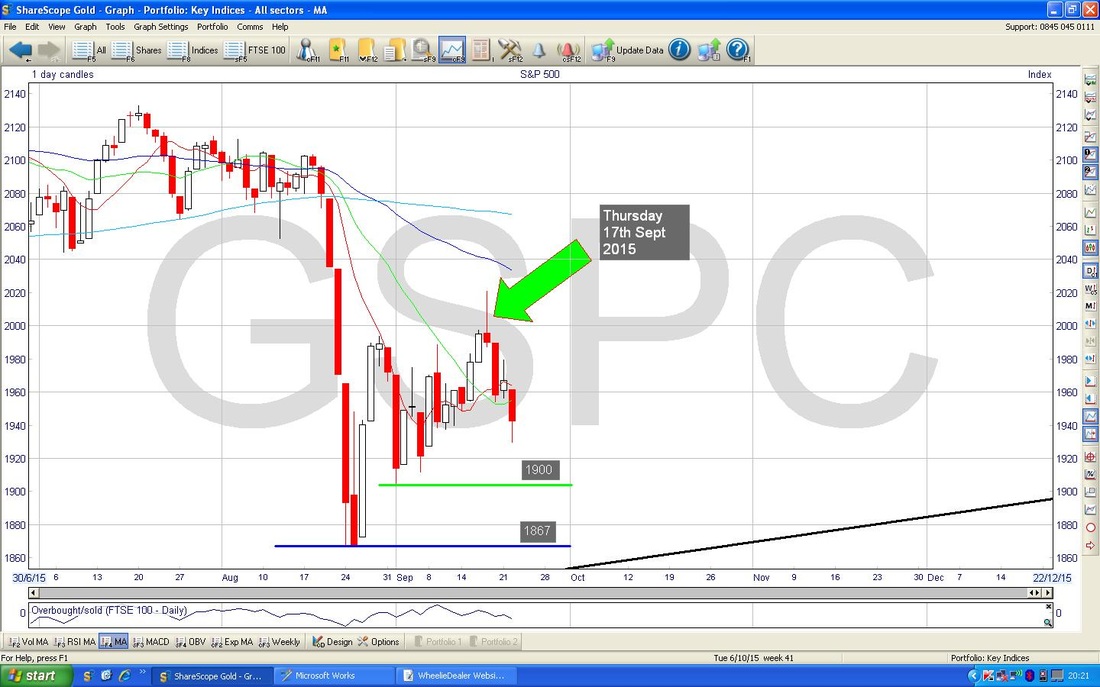
Right, the Chart below zooms in a huge amount more and looks at the situation on the S&P500 with the emphasis on Thursday 17th September 2015 when I was making the decision about whether or not to place a FTSE100 Short Spreadbet on.
The thing to note here is that my Green Arrow points to the Inverted Hammer Candle which was generated on the Night of Thursday 17th Sept. After the run up for a couple of weeks, the context was bang on for this Inverted Hammer to be a ‘Key Reversal’ Signal. I saw this and tweeted it out and even mentioned that I was thinking about putting a Short on. As it happens, I weighed everything up and I decided that it wasn’t worth putting a Short on as it might be for only 150 Points - the Price I was being quoted by igIndex was around 6150 I think and I was reckoning it could fall to about 6000 points. It just didn’t seem to be worth the effort. Of course, then my Hindsight Bias starts to kick in - what actually happened was that it did drop and fell heavily yesterday in particular - had I placed a Short, I would have made a Chunk of Dosh which on the Thursday Night looked pretty likely. This of course would have been a nice Hedge of my usual Long Portfolio which is why I like to do my Shorting. My Hindsight Bias tells me I should have put a Short on with a Stoploss just above the Intraday High on the Thursday Night - which was around 6250 - this will be clearer on the next Chart. My thoughts that 6000 would kick in as Support were a bit silly - with Hindsight no less, it is more obvious to me that after the Inverted Hammer I really could not predict where the Price was going to go. In reality, it could easily keep on falling even now. When I get such a great signal, maybe in future I should trade it. Had I put such a Trade on, I could perhaps have made at least 200 Points in the fall and at for example, £10 per Point on a Spreadbet, that would have been £2000. Whatever………
Back to the FTSE100
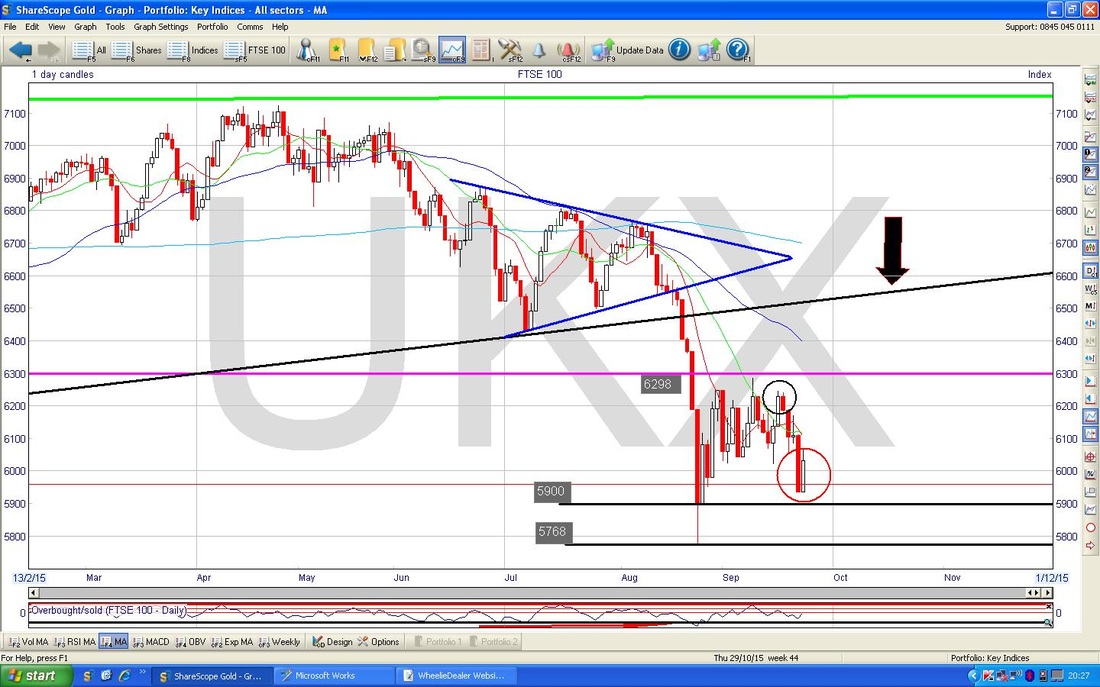
The Chart below shows the situation on the FTSE100 on that Thursday Night (17th Sept 2015). My Black Circle shows the 2 Day Candle Pattern which was in effect an Inverted Hammer (if you imagine that Price Action in one day - ok, it’s complicated if you don’t know Candles much - trust me). I think the 2 day Pattern might be called a ‘Dark Cloud Cover’ - whatever, it was confirming the clear Inverted Hammer that was generated on the S&P500 - and obviously where the US leads, we tend to follow. Something else I just want to point out is that today (Weds 23rd Sept) we generated a 2 day Pattern called a ‘Harami’ - this is the Pregnant Woman viewed from the side one. After a period of down days, this is a Bullish Setup and perhaps we can rally from here. Would be nice. I have also shown the Low from Black China Monday of 5768 very clearly - if this fails, we are in the Poo big time.
There is a risk that the whole collection of Candles over the last 3 Weeks or so could be forming a ‘Bear Flag’ - this is where the Price has fallen a lot like a ‘Flagpole’ (but upside down) and the subsequent Price Action has formed the ‘Flag’ bit (come on, use your imagination !!).
If this is a Bear Flag (many Chart Readers are claiming it is) then we could be facing a Big Drop to maybe as low as 5300 - the Fall tends to be to equal ‘height’ as the Flagpole - roughly 600 Points. If this nasty scenario plays out, I really need to have Short FTSE100 Spreadbets on !! The Trigger for such a Bear Flag playing out nastily would be failure of the Black China Monday Low at 5768. So, it’s clear I am really riddled with Hindsight Bias, better see the Market Doctor…….. On a serious note, I think the Lesson for the future is that when I see such a good looking set-up, I perhaps need to be less lazy and get a Trade on - using a Stoploss could protect me from the Markets rallying. Here’s to a surprisingly good October (fat chance), wd
2 Comments
Catflap
23/9/2015 11:00:07 pm
Thanks for the informative post. Looking at the monthly charts the ftse is at very oversold levels not seen since 2008 and at the bottom of Bollinger bands on all time frames. Perhaps we will see some more constipation around the 6000 level first before such a move ? Yellen speech tomorrow, so i expect more volatility one way or other.
Reply
WheelieDealer
23/9/2015 11:36:57 pm
Hi Catflap, thanks for the feedback etc. I haven't got my Charts setup on the Monthlies - seems like I ought to !! My hunch (but without any real facts to back it up sadly) is that you are right and we will stay above that 5768 Low on FTSE100 and form a base around 6000. Having said that, my suggestion of a Range between 5900 - 6500 might be what happens.
Reply
Leave a Reply. |
'Educational' WheelieBlogsWelcome to my Educational Blog Page - I have another 'Stocks & Markets' Blog Page which you can access via a Button on the top of the Homepage. Archives
May 2024
Categories
All
Please see the Full Range of Book Ideas in Wheelie's Bookshop.
|


