

|
educational blogs |
|
It’s that time again on a Sunday Evening when I look at the charts and try to figure out what is most likely to happen in the coming Week/Weeks. Of course there can never be any certainty about anything but I like to try and be on the side of the Most Likely Outcome - in effect I want to stack the odds on my side, but I also need to have a Contingency Plan just in case I am wrong.
Despite all the Bearish Chatter, I am still not convinced we are heading into a Sustained Bear Market. Let me be clear on this, the Definition of a Bear Market is a fall of 20% from the Peak - but in all honesty this is completely useless to us as Investors.
A much more useful way of looking at a Bear Market and the type of conditions I want to avoid are when the Major Trend of the Markets (by this I mean periods of maybe 6 months or more, but it is a loose distinction) has turned down and this is likely to be sustained. A drop of 20% is pretty idiotic really as a Definition because it is very likely that a Market will rally from such a drop - certainly over a period of Months this is the case. What I am more worried about is the kind of Market that gets into a Long Term Downtrend of perhaps a Year or so - this is where big money gets lost.
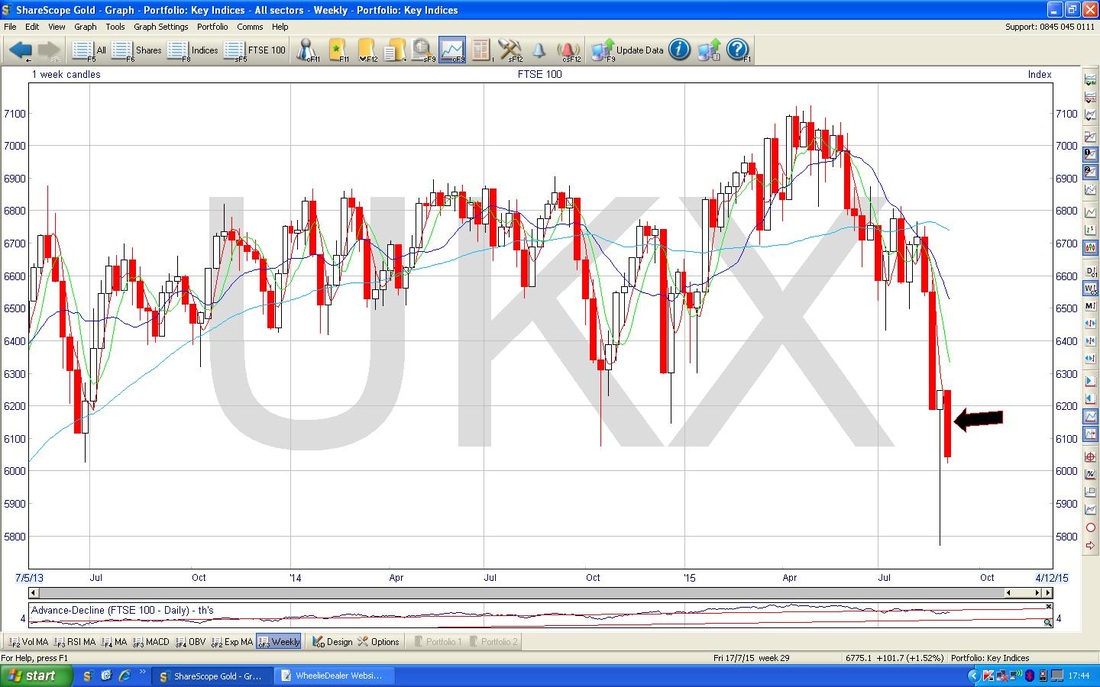
A Correction is defined by the Media etc. as a drop of 10% from the Peak - again, this is utterly useless and to me a ‘Correction’ is when the Price has retraced within a Major Long Term Uptrend and pulled back to the lower Support Line - it might only be 7% or could be 13% or whatever - who cares?, the point is that the Major Uptrend is still intact. Fundamental Reasons to be a Bull As per my recent Blog, my view is that the China thing is totally overblown and low Oil Prices are a massive boost to Western Economies - which are now in good shape to withstand headwinds from a China Slowdown and difficulties in the Commodity Producing Countries. Simon Thompson in this Week’s Investors Chronicle makes the point that Bear Markets rarely (if ever) take place without the US Economy being in a Recession or at least about to go into Recession. It is obviously the case now that the US Economy is growing nicely - despite all the Bearish gibbering. Equities are still the only game in town when it comes to Asset Classes. Bonds gives almost no yield and are clearly in a Bubble, Gold is toast, Property is very expensive in the UK but not too bad maybe in the US and in Europe, Classic Cars are a Bubble, Cash is paying next to no Interest. Stocks are offering good dividend yields and in P/E Terms are not expensive - in fact, I am starting to see a lot of Stocks that are clearly undervalued - for example, AA. on a Forward P/E of 9.4, AV. on a Forward P/E of 8.5 with a Forward Divvy Yield of 5.62%, BA. on a Forward P/E of 11.7 and Forward Divvy Yield of 4.85% and that’s without even trying to find value. The Chartists will claim that these Stocks are going to fall to the floor - they might be right, but the idea that Valuation does not matter is wrong. With Yields almost non-existent on most Asset Classes, cheap Stocks with big divvys will get picked up. Strategy As I have mentioned many a time, the Autumn months of September and October are nearly always pretty nasty and CAUTION is the watchword here. I am pretty much doing nothing in terms of Buying now and I am looking to see if the Bears are right and if I need to get some FTSE100 Shorts on to Hedge my Long Portfolio. My Cash is very low at the moment in my ISAs so I don’t have a lot of Buying Power there - I could in theory take on more Leverage and go Long (Buy) using Spreadbets but this is a Very High Risk strategy when Markets are in a Bad Mood. The Key thing to watch for is a Breakdown below some Key Support Levels on the FTSE100 and the S&P500. If we get an Intraday Break of these Support Levels I will not be just rushing to put a Short on - I will carefully assess the Charts Out of Hours and only if they look convincing to the Downside will I put a Short on. It just doesn’t sit comfortably with me to be Shorting when Markets are Low - remember, ‘Buy Low, Sell High’ - by Shorting down here I feel like I am in effect Selling Low. To avoid this problem, if I do put a Short Position on I will use a Stoploss above it, so that if the Markets Rally, I will get Stopped out and take a Small Loss. As I said above, Fundamentally I think Equities are the only place to be so there is a Big Risk that Markets could Rally hard at some point if they get really beaten up. A Stoploss will save me from such an eventuality. The cost of any such Stoploss getting triggered is in effect the Premium I may need to pay for Downside Insurance. The Vital Support Levels that would trigger me to Short are 5768 on the FTSE100 and 1850 on the S&P500. Because I would be Shorting the FTSE100 via a Spreadbet (Remember, you can Short the FTSE100 by buying the XUKS ETF (Exchange Traded Fund)), it is the Support Level of 5768 that matters most to me. I would want to see a convincing breakdown of these levels. For instance, if the level is breached Intraday but the Market rallies and does an Intraday Reversal which results in a Hammer Candle, then I would not put a Short on as it is likely it can move up - especially if the RSI (Relative Strength Index) reading is very low. Right, let’s have a quick look at the Charts. FTSE100 The Chart below is very similar to one I posted a couple of Weeks ago - I have left a lot of the Support Levels in as the ones above the Current Price now will become Resistance Levels. The Black Arrow marks the Long Term Uptrend bottom line which failed - this was a very bad Technical Event and is a worrying sign. What is more worrying is that after the Big Collapse to the 5768 Low on Black China Monday (24th August), the inability for the Market to Rally and get back into the Uptrend is very negative. So far, it hasn’t even been able to get back up to the Black Uptrend bottom line - shows a lot of weakness. Note the most important Support Level in the very short term is 5900 - if this holds then it would be a good sign for the Bulls. 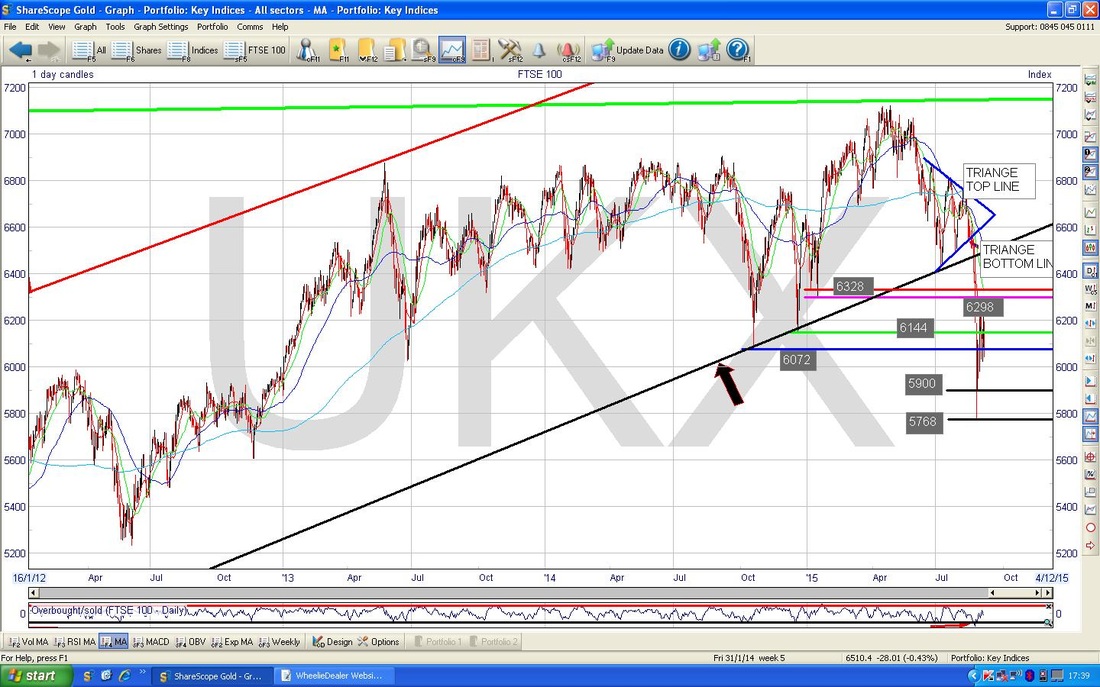
The Chart below zooms in and shows things up close. My Red Arrow points to a Big Red Down Candle from Friday 4th Sept - this is a Bearish development and may signal a difficult few days to come. The 5900 and 5768 Support Levels are clearly visible here.
My Blue Arrow marks how the Market tried to Rally off the extreme Lows of Black China Monday but has failed miserably and note that a subsequent attempt failed at an even lower level - this is the sign of a tired Market with no Upwards momentum. 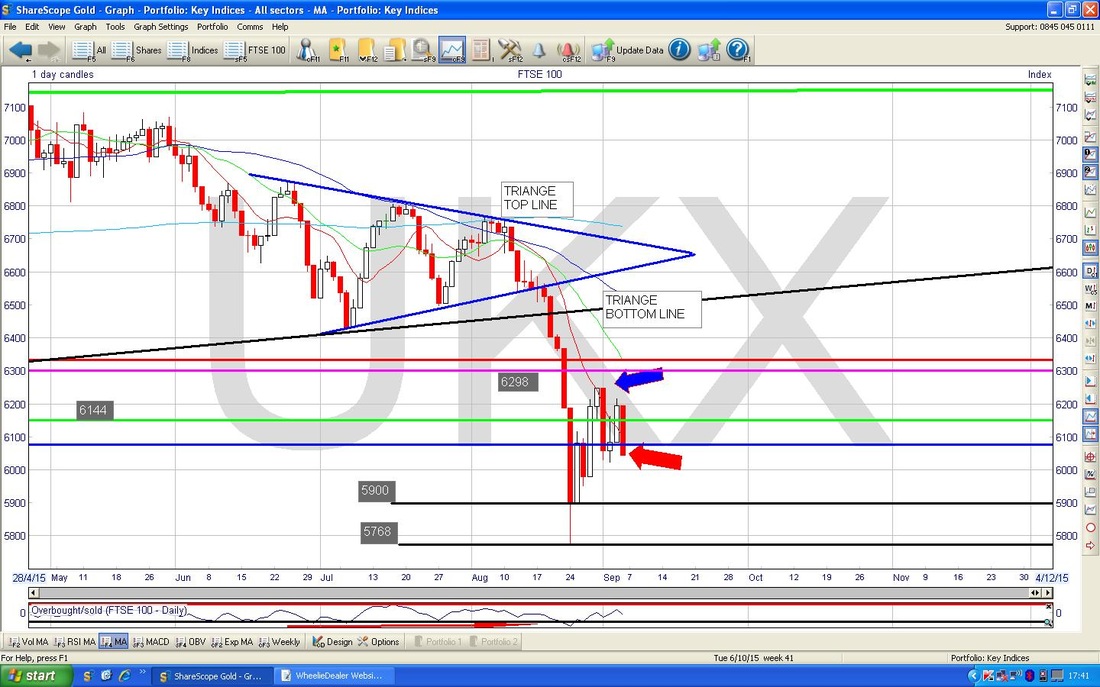
The Chart below in the bottom window shows something that might be a little more encouraging for the Bulls. The MACD Histograms (Moving Average Convergence Divergence) that I have marked with the Blue Arrow are still doing a ‘Hump’ and perhaps it can move into the Positive Green part of the Chart - look to your left to see how these often develop. It is not much to get excited about though.
The Black Arrow points to how the Continuous MACD line and the Dotted MACD line are moving - they are just another way of representing the MACD Histograms. 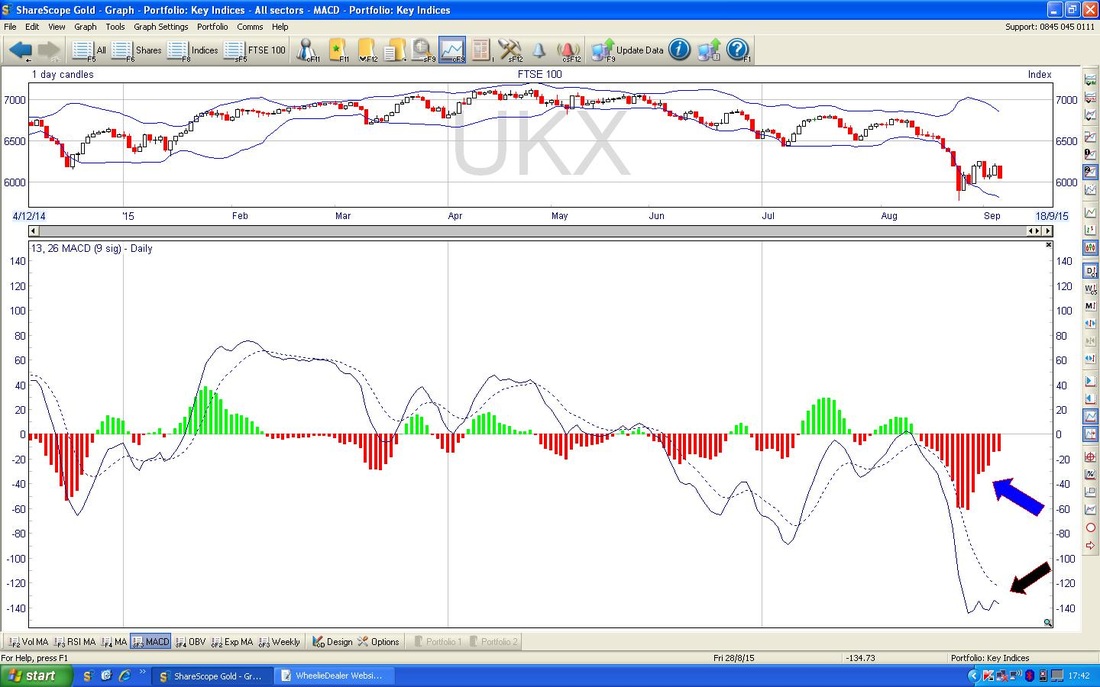
On the Chart below, the bottom Window shows the RSI (Relative Strength Index) - as you can see where my Blue Arrow is, the current RSI reading is about 38 but you might be able to just see that it in effect did a ‘Double Top’ where the RSI got up to about 42 early last week and then dipped and tried to move up again but failed at 42 for a second time - this is not Bullish behaviour really but we should not read too much into it I feel.
Fact is, the RSI at 38 is low but it can go a lot lower - which means we could drop a lot more on the FTSE100 before getting Oversold. 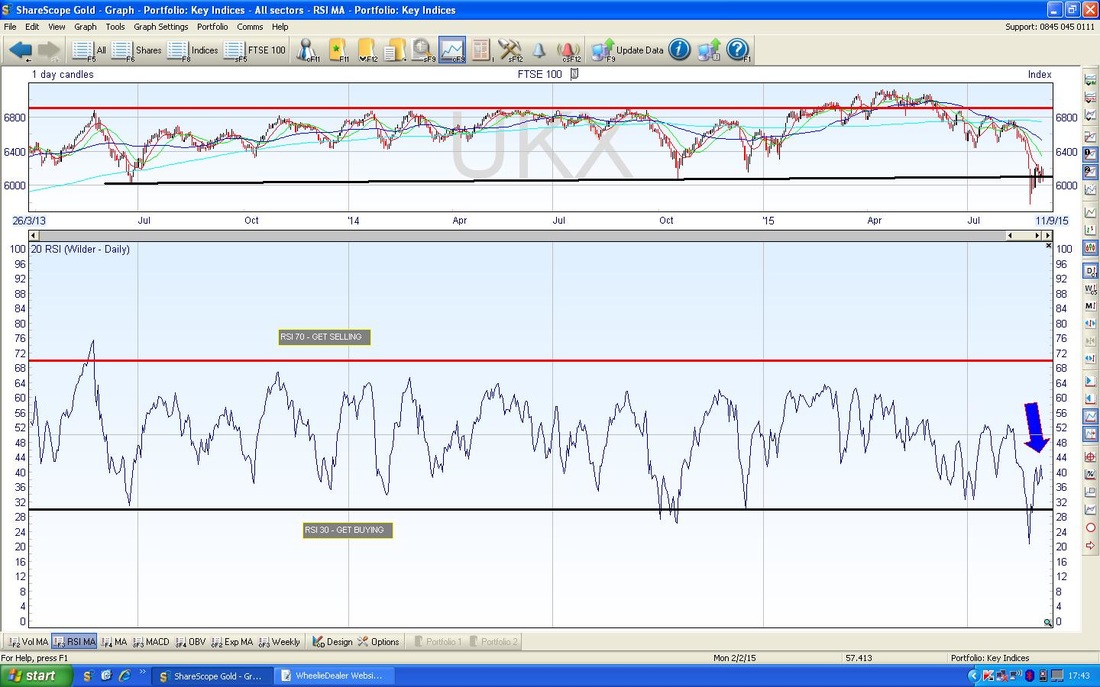
The Chart below shows the Weekly Candles. My Black Arrow points to a Big Down Red Candle from last week and the problem with this is that the Hammer Candle with the big long Tail from the week before was not built on in a Bullish way. In effect, last week’s Candle negated all the good work of the Week before’s Hammer.
S&P500
I showed this Chart a couple of weeks ago - this shows that the Long Term Uptrend from about 6 years is still intact but the Price is testing the Bottom Line of the Channel which I have marked with the Black Arrow. If this line fails, then we could be in trouble - although a quick ‘Overshoot’ followed by getting back into the Uptrend would be ok. A drop to 1800 might be something we can recover from - but it would not be good really and it would be a cause for concern. 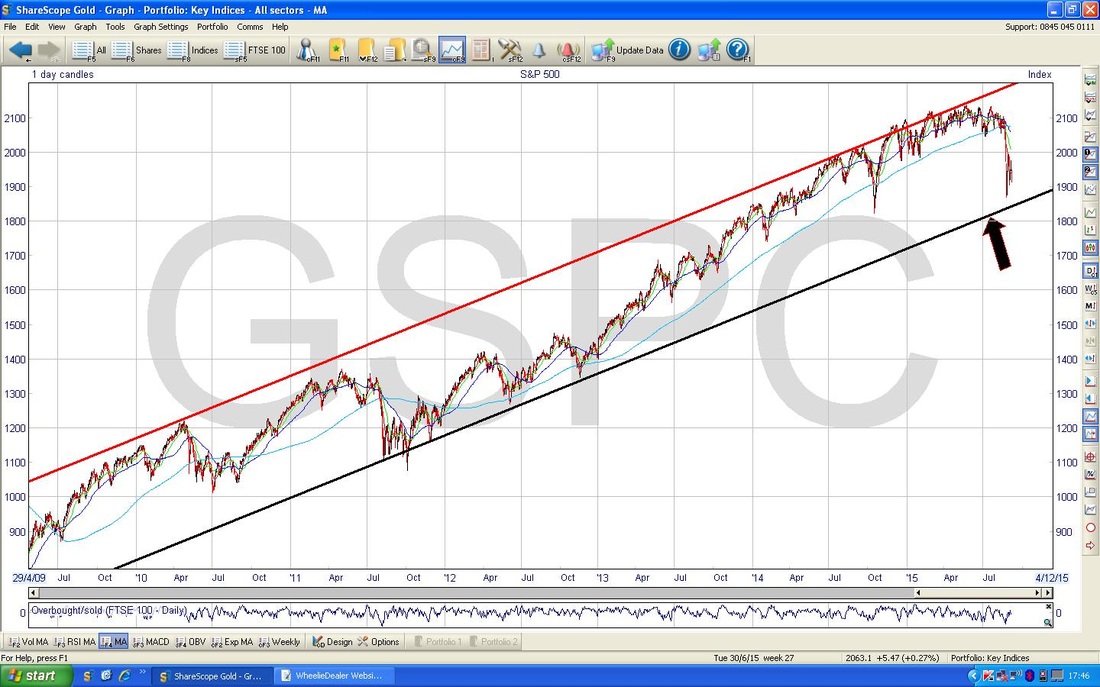
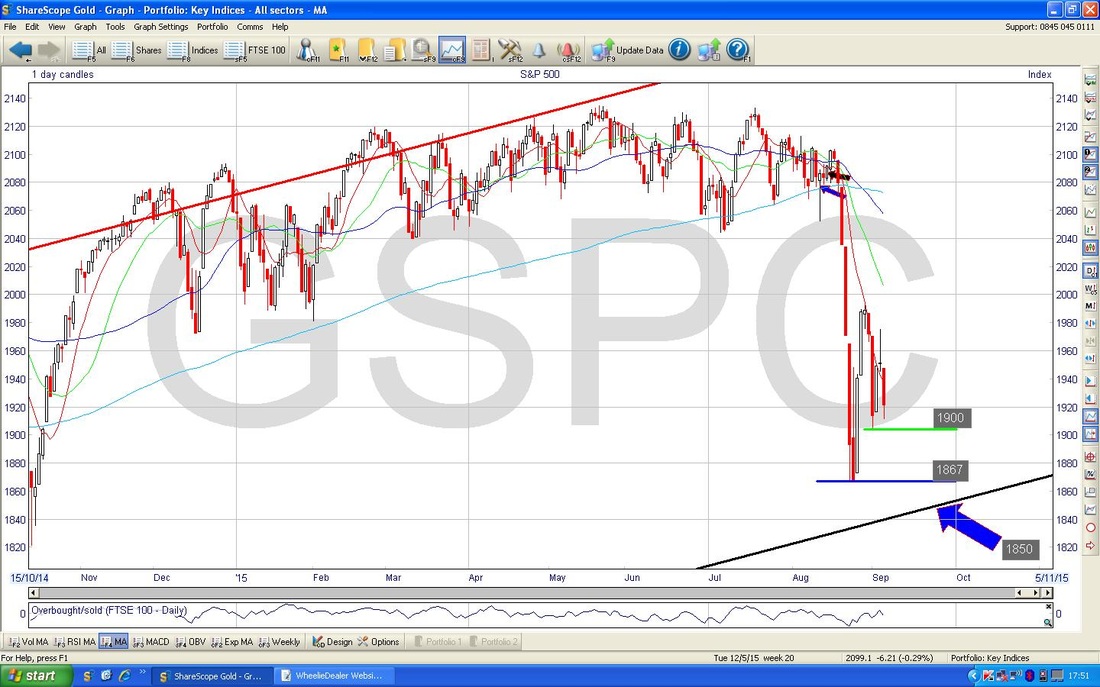
The Chart below shows the much shorter term for the S&P500 - in this case you can see the Key Support Levels and my Blue Arrow marks the Support Level of 1850 is where we need the Price to hold. As I mentioned above, if 1850 fails then we could be in Big Trouble.
I won’t include Charts for Gold and Brent Oil here but needless to say they both look bearish.
Anyway, watch those Support Levels - 5768 on the FTSE100 and 1867 & 1850 on the S&P500. I get the feeling it will be an interesting week - go careful out there !! Cheers, WD
8 Comments
Catflap
6/9/2015 11:16:08 pm
WheelieDealer
7/9/2015 11:38:58 pm
Hi Catflap, looks like you were right - such a relief to have a nice dull monday !! wd
catflap
8/9/2015 03:00:29 pm
Hi Wheelie.
WheelieDealer
9/9/2015 11:54:15 pm
Hi Catflap, I think I'm replying to your comment below - ironic that I have no clue how to use my own website !!. I am writing this on Weds Night 9th Sept near midnight and after a poor showing in the US it looks likely markets will fall tomorrow and maybe friday. I am still overall in the Bull Camp but like you I don't expect much for a while - maybe we will see a test of the Monday 24th August Intraday Low - but I don't expect it to fail and go lower than this.
steve
7/9/2015 02:38:29 pm
no need to panic whilst the S&P500 is above its trend line, which you would think that it would test this week.
WheelieDealer
7/9/2015 11:41:05 pm
Hi steve, I agree with you - the US tends to drive things so if we can stay above 1850 and at a stretch 1800, we might be ok. It will be very interesting to see how these things play out - will we get a big autumn drop or was Monday 24th August the low point? Who knows? cheers wd 10/9/2015 09:47:46 am
Nice post, Thanks for sharing Informative Information by chart .
WheelieDealer
10/9/2015 11:51:38 pm
Hi Paula, Leave a Reply. |
'Educational' WheelieBlogsWelcome to my Educational Blog Page - I have another 'Stocks & Markets' Blog Page which you can access via a Button on the top of the Homepage. Archives
May 2024
Categories
All
Please see the Full Range of Book Ideas in Wheelie's Bookshop.
|
