

|
educational blogs |
|
THIS IS NOT A TIP OR RECOMMENDATION. I AM NOT A TIPSTER. PLEASE DO YOUR OWN RESEARCH. PLEASE READ THE DISCLAIMER ON THE HOME PAGE OF MY WEBSITES.
As Regular Readers (Sufferers?) and Twitter Followers (true suffering) will know, I am in Summer Mode at the moment and updating the Website is not really top of my list for fun things to be doing !! But it’s no big deal - it just means less Blogs and I will be skimping over this one - I will outline why I bought the Stock and what the Risks are and the Valuation Case, Targets and Technicals - that should give you a good idea of why I have put more money into TTR.
Investment Case
TTR is an on Online Gambling Company that runs many branded Casino and Bingo Websites and suchlike; they are AIM listed and operate out of Gibraltar. I won’t go into details on the Company because Readers can click on the link below and dig around their Website for full details: http://www.32redplc.com/investors.aspx The big interest for me to buy here comes from the resolution of the Point of Consumption Tax (POC Tax) which was recently brought in by the Coalition Government and caused a large sell-off in all Online Gambling Stocks as no one really knew what the impact would be. It turns out that the POC Tax is good and bad for the likes of TTR. On the negative side it means they are paying a lot more tax, but on the positive side, it means stricter Licencing and Regulation and effectively will reduce the Competition that TTR faces - this is a great thing because the Online Gambling Sector has been notoriously competitive as unregulated Operators from Overseas were able to attack the UK market - that is no longer the case. Despite the POC Tax being pretty much resolved as an issue now, I think the market is still being slow to wake up to the extent to which Online Gamblers got sold off and they are still in general very cheap - TTR is especially good value as I will reveal in due course. Another big attraction is that the Sector is undergoing a lot of Merger & Acquisition activity - just last night Ladbrokes (LAD) got involved in a deal with Coral Bookmakers and the likes of 888 and BPTY (BWIN Party) have been involved in deals. On this basis, I think it is quite possible that TTR could be bid for or, in a less rosy scenario (but good nonetheless), TTR could acquire a few Small Players itself and boost its growth rate. On the downside, as I mentioned earlier it is an extremely competitive sector although this may reduce as the POC Regulations make it harder for New Entrants to come in and some smaller existing Competitors may withdraw from the Market. In addition, more Consolidation in the Sector could reduce the overall degree of Competition as Major Players become more Oligopolistic - oh, the wonders of Regulation !! On the subject of Regulation, that is the other big risk really. However, with the Conservatives back in power and after the introduction of the POC Tax, it seems likely that Online Gamblers will be left alone for a bit - this means we might get a couple of years without interference and the likes of TTR can rack up the profits. Punters won’t stop gambling……… Valuation As ever, these ScreenShots are taken from the wonderful ShareScope software which I subscribe to and were captured Last Night (Monday 22nd June 2015) and therefore this is the same information that I was confronted with last night when I made my ‘Out of Hours’ decision to Topup my existing Holding. The screen below shows in the Big Box on the Top Right Hand Side all the key financial numbers achieved in the last 5 years. I have put this here because I want Readers to look at the progression in Revenues (Turnover), Profits, Earnings Per Share (Norm EPS), Dividends, Cash Flow, Cash Per Share, etc. You’ve got to admit, that is one seriously impressive record of achievement. 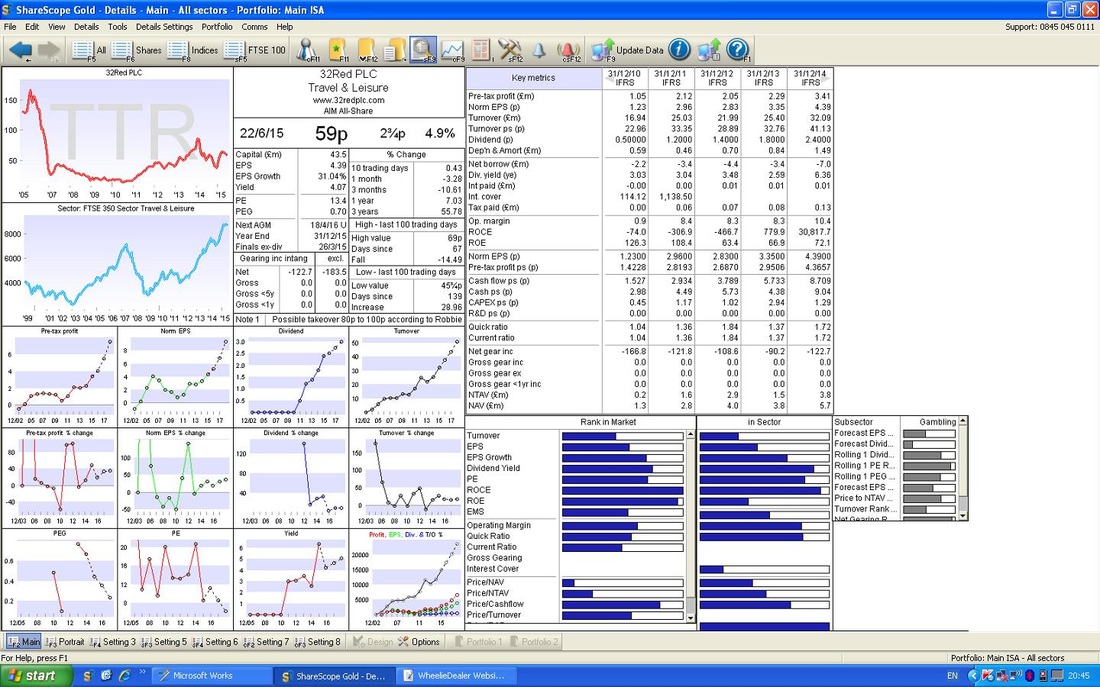
On the ScreenShot below, please look at the ‘Norm EPS (p)’ for 2016 of 6.90p. This is the Consensus Analyst Forecast for Next Year and on my Buy Price of 61p, this gives a Forward Price to Earnings (P/E) Ratio of 8.8.
Anything below 10 is usually seen as pretty decent Value, so 8.8 is very tasty. However, it is a bit prettier in reality. The Company has a Cash Pile of at least £7m ish - this was the figure at the end of December 2014 and since then in March they updated the market and said Trading was very Strong - so I suspect the Cash is higher now. Anyway, if we strip out the Cash of around 9p a Share, we get a Forward P/E Ratio for Next Year of 7.5 and it could well be lower than this as the Cash Pile is probably higher. If you look at the Dividend for Next Year 2015, it should be about 2.75p - this is a Dividend Yield of 4.5% on my Buy Price of 61p - and it seems quite safe with such a big Cash Pile. This Cash also means that they should be able to grow the Dividend over coming years at a steady rate which will be lovely. 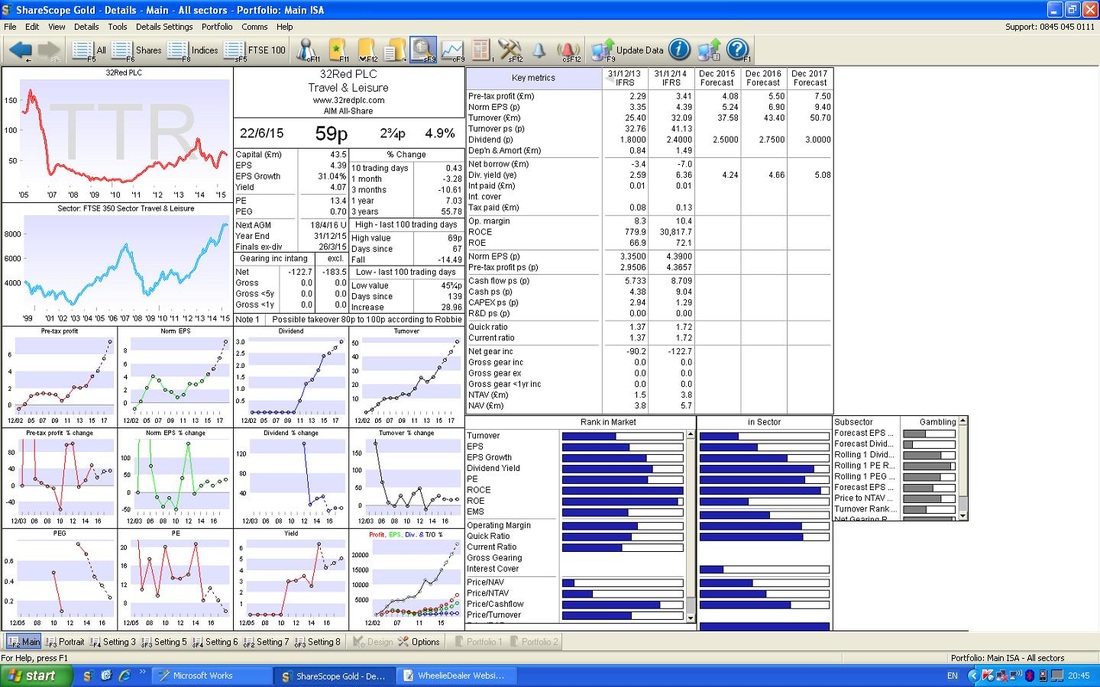
Target
It may take some time for the Market to really appreciate TTR, but if it can keep growing like it has in the past, it seems reasonable to think that a P/E Ratio of 12 for Next Year is fair. On this basis, I get a Target of 82p, which is 34% Upside on my buy Price of 61p. However, you could then add on the Cash Pile which is about 9p a Share, so that gives 93p as a Target, which is 52% Upside. If I get really ahead of myself, and give it a P/E of 15 (this would be perfectly reasonable as a low-ball Takeover Price) you would get a Target of 103p - 68% Upside. You could even be mad and add the 9p Cash on to get 112p as a Target. As you can see, there is plenty of potential Upside from realistic P/E Multiple Expansion and this is before we get any Broker Upgrades which must be possible - especially if TTR starts using the Cash Pile to do some nice Bolt-on Acquisitions. From a Chart Perspective, the obvious Target is around 90p which is the level we saw back in early 2014 - this will be a Strong Resistance Area and I may Topslice if we can get there. OK, things can go wrong, but this is the Risk we take on any Share we buy. Technical Picture Right, I know how Readers so love my Tealeaf gazing in the Charts !! First of all, the Long Term Picture - if you look below, you should see a near 10 Year chart and there are 2 main Lines to spot. The Black Arrow points to a Long Term Downtrend Line which will put a Cap on the Stock for a while I suspect. The Blue Arrow marks a Long Term Uptrend Line at the bottom, this should be very good Support and if the Price drops to this Line in future, it should recover, unless things are really ugly !! 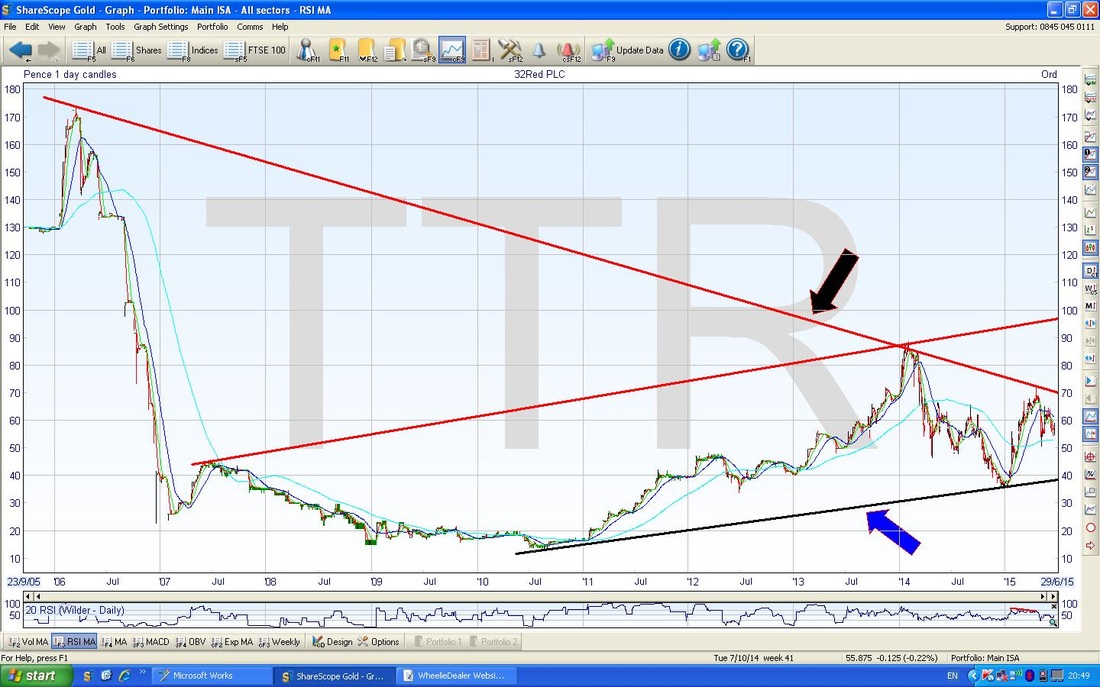
On the Chart below, I have zoomed in to about 1.5 years. Here you should still see the Long Term Red Line at the Top and the Long Term Black Line at the bottom.
I have then drawn in a sort of Uptrend Channel which seems to be forming since the start of 2015 - it is still early, so I have had to bend a few rules to get this Uptrend and it is not perfect by any means. Anyway, the Blue Arrow here denotes the Upper Resistance Line of the Uptrend Channel and the Green Arrow marks the Bottom Line of the Uptrend Channel. 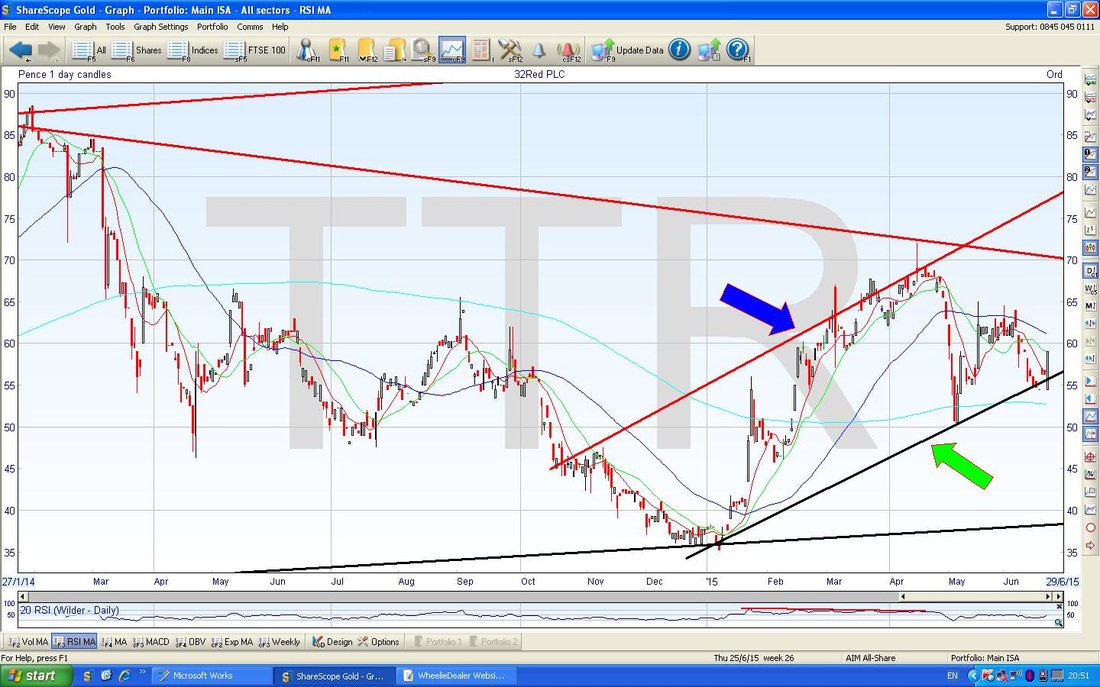
On the Chart below, I have zoomed in again to about 4 months or so (remember, with Charting you need to start with the Longer Term and then zoom steadily in once you have the bigger Context). This time, please look at the 2 lines I have marked with Blue Arrows and note how they sort of form a Triangle Shape. This is really critical as a Breakout of this Triangle to the Upside (where I have put the Green Arrow) would be extremely good news as it should run quite fast - probably up to about 70p.
Unfortunately, if it breaks out to the Downside, then it would be very bad. Really, I have bought in a bit early here. In a perfect trade, I would have waited for the Breakout to the Upside - I hope I will not get punished for my impatience but I think the Stock is very undervalued and I wanted to move fast before it gets caught up in any M&A activity. With Greece looking more resolved for a while, I wanted to get more Cash into the Markets. 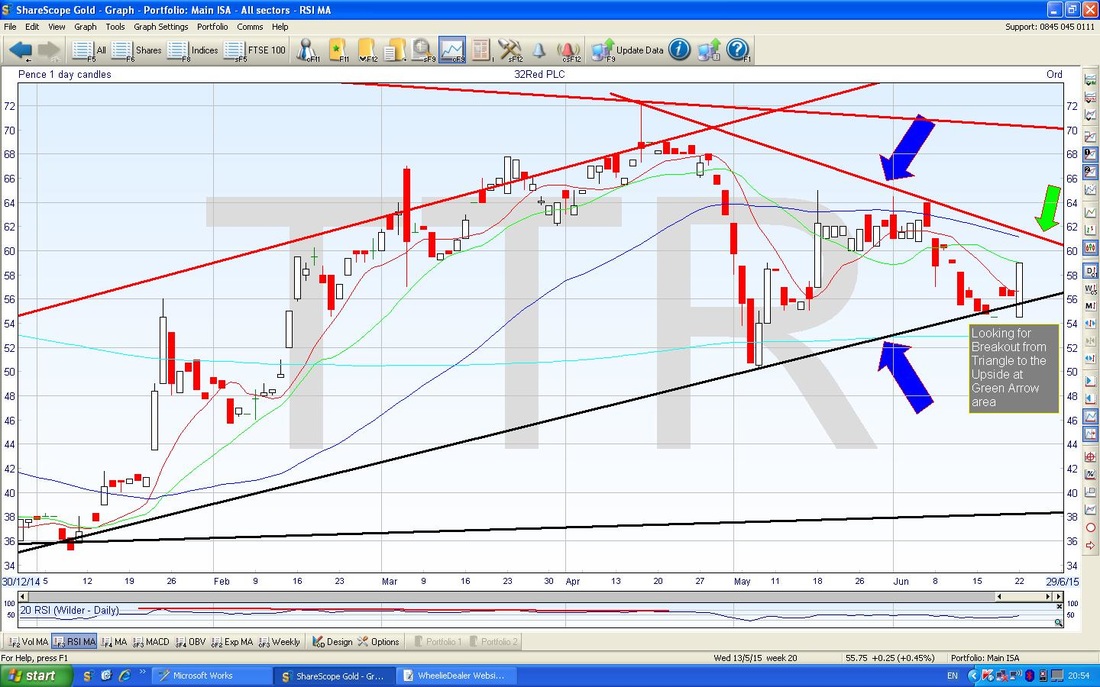
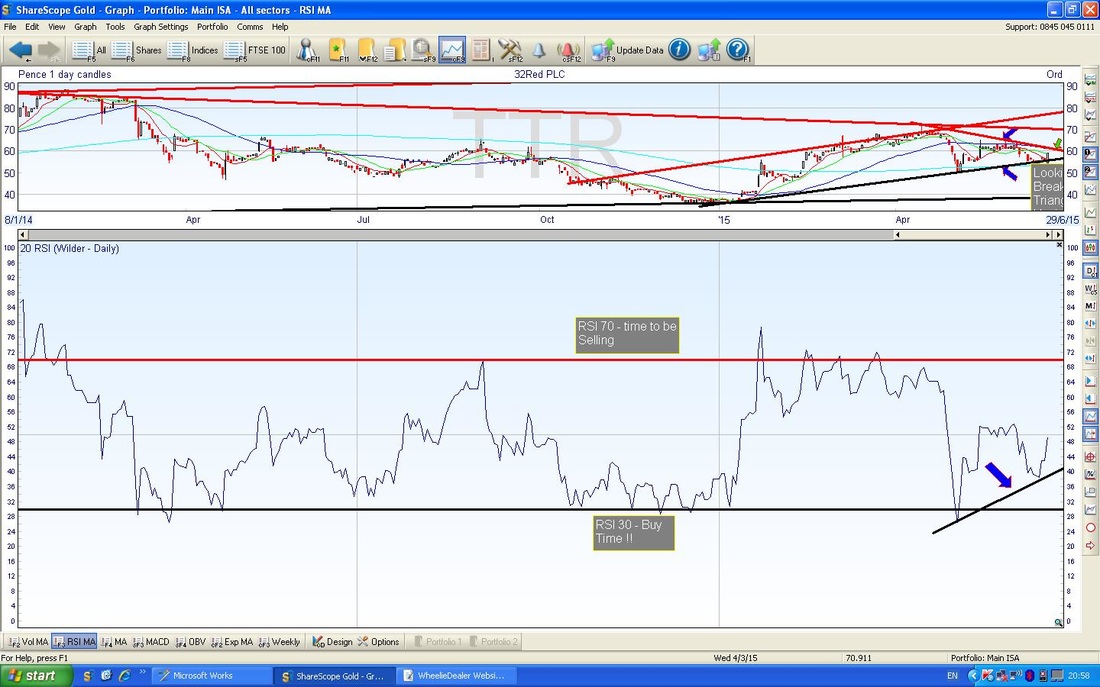
On the Screenshot below, the bottom Window shows the Relative Strength Index (RSI) - if you have read some of my TA Blogs before, you will know I love this Indicator. In this case, it has moved up from the lower RSI 30 Level (which is where you should Buy) and is now moving through the 50 Level - this is usually a good thing !!
On the Chart below, the Top Window shows the Bollinger Bands. In this case, note where I have marked a Black Arrow which shows how the Price at the Close of Trade yesterday (Monday 22nd June 2015) had moved away from the Bottom Bollinger Band - this is a good sign for Bulls.
The Bottom Window shows the MACD (Moving Average Convergence Divergence) Indicator - this is a superb tool. In this case, the Blue Arrow marks where the Signal and Indicator Lines are about to Cross and the Green Arrow shows how the ‘Histograms’ are about to go positive and Green - this is bullish. 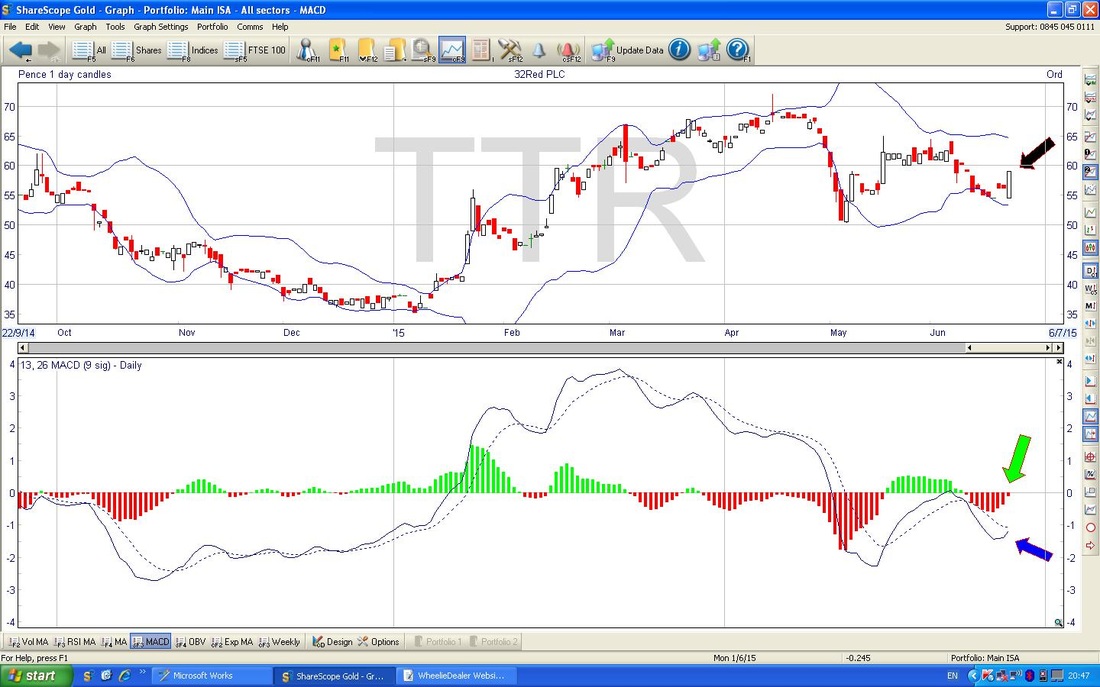
Last Chart below - this shows the Weekly Candlesticks. This is interesting because we have had 2 Down Weeks marked with the Blue Arrows, followed by the ‘Doji’ Last Week which is marked with the Black Arrow and this marks a Change of Trend - in other words, it should go up this week. The Green Arrow points to where it was up Yesterday (Monday) and although this is very early, it seems to be confirming that we will get an Up Week. Hope so.
That’s it, wd. 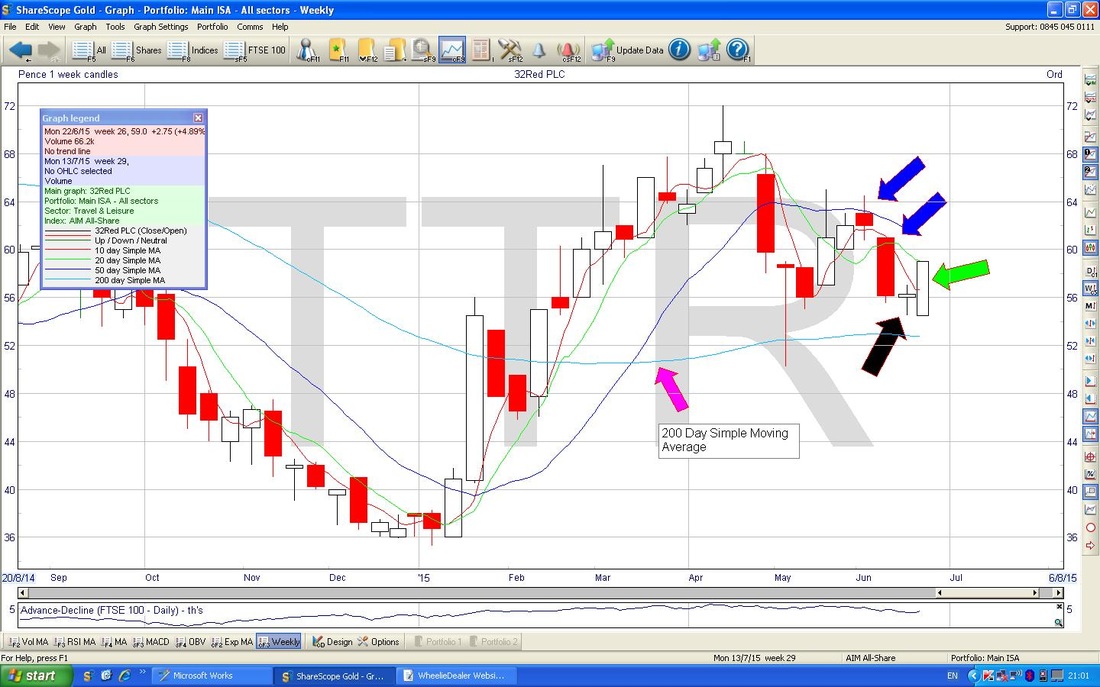
1 Comment
Dave
25/6/2015 01:33:10 pm
Interesting comments, id agree this is undervalued at the moment. Also worth mentioning the sponsorship deal with Rangers FC. This club has one of the largest fan bases in europe - good advertising potential! Leave a Reply. |
'Educational' WheelieBlogsWelcome to my Educational Blog Page - I have another 'Stocks & Markets' Blog Page which you can access via a Button on the top of the Homepage. Archives
May 2024
Categories
All
Please see the Full Range of Book Ideas in Wheelie's Bookshop.
|
