

|
educational blogs |
|
THIS IS NOT A TIP. I AM NOT A TIPSTER. PLEASE DO YOUR OWN RESEARCH. PLEASE READ THE DISCLAIMER ON THE HOME PAGE OF MY WEBSITES. IF YOU COPY MY TRADES, YOU WILL PROBABLY LOSE MONEY.
I hadn’t originally intended on doing a Blog for this Topup but a request from a Reader made me think it was worth bashing something out as this is a great example of how I add to Winners to ensure I maximise the opportunity within each Position I hold. Note I have already Topped Up on TTR once and I have now done so again - ‘Push the Position’ as Traders would say. The Key Concept here is that you must ‘Add to Winners and Starve the Losers‘……..
I am pretty bullish on the Market at the moment as we lead into November and December which are seasonally the strongest time of the Year - so I want to be as ‘Long’ of Stocks as I can be and I am keen to ‘Weight up’ on anything that I am a tad light on or which is showing clear Bullish Price Action. In line with this, I closed a Short I had on the FTSE100 last week as I want to maximise my possible Gains over Winter as we close out 2015. ‘Long and Strong.’
On the flipside, if things don’t go my way, then I can quickly and easily bang some Shorts on again to Hedge out any Downside Risk. TTR falls into the category of showing very Bullish Price Action although I think it is still very Cheap in terms of its Value and Historic Track Record of achievement. It is rare to find something that is so Undervalued have such a Bullish Looking Technical situation. I did a Blog on TTR a while back which you can read here - the Numbers may have changed a little but I have included a ShareScope List Screen image later in this document: http://wheeliedealer.weebly.com/blog/32red-ttr-topup-buy-rationale There was a Strong set of Interim Results on 24th September 2015 which you can read here: http://www.32redplc.com/investors/news.aspx Valuation If you look at the ShareScope Screenshot below with the ‘Details’ screen and look in the Top Right Hand Corner, you should see ‘Norm EPS (p)’ for ‘Dec 2016 Forecast’ of 10.50p. Just on the pure Numbers, at my Buy Price of 96p (via a Spreadbet) the Forward P/E is 9.1 (96p divided by 10.50p) but if you strip the Cash out, then the Forward P/E is about 8.5. You should be able to see that the Dividend for Next Year should be over 3% and the Cash Pile gives me confidence that this is pretty likely to be paid. 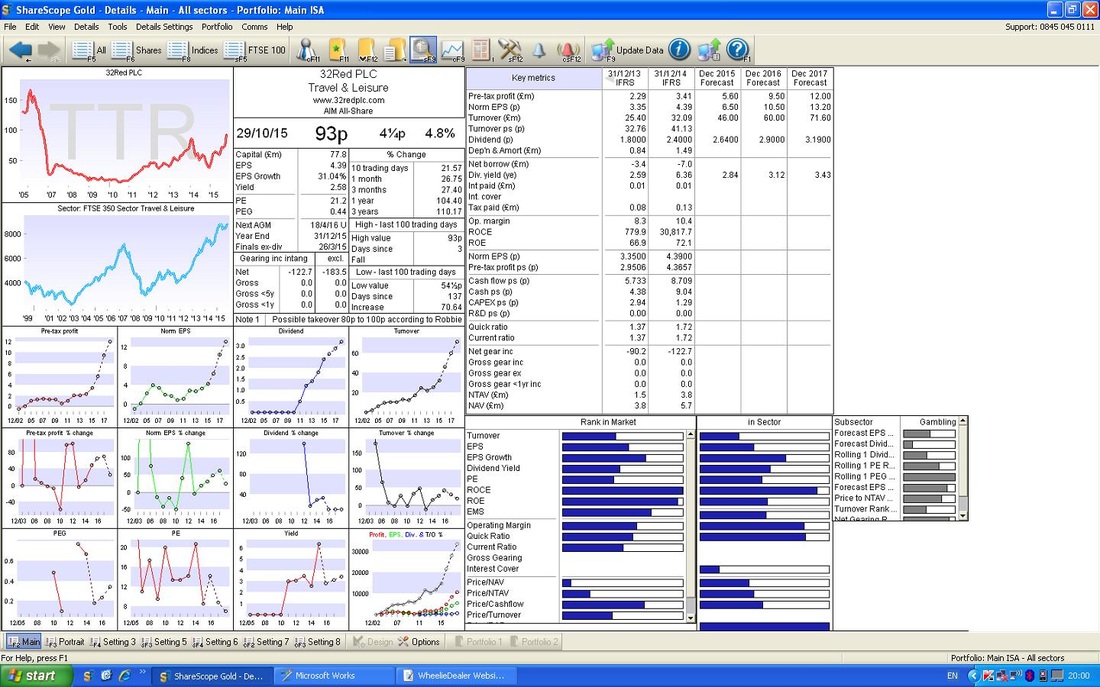
Technicals
As per normal, the Charts and stuff from ShareScope are just as they confronted me on the Night of Thursday 29th October when I made my Decision to Buy on Friday Morning - just before I headed out to the PUB (my favourite Epic Code). Below is the Long Term Chart - remember, with Technical Analysis (TA) stuff it is always best to start with the Long View and then to slowly zoom in to shorter timescales - this is because the Longer Term Trends will dominate. This Chart takes us back to 2006 - who needs a Time Machine? The main thing to note here is the Red Line (marked with a Red Arrow) which is nearly at 90p and has been ‘Broken Out’ of as marked with the Blue Arrow. This is really the essence of my Buy Decision (from a Technicals viewpoint this is extremely bullish behaviour - but as I mentioned above, the company has a superb Track Record and is Cheap.) Note, the 90p ish level is not a Breakout to a new All Time High (ATH) - this is usually seen as a very bullish development - in essence because there are no ‘Reference Points’ above that will act as Resistance and give people a reason to Sell. The Green Line (marked with the obligatory Green Arrow) marks the ATH and is at about 175p - I would obviously be very chuffed if the Price gets up around here but I suspect that will be a long shot. However, if it does get up there, it will be massive Resistance. 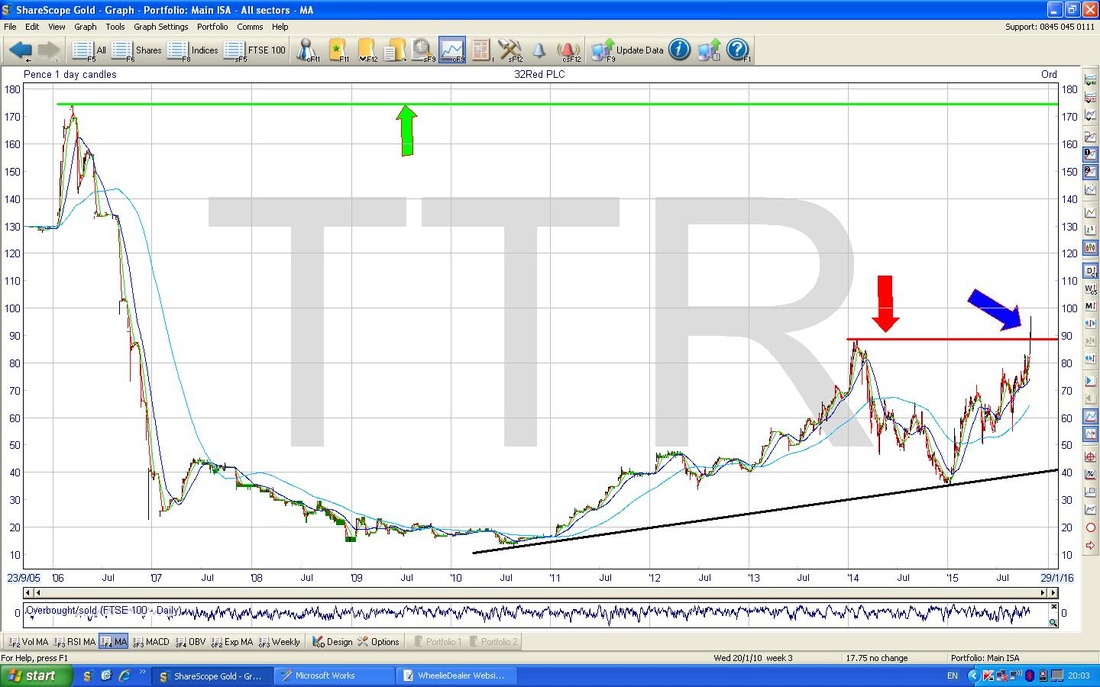
On the Chart below I have zoomed in to about a 1 year view. The Black and Red lines from the Previous Chart still show but I have also put in a New Uptrend Channel marked with the Yellow Line at the bottom (Yellow Arrow - you get the picture) and a Blue Line at the Top (guess what colour the Arrow is for that one?).
Something to note here is that we sort of have a ‘Double Breakout’ which must be extra juicy. Firstly we have broken the Red Line from the previous Chart which is the Horizontal Level that needed to be cracked but we have also broken out above the Upper Line of the Uptrend Channel at the same time. 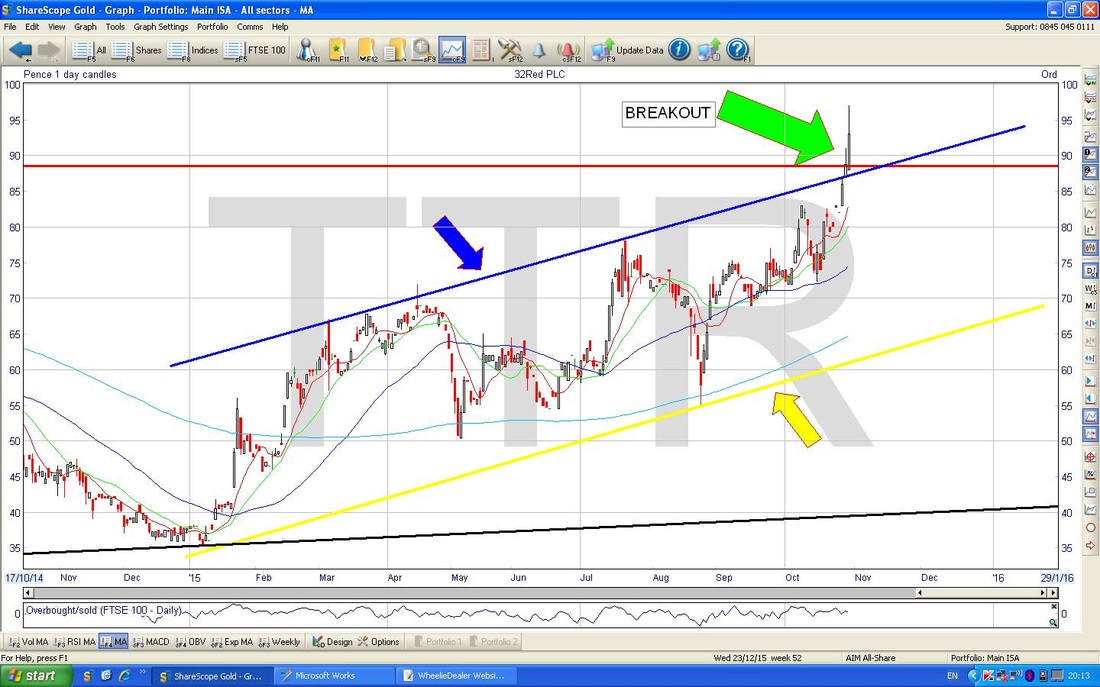
On the Chart below I have zoomed in a little more because I want to highlight something that is worth noting. I have left the Arrows and stuff the same as the last Chart but I have marked the Candlestick that was generated on Thursday with a Black Circle. The thing I want to point out is that this Candle has a Long ‘Wick’ going upwards - i.e. the Price was unable to hold the Intraday Highs on Thursday so it was possibly telling us that it would fall back on Friday.
Anyway, this caused a bit of a dilemma for me because the temptation was to wait and see if it dropped - but the Breakout is so clear cut that I didn’t want to miss out on potentially a lot of quick upside. I looked at Candles from previous days and I noticed that on both the 2 prior days we got the same thing where it was unable to hold the Intraday Highs - so I decided that this might be a function of Low Liquidity and that with the Stock so undervalued I should just ‘buy the Breakout’. Of course, with hindsight we all know what happened and the Price fell back on Friday - but that is not really all that useful to know. I will point out here that @stealthsurf seems to say we should buy Breakouts like this - it might retrace a little in the very Short Term but this is Strong Looking Price behaviour. He also makes the point that these kind of Buys are a very low Risk Entry. 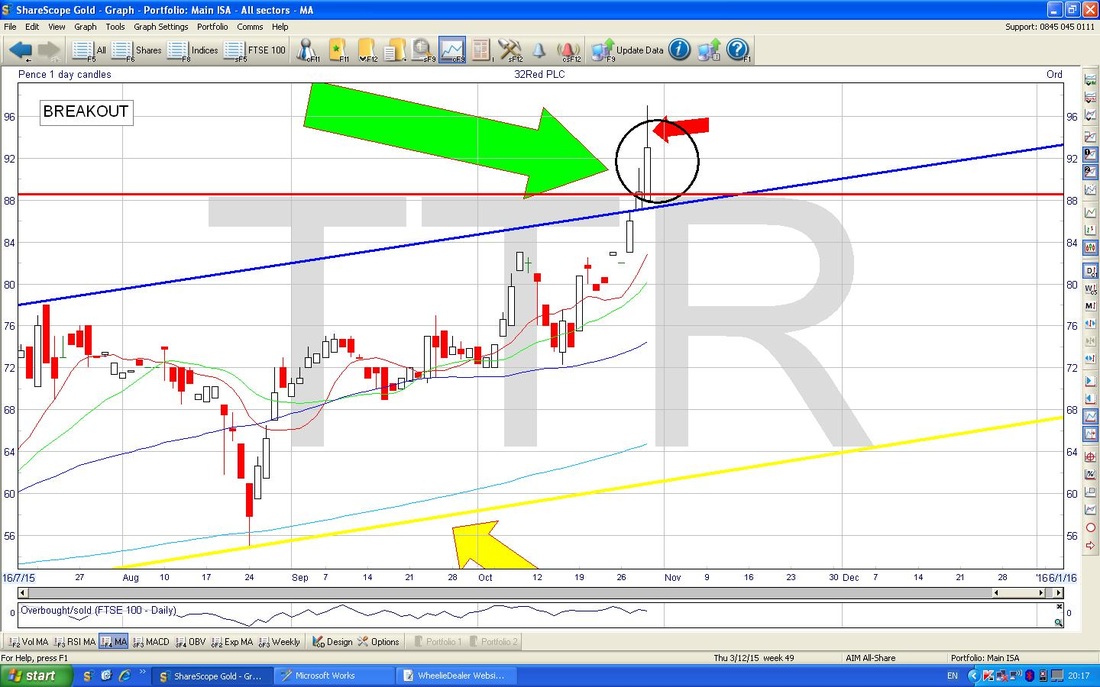
On the Chart below, please look at the Lower Window which shows the Relative Strength Index (RSI). Note it is up around the 70 level which suggests Overbought and could have made me hold fire on the Topup Buy. If you look back to the left, the RSI usually turns down at 70 or just over so it might be that the Upside in the very Short Term is limited. However, I took the view that the Breakouts covered above will trump the Overbought RSI readings.
Again, our mate @stealthsurf says that an Overbought RSI like this should not really concern me too much - the best Breakouts will remain Overbought for quite a time and it is a sign of underlying Strong Bullish Pressure. 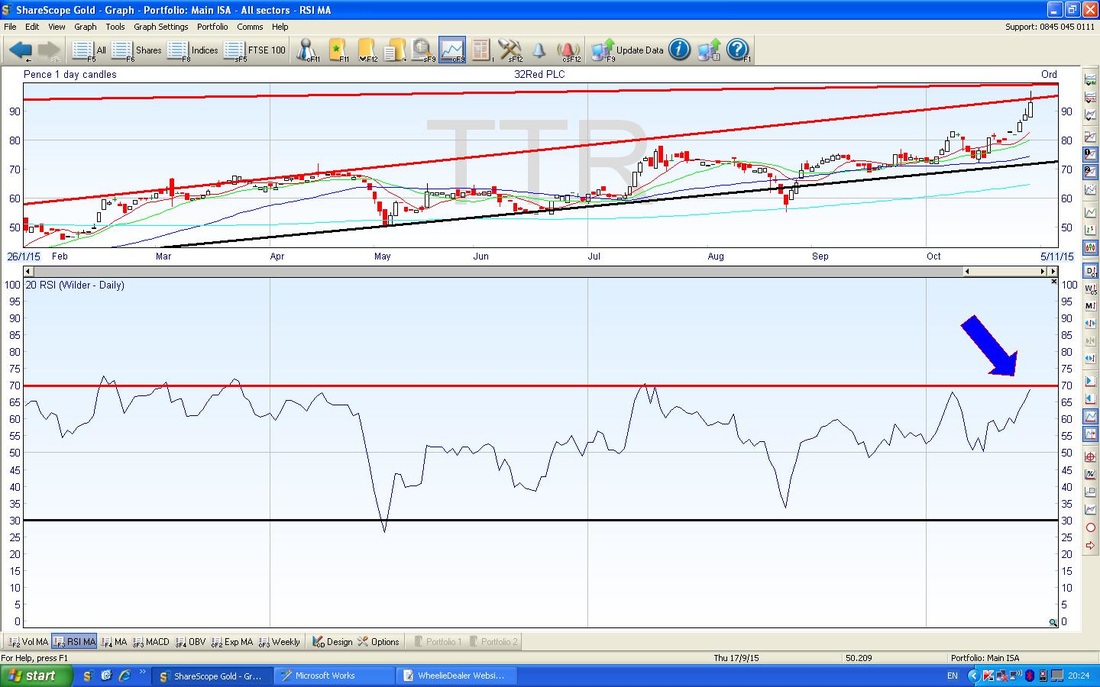
Ok, that’s pretty much it. TTR for me is a Very Cheap Stock (Ex Cash forward P/E around 8.5) with a Forward Divvy Yield of a shade over 3% and a decent Cash Stack to give a Margin of Safety. The Technical Picture is outstanding and I now have quite a big chunk having bought lots around the 65p ish level. This is clearly a Stock with Momentum - The Big Mo !!
I haven’t mentioned anything about Risks here because they are covered well in my previous Blog - the good news is that the Point of Consumption (POC) Tax seems to be less of an issue than the Markets feared. Something you may notice in the News is that TTR did an Acquisition recently (Roxy) and it is likely this could mean upside to the Forecasts. Oh, in terms of Targets I am really thinking that this could be certainly 140p to 150p and perhaps higher in time. It really looks a beauty and the Breakout is great news although of course it might ease back a little bit - but this will probably be a time for People to get buying. It will be interesting to see if it can test that 175p level in maybe a couple of Years………. Sweet Dreams, WD
4 Comments
WheelieDealer
11/11/2015 11:32:39 pm
Hi Bill, thanks for your comments and your appreciation of my scribbling. I know what you mean about the POC tax and it was a tough choice to stick with it but it just seemed so cheap back then. I have been learning a lot lately that it is best to use Momentum and stick with Stocks as long as I can. Certainly paying off with TTR at the moment and I think here is a lot more to come. cheers, WD
Ron Barnes
29/11/2015 07:18:59 pm
Just found your webpages after following a link from ADVFN web chat about TTR shares. I have worked in the gaming industry for 25 years. I decided to buy share just over a year ago in Betfair and since then TTR. I am currently 131% and 56% up respectively on the price i bought at. I intend to buy more of both, would you agree? ps love reading your site without understanding everything as i am a complete amateur investor.
WheelieDealer
29/11/2015 10:40:05 pm
Hi Ron, thanks for your comments - I am well pleased you like the Website - don't worry about not understanding some of it - I don't either and I write the stuff !! Leave a Reply. |
'Educational' WheelieBlogsWelcome to my Educational Blog Page - I have another 'Stocks & Markets' Blog Page which you can access via a Button on the top of the Homepage. Archives
May 2024
Categories
All
Please see the Full Range of Book Ideas in Wheelie's Bookshop.
|
