

|
educational blogs |
|
THIS IS NOT A TIP OR RECOMMENDATION. I AM NOT A TIPSTER. PLEASE DO YOUR OWN RESEARCH. PLEASE READ THE DISCLAIMER ON THE HOME PAGE OF MY WEBSITES. IF YOU COPY MY TRADES, YOU WILL PROBABLY LOSE MONEY.
Well, after a couple of really shocking Weeks, I am beginning to wonder where Santa has got to with his infamous Rally. I screwed up a treat by buying a FTSE100 Long Spreadbet back at 6389 and I have been nursing this whilst the Markets have been selling off big time. This is the catch in not using Stoplosses much - when trades go against you, it can hurt quite a lot. Luckily I made one good decision regarding that Trade and limited the size compared to what I was considering - had I done the larger size it might have got quite hairy !!
I will go through some Charts in this Blog but my current thoughts are that the Selling has been pretty relentless and we are getting near the point where the Markets will rally - the Charts I include should demonstrate this - and I firmly believe in ignoring all the ‘Noise’ from the ‘Experts’ and relying more on what I ‘See’ rather than what they tell me to ‘Think’.
I am totally unplugging my Brain and just using my Eyes to tell me what is actually happening and likely to happen next. More and more I learn that cutting out the Noise is the way to really do ok in the Markets - no doubt this is a subject I will be revisiting time and again in future Blogs. I am mulling over the idea of doing another Long Spreadbet on the FTSE100 soon - perhaps in the next couple of days. I don’t think we can write Santa off and it is still most likely we will get a visit later in December - my Charts should show more on this. However, if I do put another Long Spreadbet on, I will use a Stoploss because I don’t want to be carrying loads of extra Long Exposure into 2016. Ouch !! I am currently suffering horribly from really nasty toothache - I was supposed to meet up with a Twitter buddy tonight but sadly I have had to cancel as I am in a right mess (Sorry !!!). I have been munching Paracetamol and had to have some Real Ale to help take the edge off !! It is so distracting it is untrue - I tried reading Investors Chronicle earlier and it was so hard trying to stay focused - but it is so painful that I am hoping the distraction of typing this blog will take my mind off the agony !! This grief has made me think about the importance of being Happy and Healthy when Trading / Investing - I am really worried that early next week I will be so distracted by the pain that I will make some stupid errors and daft decisions. Luckily with my very Lazy approach to the Markets, I should be able to not do anything much at all and the Pain won’t impact my Decisions too much. I hope I can get a Dental Appointment ASAP but I am worried that I will have to suffer this for some time - the problem I also had last night was inability to Sleep - this is definitely not a good thing for careful, rationale, considered, Investment Decisions. Some quick thoughts on 2016 I was reading some stuff in Investors Chronicle about Macro Economic stuff and I tweeted out some thoughts that struck me as I pondered what was going on. In summary, the following things were apparent to me, but are obviously a bit of Future-Gazing and probably way off the mark:
What happened to the FTSE100 last year (2014)? As usual, all of the Charts are from the wonderful ShareScope software that I use and hopefully I have kept them simple and my explanations will sort of make sense. On the Chart below, the Blue Arrow points to where December started in 2014. We then had a few ‘sideways’ sort of days and then it all went horribly wrong and the FTSE100 fell for about 6 days (the Red Candles) which ceased where my Black Arrow is on Monday 15th December 2014. We then had a Rally with lots of nice White Candles up to my Green Arrow on Monday 29th December 2014. Therefore, if we follow this pattern for 2015, then the coming Monday 14th would be ropey and we would rally on Tuesday - it seems too good to be true (and probably won’t be !!) but I think a similar pattern is very likely - especially as we have the US Fed Rate Decision on Wednesday and I suspect that we will get a ‘Relief Rally’ if they do raise Rates as the Market is expecting. That Rally could easily kick off on Tuesday. In essence, I cannot see the Fed not taking this opportunity to start raising - they have signalled this for ages and to not raise now would destroy credibility and get the Markets very worried about the state of the US Economy - the logic being that if the Fed does not raise Rates when they have the chance, then things in the underlying Economy must be really, really bad. I am of the view that Markets would dislike a Recession more than they dislike very slow Interest Rate increases. 
FTSE100
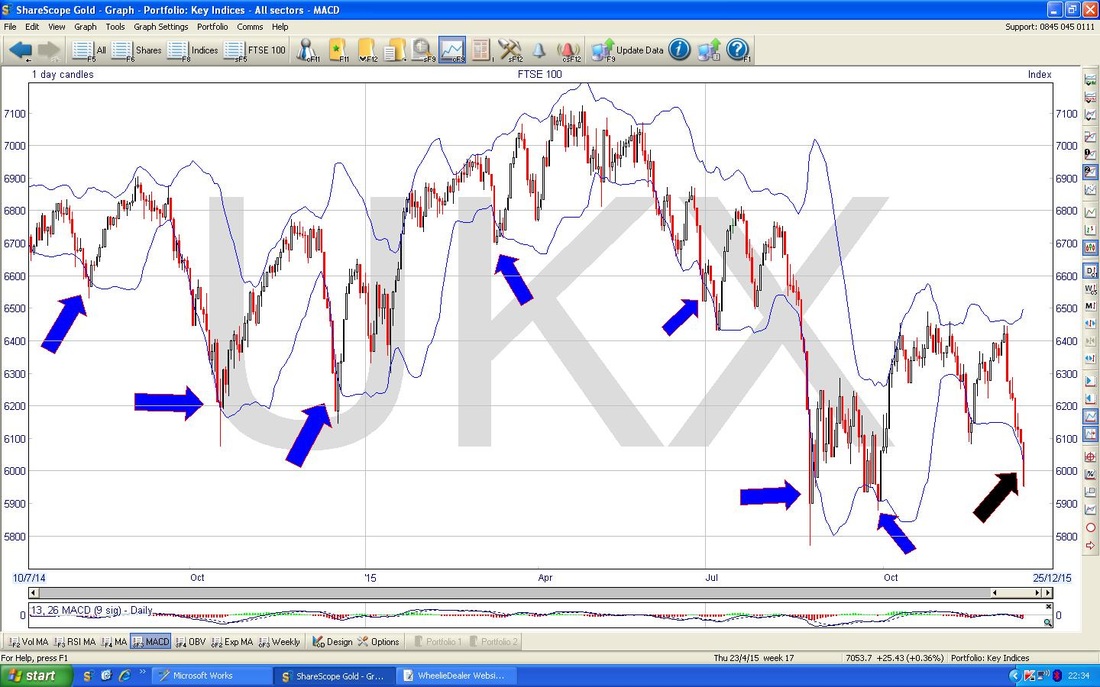
My Chart below shows the FTSE100 Daily Candles for roughly the last 6 months. My Black Arrow points to where we had a failure of the attempt by the Market to build an Uptrend Channel which I have marked with the Blue Parallel Lines. The Breakdown through the lower Blue Channel Line is a very negative development and really destroys any hope of us seeing the FTSE100 back up at 7000 for a long, long time. My Blue Arrow marks out the Candle from Black China Monday August 24th 2015 - this was such a horrible day but it sets a very clear marker of support at the 5768 Intraday Low which I have marked on the Chart with the Green Horizontal Line. If this line breaks to the downside I think things have suddenly got ultra-serious and I think a Bear Market will be on the cards - that will call for a total change of Strategy and reduced Long Exposure and Shorting will be the order of the day. God, I hope we don’t see that - and to be honest I think it is very unlikely. 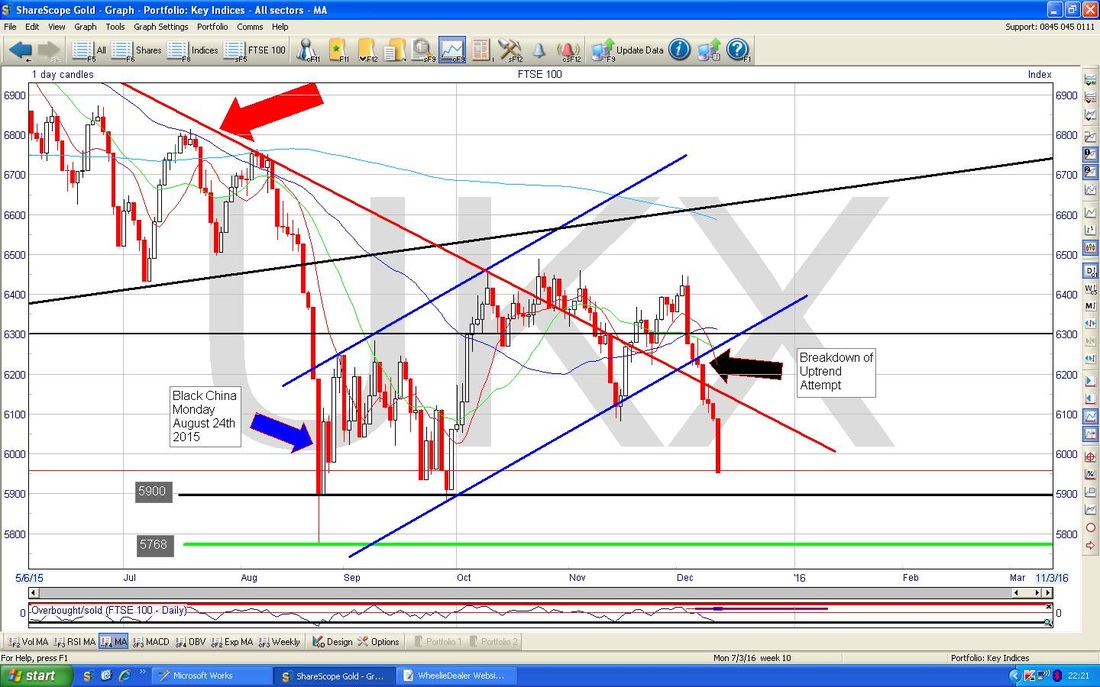
On the similar Chart below, I have put a sort of Purple (or Mauve or Pink or whatever it is) Arrow which points to where I think the FTSE100 could drop to in the early part of next week (probably on Monday 14th December) - this is at about 5900.
My Black Arrows mark a possible Range that I think could ensue going forwards for many months - this would be between about 5900 and 6450. Another possibility is a tighter Range between maybe 5900 and 6300. Neither outcome will be much fun but at least we might be able to trade these Ranges with FTSE100 Spreadbets etc. I think the chances of getting over 6450 or 6500 are pretty damned remote - although of course it is an outside possibility for 2016 - just don’t bet much on it !! 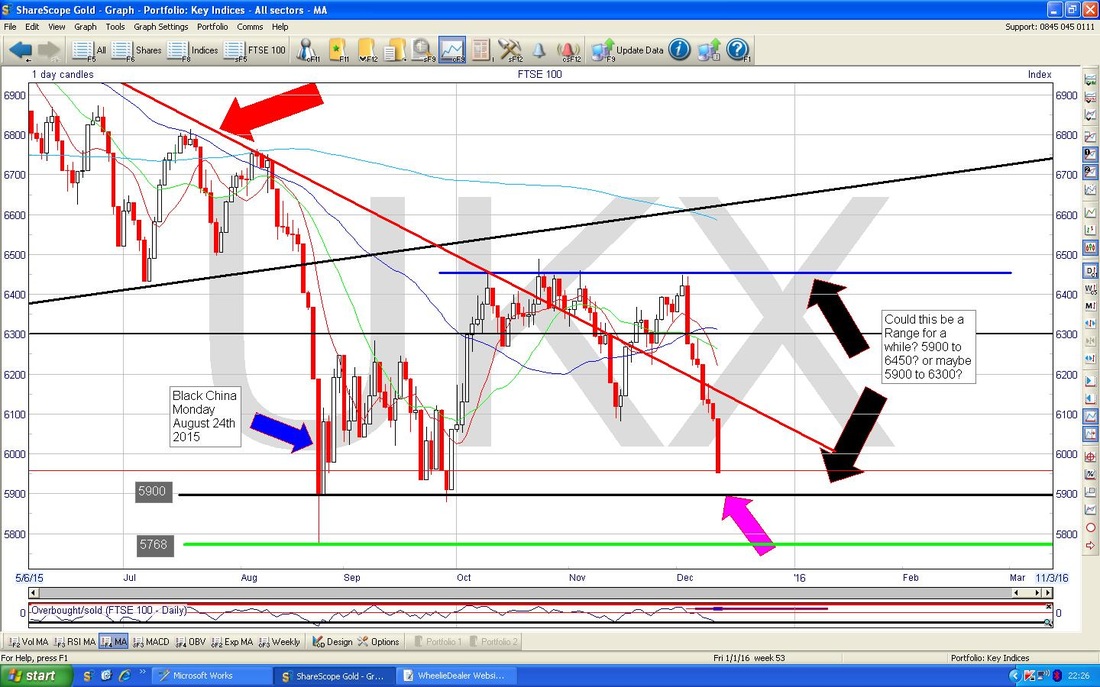
Please check out the Bottom Window on the Chart below - this shows the ‘Overbought/Oversold’ Indicator for the FTSE100 which I think is some sort of ‘Oscillator’ thing. I have no idea how this is constructed (and quite honestly I couldn’t give a sh*t) but I do find it is an excellent Very Short Term Indicator for what is most likely going to happen next.
My Blue Arrow marks where we are from Friday 11th December 2015 and the Red Arrow shows where it went to on Black China Monday (August 24th 2015) - as you can see, we might not fall much further before things turn up (time for cheers and clapping now). 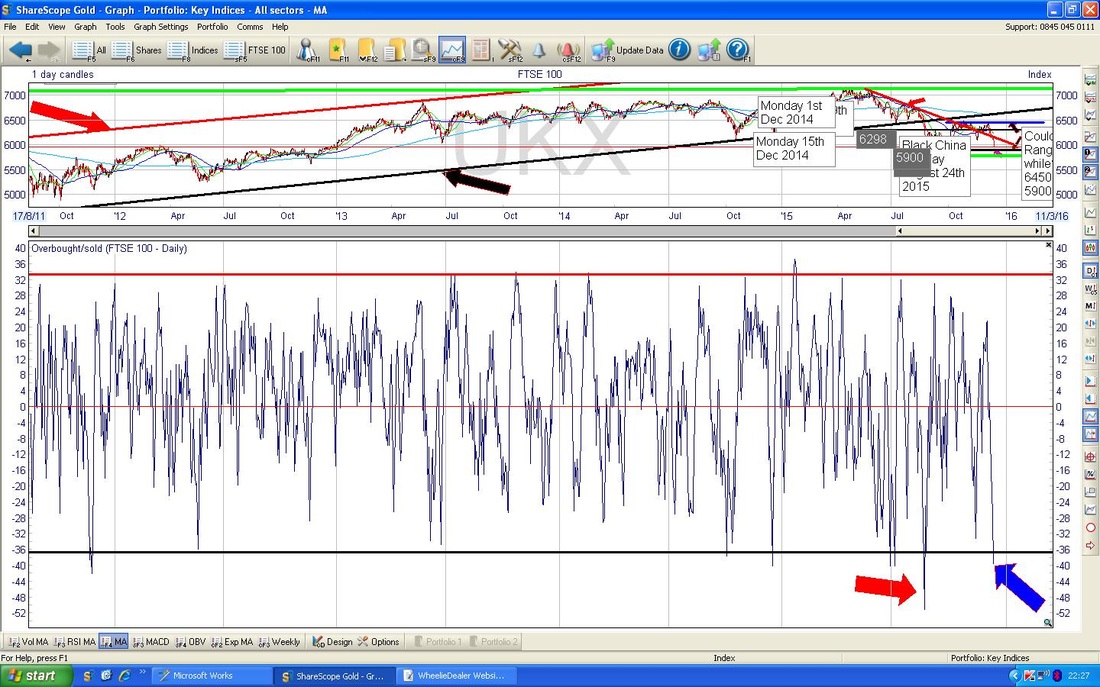
On the Screen below, please look at the Bottom Window. This is the Relative Strength Indicator (RSI) and it works in a similar way to the one we just looked at above, but it is a ‘slower’ Indicator. However, in many ways this is my favourite and I find it very, very reliable and it works lovely across pretty much any Asset.
My Blue Arrow points to the current reading with is RSI 34. This is pretty low as ‘Oversold’ is generally taken to be a reading of RSI 30 (the Black Horizontal Line marks this 30 level). However, my Red Arrow marks Black China Monday where the RSI dropped to a reading of 20 - however, it must be remembered this was a very exceptional (and kin scary) day. Of course, we could get a repeat (or even worse heaven forbid) of Black China Monday in coming days………….(ah, not much clapping or cheering there I see). I note that last year, December 2014, the low point on Monday 15th had a reading of RSI 30. My view is that we won’t see much more downside and that so many people are hoping and expecting the Santa Rally what once we see some decent upside movement, People will pile in fast because they don’t want to not be aboard the Sleigh. 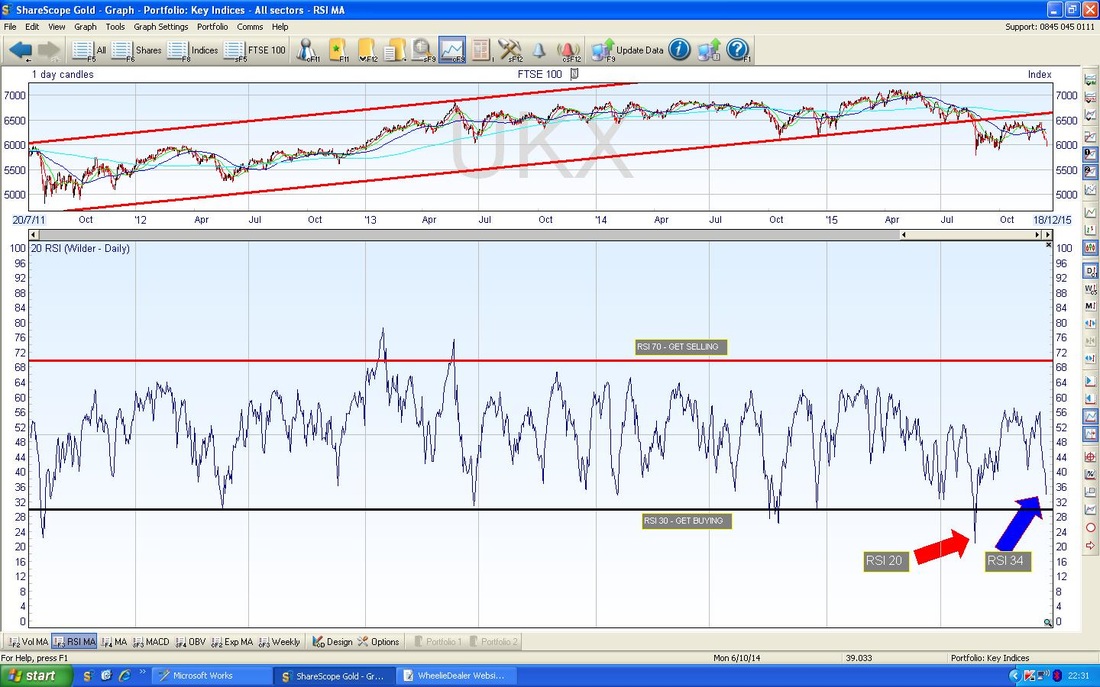
The Chart below is interesting. This shows the Bollinger Bands for the FTSE100 going back just over a year. My Black Arrow shows where the Daily Candle produced on Friday 11th December 2015 went ‘outside’ the lower Bollinger Band. Now look at the Blue Arrows - these are all instances where the Candles went ‘outside’ the Bands - you can see what happened next in those examples.
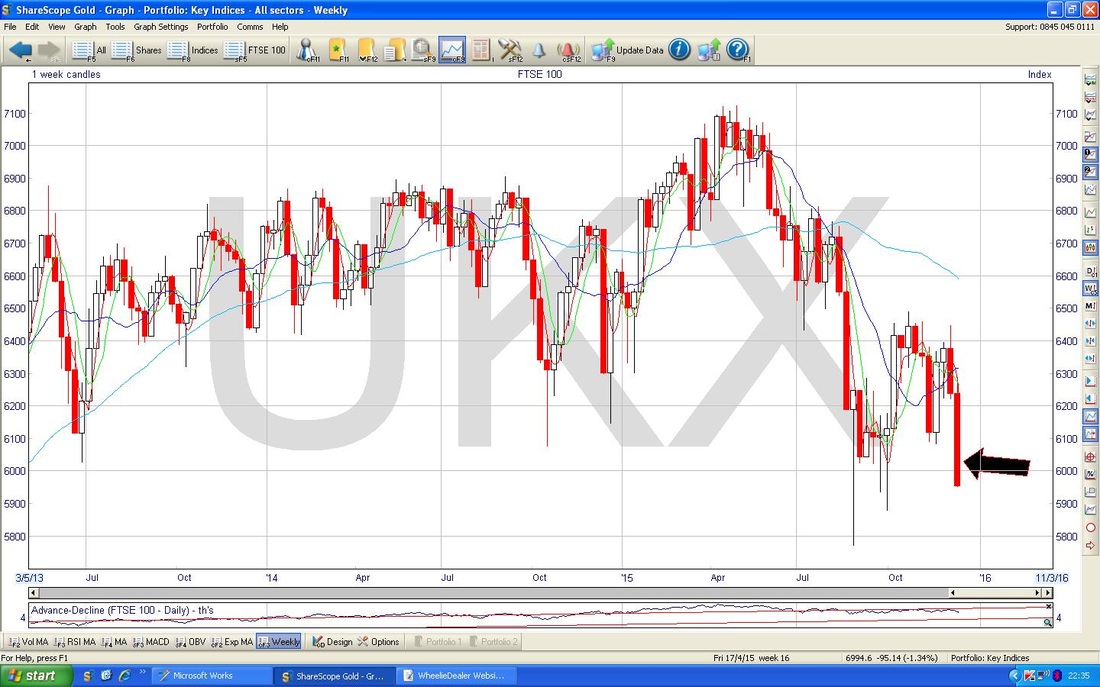
The Chart below shows the Weekly Candles for the FTSE100 - this is not pretty, my Black Arrow marks a big Down Red Candle - we need a Reversal Candle Pattern now or we are in trouble. Next Week will tell us a lot about where things will be going just before Xmas. I suspect we will get a Hammer Candle produced next week but if we actually Rally on Monday and keep going, then we would get a Bullish Harami 2 day Candle Pattern (the Lady with Child viewed sideways on thing).
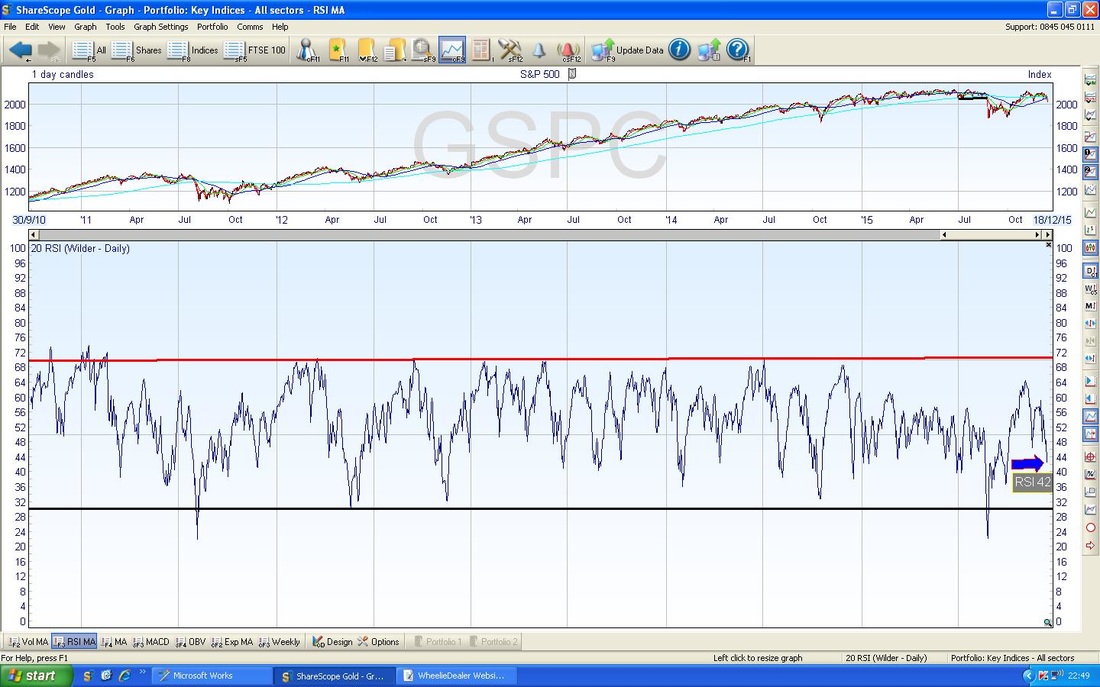
S&P500
Right, on the Chart below there are a few things going on. The Blue Arrow marks a Blue Line which is nasty and sloping down - this shows that in the Recent moves up, the Market was unable to make a new ‘Higher High’ - this is really not a good sign. If we Rally soon but cannot get above that Blue Line, then it will really start to look like a Bigger and More Serious Downtrend is setting in. My Black Arrow points to where I guess the S&P500 will drop to early this coming week - this is probably around 2000 or a bit below - maybe 1950. My Green Arrow is pointing to where the Darker Blue Wiggly Line of the 50 Day Moving Average is moving up from under the Lighter Blue Wiggly Line of the 200 Day Moving Average and it looks like we might get a Golden Cross soon - this would be a good thing but we need a Rally ASAP to enable it to happen. 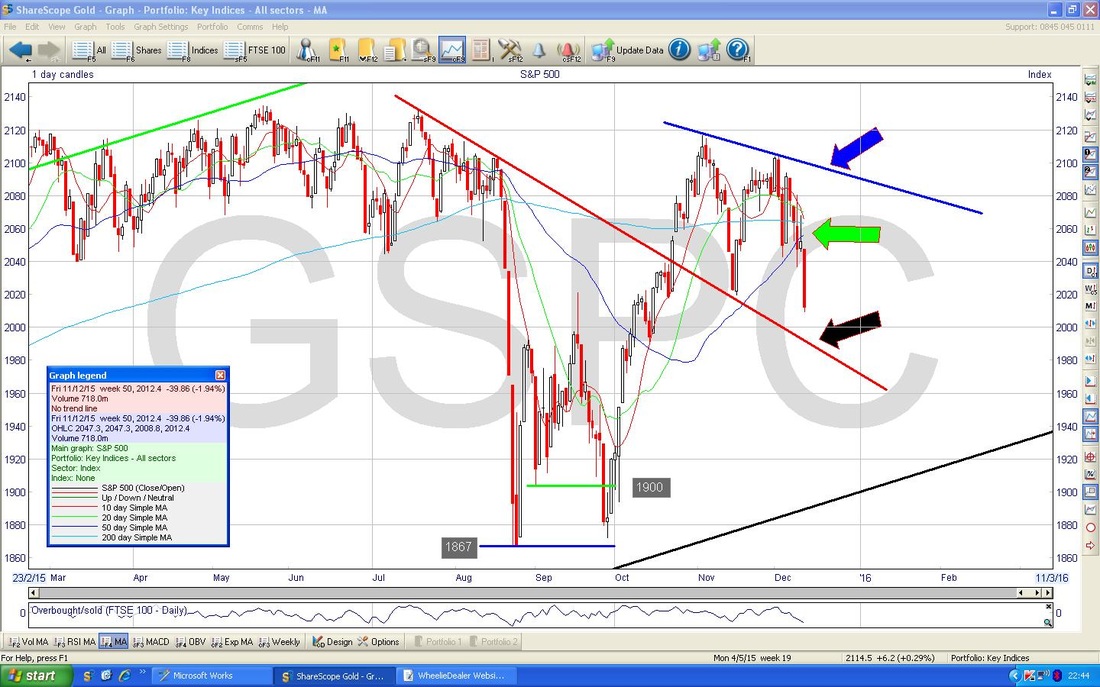
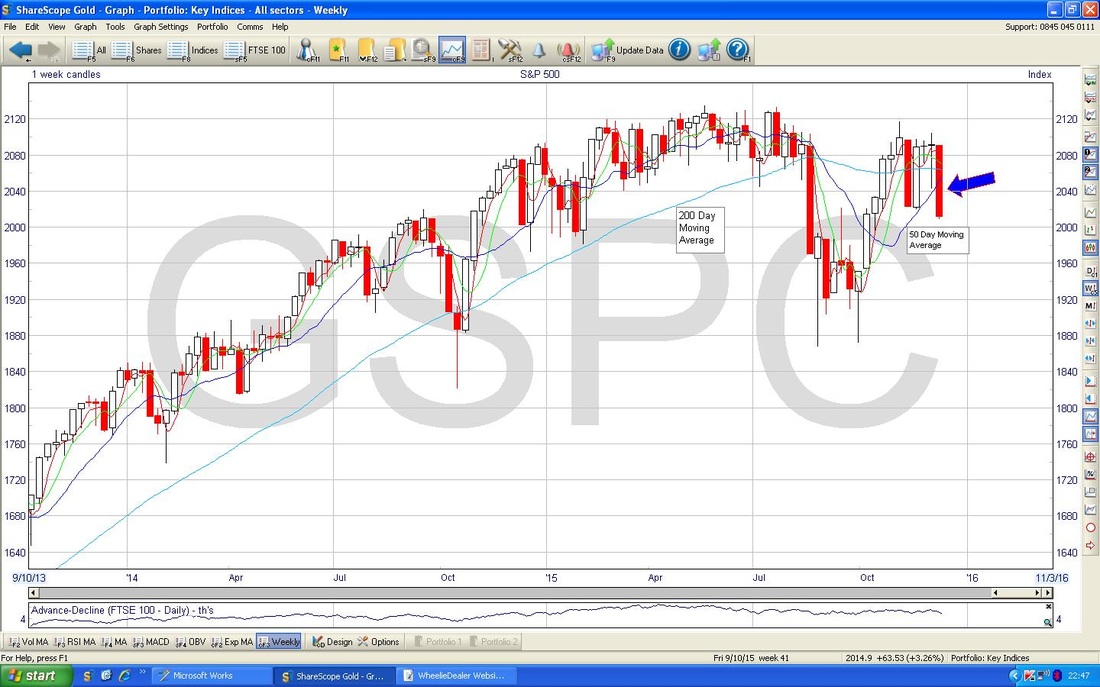
My Blue Arrow on the Chart below shows the Weekly Candle we generated last week on the S&P500 - it is not pretty and suggests more falls and like with the FTSE100 Weekly, we need a Reversal Candle Pattern (Hammer, Harami, Long Tail Doji, etc.) very soon or we are in the poo.
The Screen below in the Bottom Window shows the RSI on the S&P500. The current reading is RSI 42 which means it can fall a lot to get to RSI 30 which is the usual ‘Oversold’ level. However, the S&P500 often turns up from levels like RSI 40 or just below like RSI 36, so it is possible it can rally soon.
Brent Oil
The Chart below goes back about 6 years - the key thing here is the $35 level which I have marked with a Black Arrow and Black Horizontal Line. Currently we are at about $38 and $35 should act as Strong Support and perhaps we can bounce a bit if it touches $35. Failure of $35 would be very, very bad for Oil Bulls. 
In the bottom Window below, my Blue Arrow shows the RSI on Brent Oil at about RSI 28. This is very low and it wouldn’t need much more downside before it rallies. My Red Arrow marks the low point which is about RSI 16 from back in early 2015.
Exciting times I am sure you will agree - hope everyone is ok and surviving the Selloff - good luck for next week, WD. Now where are those Paracetamol? 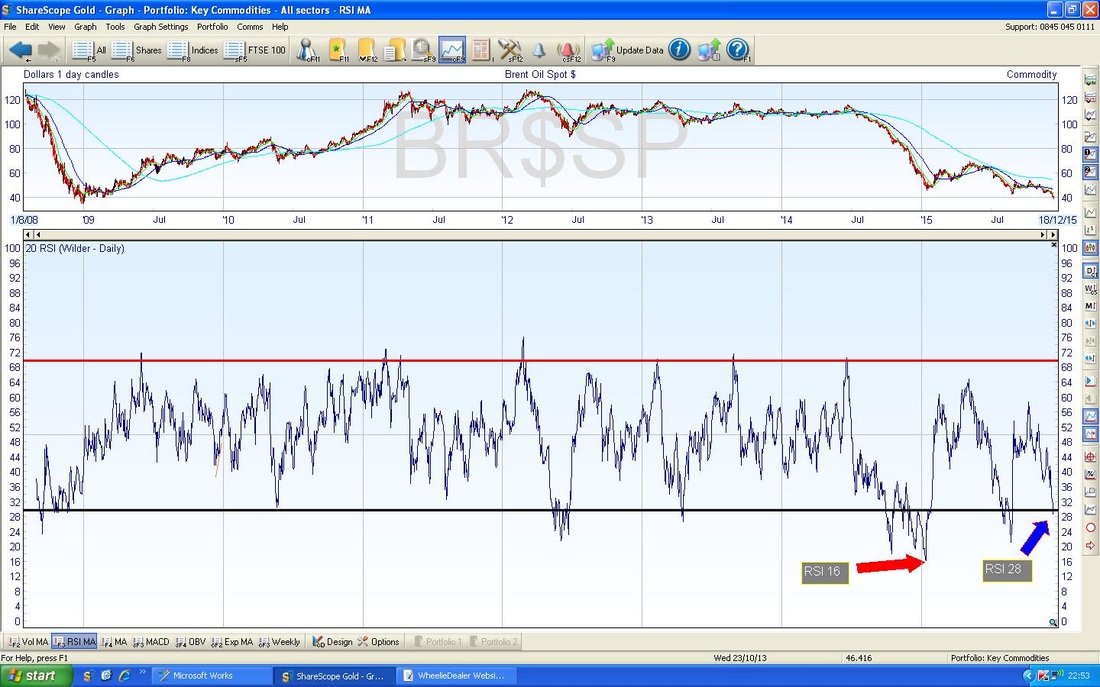
5 Comments
apad
13/12/2015 10:27:13 am
I wonder if you might comment on this observation.
catflap
13/12/2015 03:03:37 pm
HLMA ?
WheelieDealer
14/12/2015 09:58:37 pm
Hi apad - that's a really interesting post - not often I get someone putting Sociology Maxims under my Blogs !!
catflap
13/12/2015 03:02:58 pm
Thanks for your sharing your thoughts and experience with us.
WheelieDealer
14/12/2015 09:45:16 pm
Hi catflap - no worries, great that it helps you and you clearly appreciate it. I find that writing it down in this way really cements it in my brain in a much more disciplined way and means I can't skimp on anything !! Leave a Reply. |
'Educational' WheelieBlogsWelcome to my Educational Blog Page - I have another 'Stocks & Markets' Blog Page which you can access via a Button on the top of the Homepage. Archives
January 2021
Categories
All
Please see the Full Range of Book Ideas in Wheelie's Bookshop.
|
