

|
educational blogs |
|
THIS IS NOT A TIP OR RECOMMENDATION. I AM NOT A TIPSTER. PLEASE DO YOUR OWN RESEARCH. PLEASE READ THE DISCLAIMER ON THE HOME PAGE OF MY WEBSITES. IF YOU COPY MY TRADES, YOU WILL PROBABLY LOSE MONEY.
Well, it’s Sunday Night and I want to have a quick look at the Indexes and stuff to get a view on how things are likely to play out in the next couple of weeks before 2015 is officially consigned to the Investment Annals of History. My main motivation here is that I have a pretty chunky FTSE100 Long Spreadbet in place and I want to re-evaluate the logic of holding such a position. I’ll look at the Historic backdrop first and then do some Charts - but time is short so I will just pick out some key things that I think are noteworthy.
First off, what are the Historic Precedents?
According to the UK Stockmarket Almanac 2015, the coming Week (commencing Monday 21st December) is the 2nd Strongest Week of the Year and has been up for 73% of Years with an Average Return being a gain of 0.5%. Even more encouragingly, the 23rd December is the 2nd Strongest Market Day and the 24th December (Xmas Eve !!) is historically the Strongest Market Day - even though the London Stock Exchange closes at 12.30pm (and the US Markets close at 1pm their time) - that is some morning !! The Week after, commencing Monday 28th December, is the 7th Strongest Week historically with 67% of Years being up with an average gain of 1.6%. Tuesday 29th December is historically the Market’s 9th Strongest day and the London Stock Exchange closes early on New Year’s Eve (Thursday 31st December) at 12.30pm. For the avoidance of doubt, the Markets are shut on Christmas Day (25th December) and New Year’s Day (1st January)……………. With regard to the Monthly History, December is the Strongest Market Week with the FTSE100 up for 87% of Years with an average gain of 2.5% - that is a seriously strong precedent. Note, January is not so good historically. Since 2000, it has become the 9th Strongest Month (i.e. one of the weaker Months) being up for 57% of Months with an average gain of 0.4%. There is a strange nuance mentioned in the wonderful Almanac (you can get a copy of 2016’s from Wheelie’s Bookshop - mine came this week), whereby up until the Dotcom Boom in 1999, January was easily the market’s strongest month - but that has changed and it is slowly slipping down the rankings - weird huh? Mind you, this probably means that any gains on the Long Side over the rest of December might need to be banked before we get too far into January - that is certainly my intention with the Long FTSE100 Position. It’s worth appreciating also that when everyone goes on about a ‘Santa Rally’, it is actually the coming days around Xmas and New Year that are really where the excitement tends to happen - in other words, I am far happier to be Long than Short. FTSE100 Overall I expect the ‘Santa’ effect of the next few days around Xmas to trump anything the Charts are saying - the coming days will be low volume and sort of surreal - I don’t think we can really view these as normal market days in any way - most usual Market Participants will be out doing their Prezzie Shopping or recovering from Party Hangovers……. The Chart below is similar to one I did recently on another Blog - I have kept the Black Arrows which hint at a Range that possibly might dominate for a while. The most important level here is 5768 which was the Low of 24th August 2015 on ‘Black China Monday’ (as marked with the Blue Arrow) - if this level fails to act as Support, I think things will be very serious. In fact, I think that could mean we will get a Bear Market - this would require a total change of my Strategy with probably much lower Spreadbet Long exposure and I will look to be Shorting the FTSE100 and might even Short some Individual Stocks. My Green Arrow points to the Inverted Hammer Candle which was generated on Thursday 17th December last week - as it should do in this context following a move up, it signalled a Reversal and low and behold, on Friday we got a Down Candle as marked by my Red Arrow. From a straight interpretation here, I would expect more falls - the Support Level in the Short Term being 5875 which is the small Horizontal Blue Line at the bottom. 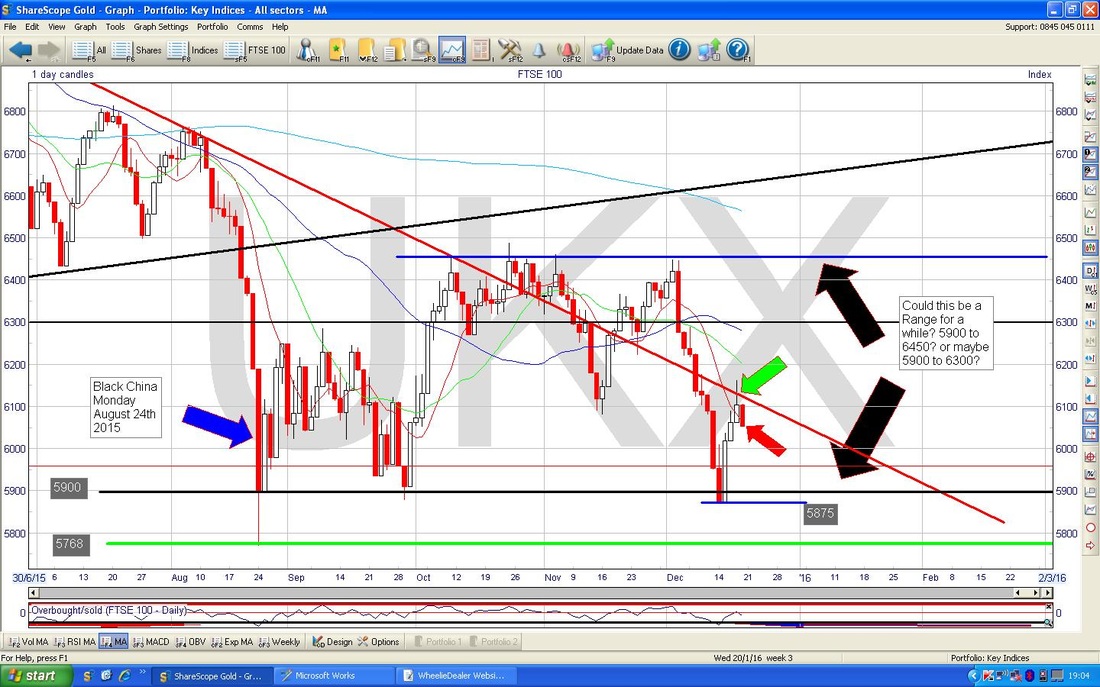
On the Chart below, please look at the Bottom Window which shows the MACD (Moving Average Convergence Divergence). My Blue Arrow points to the MACD Histogram ‘hump’ which looks like it is moving towards being Positive - it could drop again, which would be bearish - so this needs to be watched.
My Black Arrow points to the MACD Signal Lines - these are just another way of representing the MACD like the Histogram - it tells the same story in another way. If the continuous Blue Line crossed the Dotted Blue line from underneath, then that is Bullish. 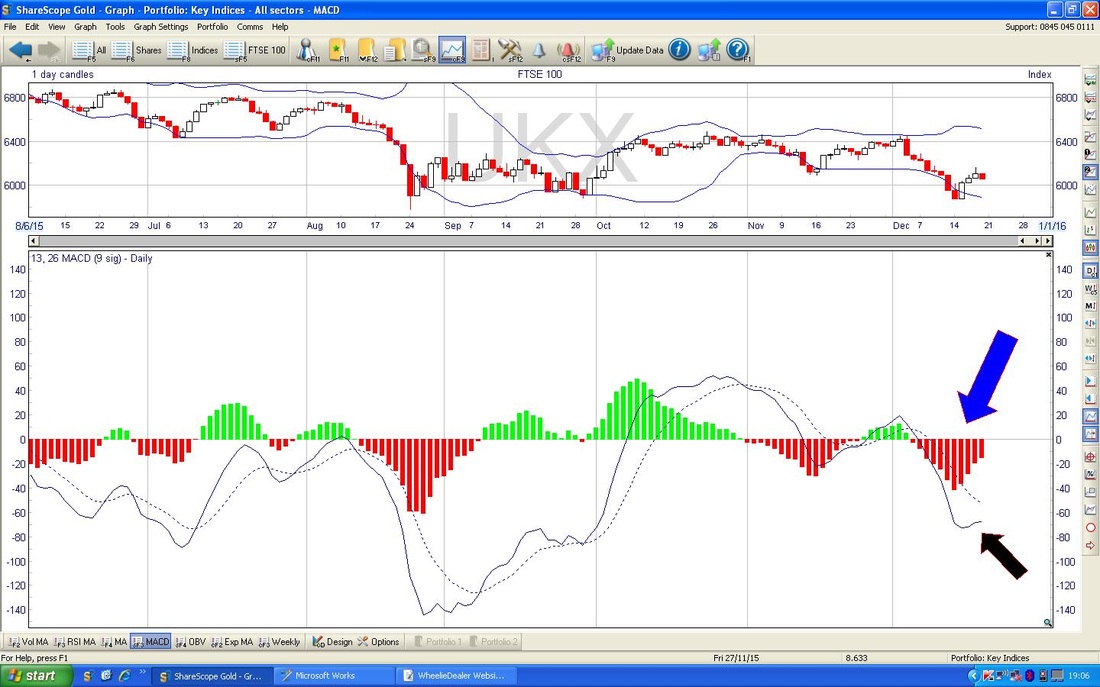
The Chart below shows the Weekly Candles for the FTSE100. Last Week we got a Doji Candle where the ‘Tails’ or ‘Wicks’ of the Candle are about the same size and it is sort of like a Spinning Top - I have marked this with a Blue Arrow. Strictly speaking a Doji in this context (i.e the trend is down from the week before) is really a ‘Continuation Pattern’ whereby the Price will probably keep falling. However, a Doji does hint that the power of the move down is waning - the Bears are not fully in control. It is possible that the Doji could be a ‘Reversal Pattern’ whereby the Price reverses up - this is pretty possible as we go into the weird days around Xmas and New Year.
A better Reversal Signal would be a Hammer like we had some weeks ago which I have marked with a Black Arrow - if we had one of those last Week, then we could be pretty sure the Price was likely to move up from here. Something else to consider is that if we take the Doji from last Week along with the Big Down Red Candle of the Week before, then it would be fair to argue that this is a Bullish Hamari 2 Week Candle Pattern - it is the classic Pregnant Woman viewed from side one - this might be the case and good news for the Bulls. 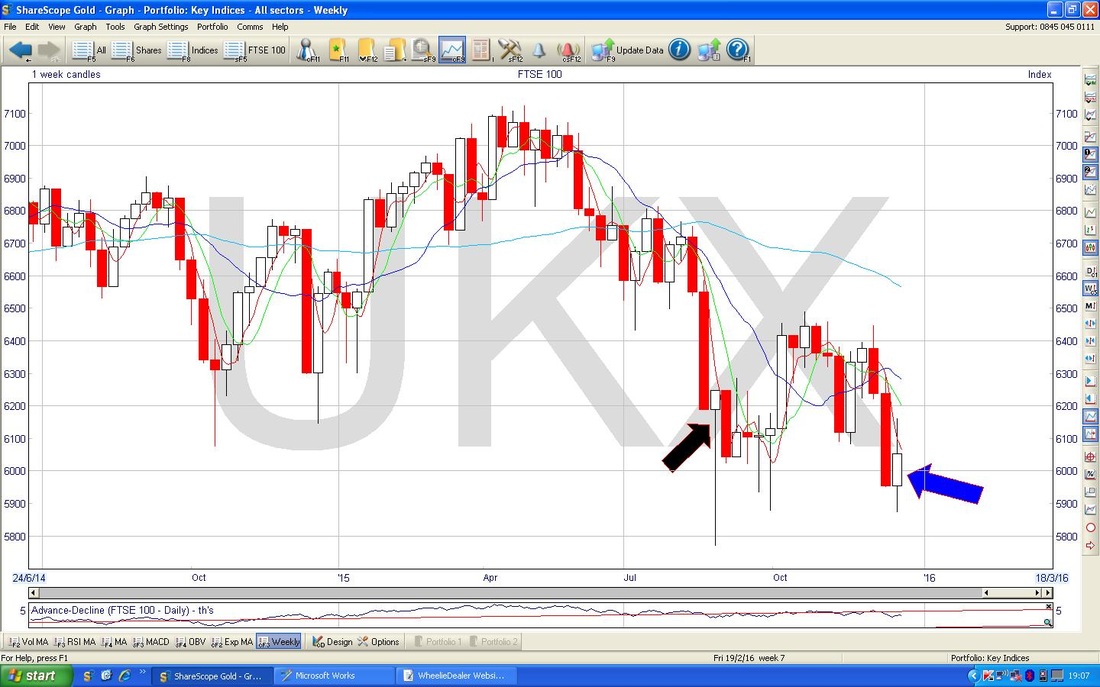
S&P500
Let’s have a reminder of the Longer Term picture - this is a good uptrend channel, however you look at it. 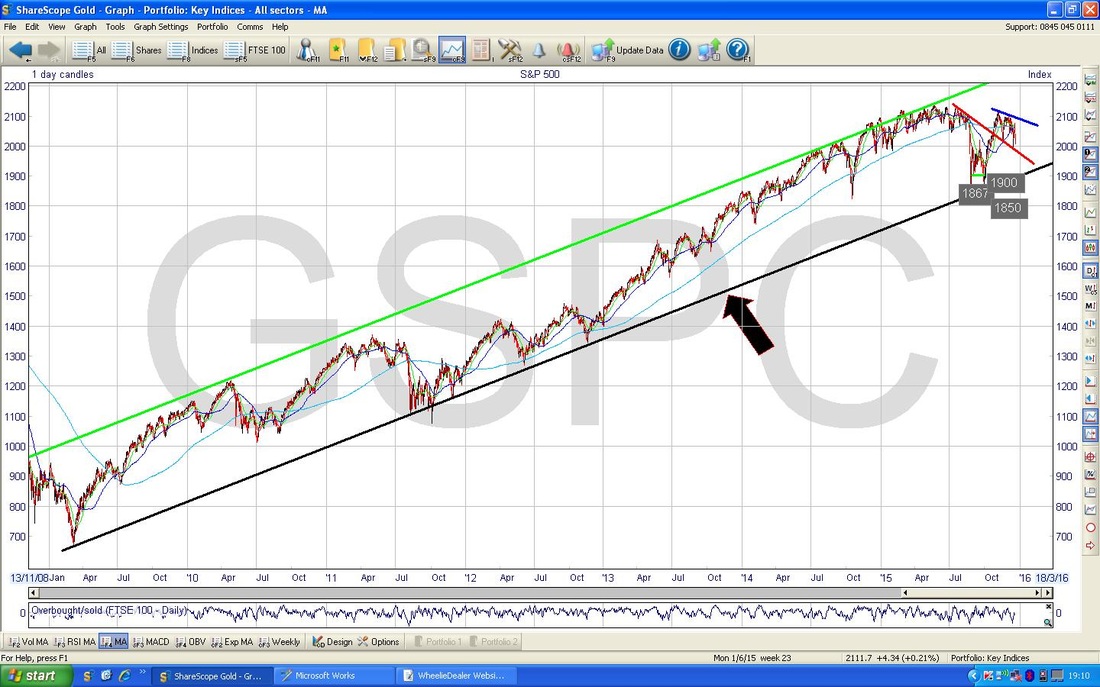
Zooming in close, for the last 2 days of last Week we had 2 big Down days - I have marked Friday’s Candle with the Black Arrow. Key Support here now is 1993 - we must hold this level in coming days or things could be a bit rough - maybe we could see a drop down to 1900 even.
My Blue Arrow is supposed to point out where the 50 Day Moving Average and the 200 Day Moving Average are about to do a Bullish Golden Cross - this would be a good thing going forwards - but to enable it to be cemented, I think we need the S&P500 to turn up pronto. 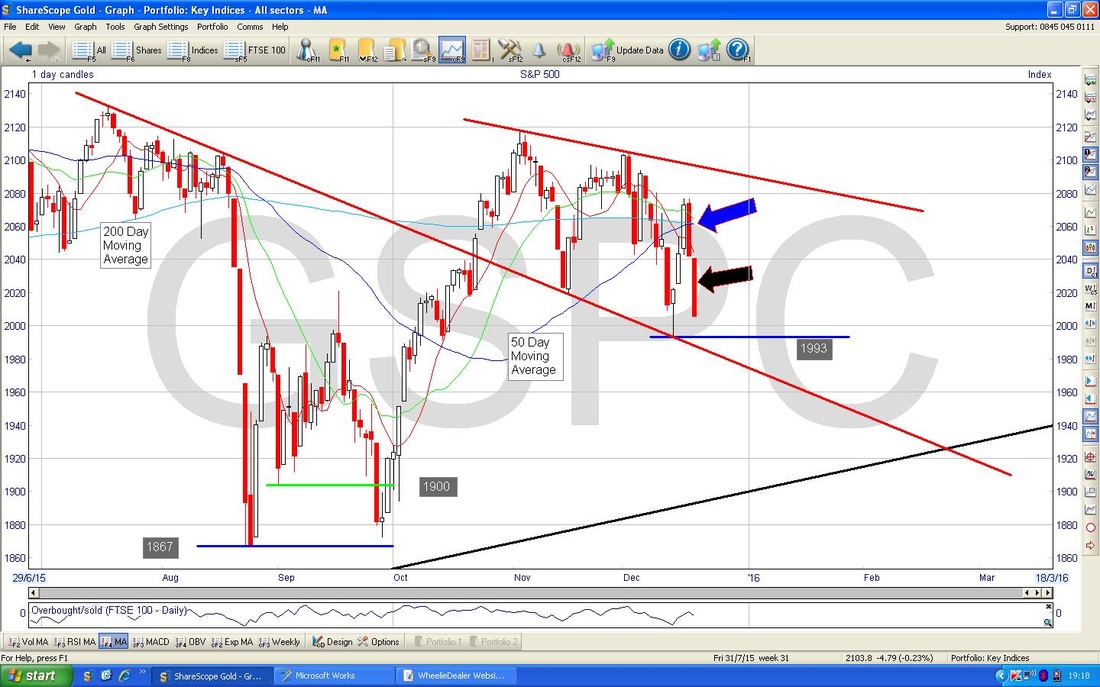
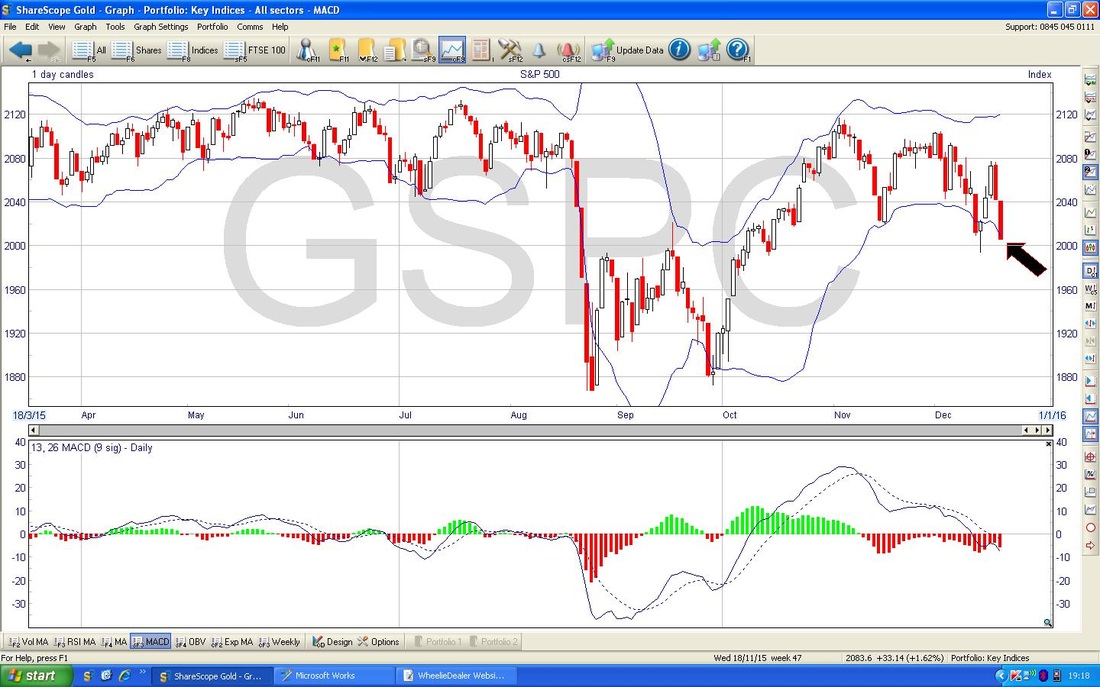
In the Upper Window on the Chart below, we have the Bollinger Bands for the S&P500. My Black Arrow points to where the Price is touching the Bottom Bollie Band - this could act as Support and the Price might reverse up here. However, Prices can hug the bands and continue downwards……..
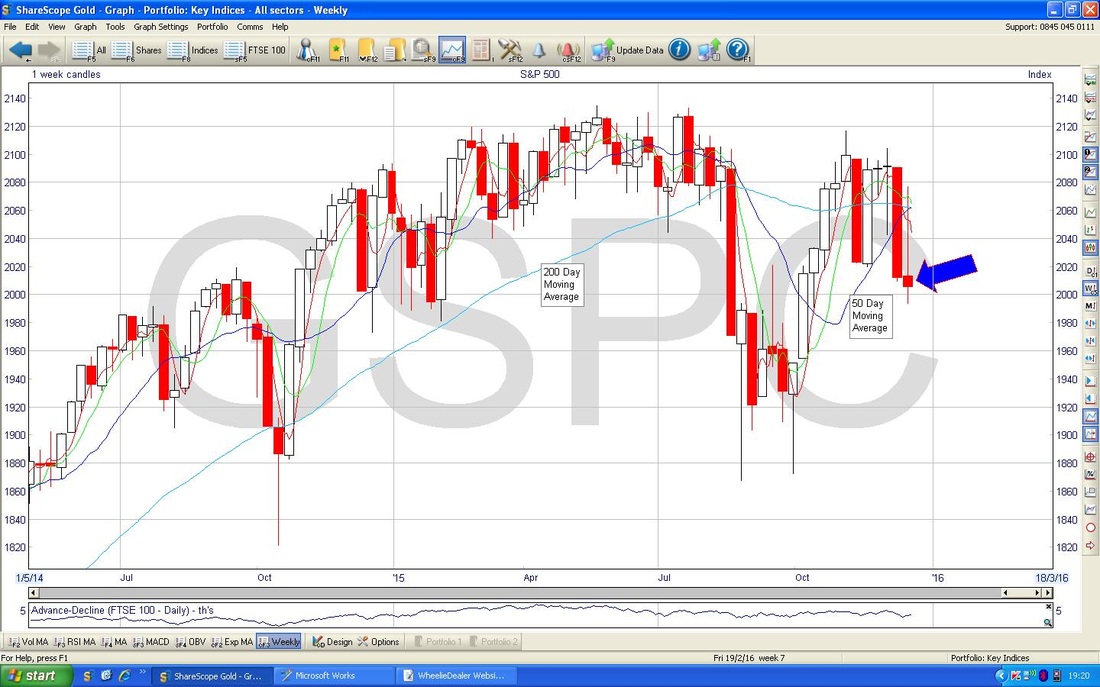
The Chart below has the Weekly Candles on the S&P500. My Blue Arrow points to the Candlestick which was formed last week and it is an ‘Inverted Hammer’. In this context, it might act as a Reversal Pattern, but I would much more have preferred a normal Hammer. But, remember the coming days will be weird.
Brent Oil
A repeat of the Long Term Chart first - as you can see, $35 on Brent is critical Support that must hold - this might get tested very soon. 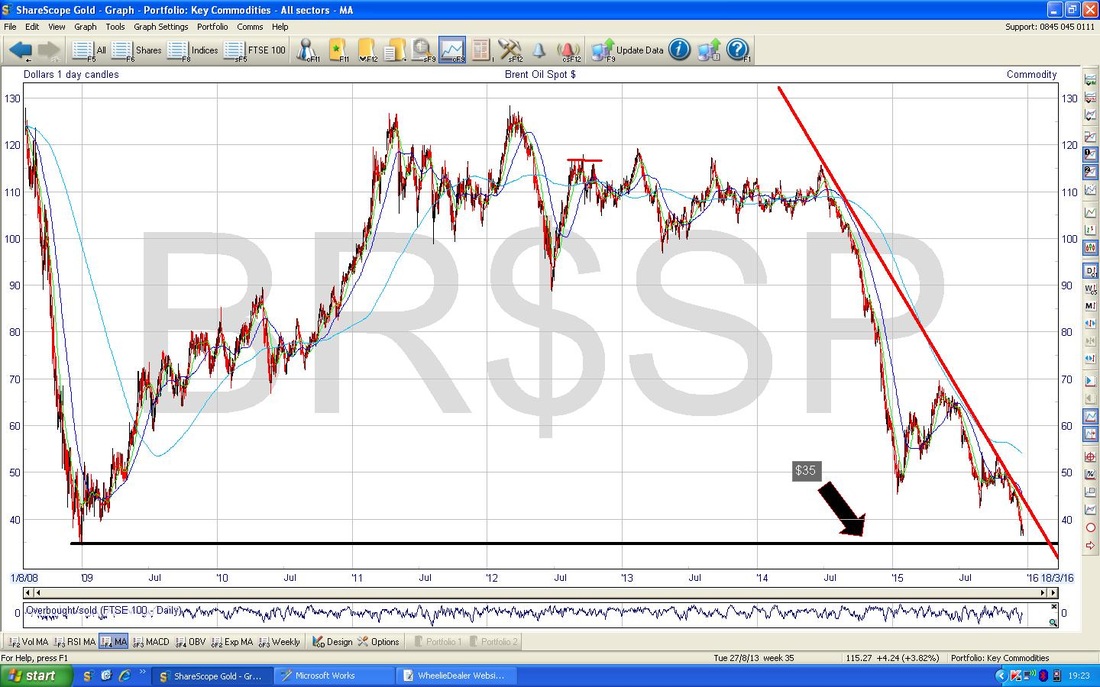
The Chart below is the Weekly for Brent Oil - my Black Circle points out a Doji Candle which was generated last week - this might hint at a Reversal and the Price might go up - however, if you look back 4 Weeks, we had a similar Doji which didn’t lead to much upside. Oil is a very weak market and of course this could weigh on the FTSE100 if it continues dropping in the coming weeks.
Right, that’s it, enjoy the last few days of 2015, cheers, WD. 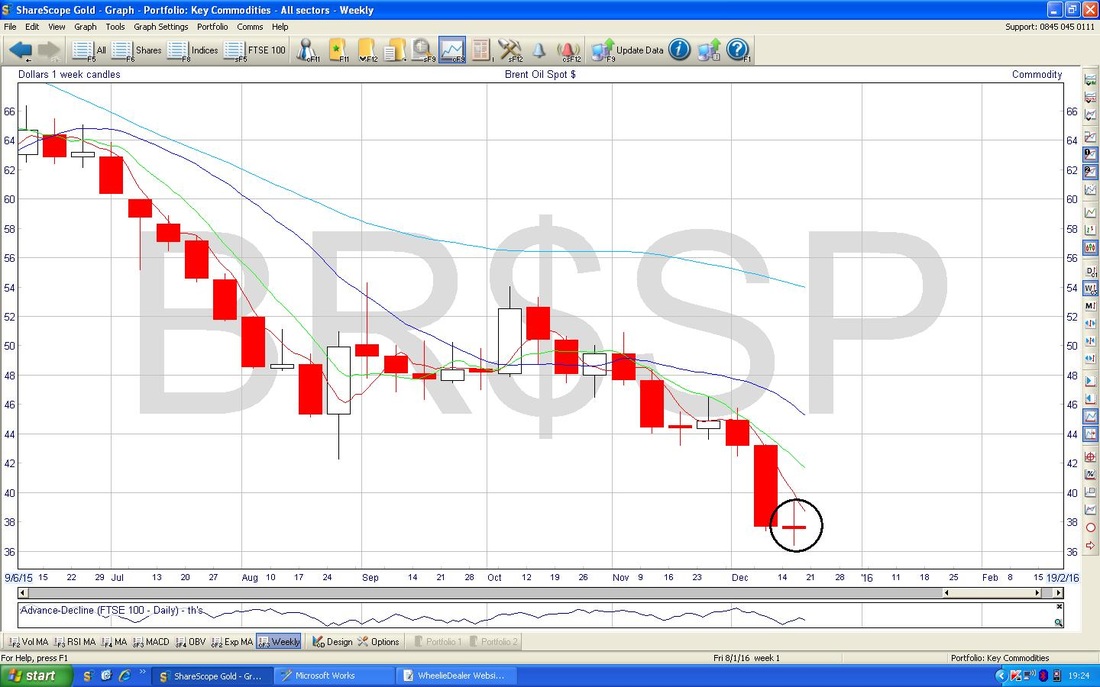
2 Comments
DavR0s
20/12/2015 08:50:47 pm
Hi WD - very helpful blog as always. So re your long I assume your plan is to hold till early Jan unless things turn for the worse. So what might make you bail out before then?
WheelieDealer
20/12/2015 11:18:55 pm
Hi Dave, you're spot on, I would like to run the FTSE100 Long through to early january. The Sell Triggers before that are really a close below 5875 or, more critically, a close below 5768. The latter really worries me as per the blog. Leave a Reply. |
'Educational' WheelieBlogsWelcome to my Educational Blog Page - I have another 'Stocks & Markets' Blog Page which you can access via a Button on the top of the Homepage. Archives
January 2021
Categories
All
Please see the Full Range of Book Ideas in Wheelie's Bookshop.
|
