|
This shouldn’t be too lengthy. Back on Tuesday 20th December 2016 I bought more NG. via a Spreadbet at 937p. This Blog should just outline why I moved when I did and point out the superb Divvy situation going on here. I won’t spend time explaining what NG. is - I am sure most Readers will be pretty clued up on them anyway - it is not really a complex business to understand. Anyway, I wrote a Blog on them a while back which you can find here which might give some background (there is a great link to a piece by Jamie at Compound Income as well - he‘s always worth reading):
http://wheeliedealer.weebly.com/blog/ng-buy-rationale
I already hold a chunk of NG. in my Income Portfolio and as with my recent GSK buy, I like to ‘play’ the big moves up and down on these Stocks using Spreadbets - because I hold the Shares it is part of my normal practice to watch how they move on my ShareScope software most nights and I am therefore able to time my entries - hopefully quite well, but we shall see how it turns out.
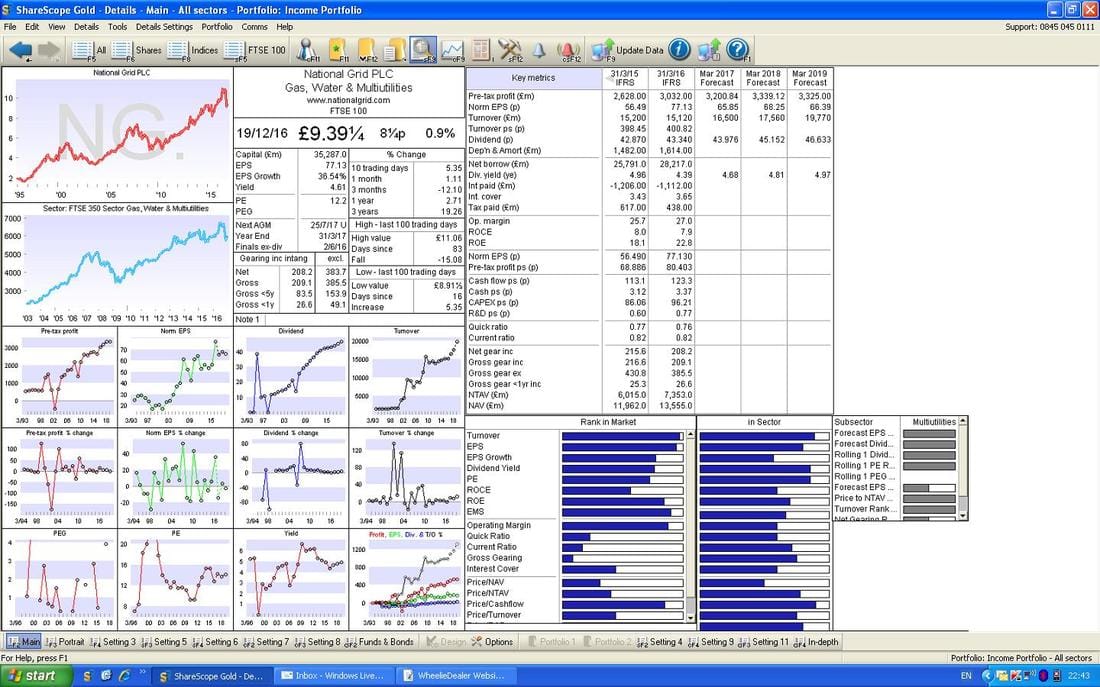
The big appeal on NG. is a nice Divvy just under 5% which is supported by a very stable and cash-generative Business which means the Divvy is pretty safe. NG. is as boring as hell so I see this as quite a Low Risk stock to hold. However, there is an added appeal here at the moment - a few weeks back they announced the Sale of their Gas Distribution Business and as a result Shareholders are going to benefit from a Special Dividend in Q2 of Calendar Year 2017 and a Share Buyback Programme. Together these add up to £4bn of Shareholder Return (on top of the Divvy we get anyway) and this is about 11% on the current Market Capitalisation of around £35bn. The Special Divvy will be at least 75% of the Return so that is about 8.5%. Another way of looking at it is that at my Buy Price of 937p it is like I will be getting back around 8.5% of it early next year - so that means I will have only paid around 860p per Share (do the math !!) - and the Share Buybacks will be on top of this. In addition, if we see more Weakness in the Pound Sterling then Stocks like NG. will benefit because Overseas Buyers will be able to pick up the Income cheaply in their own Currency. Having said that, my view is that the Pound won’t fall much further - it is already really beat up. Fundamentals As ever all the ScreenScrapes are from the sublime ShareScope software that I use and they are taken from the night before I made my purchase - i.e. they are from Monday 19th December. Regular Readers will most likely be aware of my perversion about only making Buy or Sell Decisions ‘Out of Hours’ - I don’t like to make such critical (and potentially Money making or losing) Decisions at a time when the gyrations of the Market can so easily influence my calm rational thinking. In reality, I tend to ‘set-up’ my Buys or Sells many days (if not weeks) in advance so it is extremely rare for me to make a snap judgement about anything. In the Top Right Hand Corner on the ShareScope ‘Details’ screen below look for where it says ‘Dividend (p)’ and under the column for ‘Mar 2017 Forecast’ it has a figure of 43.976 which on my Buy Price of 937p gives a Dividend Yield of 4.7% for the Current Year (43.976 divided by 937p then multiply by 100%). For the following Year it is 45.152 which gives me a Forward Divvy Yield of 4.8% on my Buy Price of 937p. The Price / Earnings Ratio doesn’t motivate me much here - this is really about the Divvy and the quality and reliability of the Income Stream - but for interest the Forward P/E on my Buy Price of 937p is 13.7 - which is pretty reasonable actually (937p divided by 68.25p).
Technicals
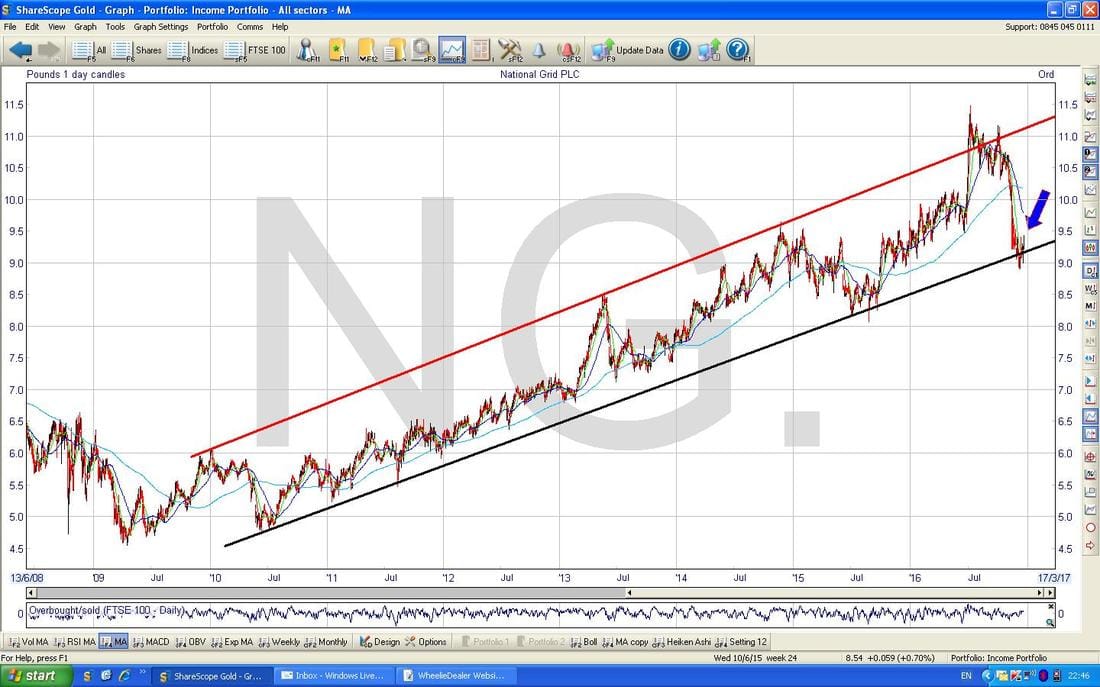
This Blog is really about the timing issues around my Buy of NG. and so this bit on the Charts is more the nub of it. The Chart below is a Long Term ‘Big Piccie’ view going back about 6 years. The Uptrend Channel should be pretty clear to spot and you might be able to discern that the Price has started to move up off the ‘Floor’ created by my Bottom Uptrend Line (I am pointing to this with my Blue Arrow).
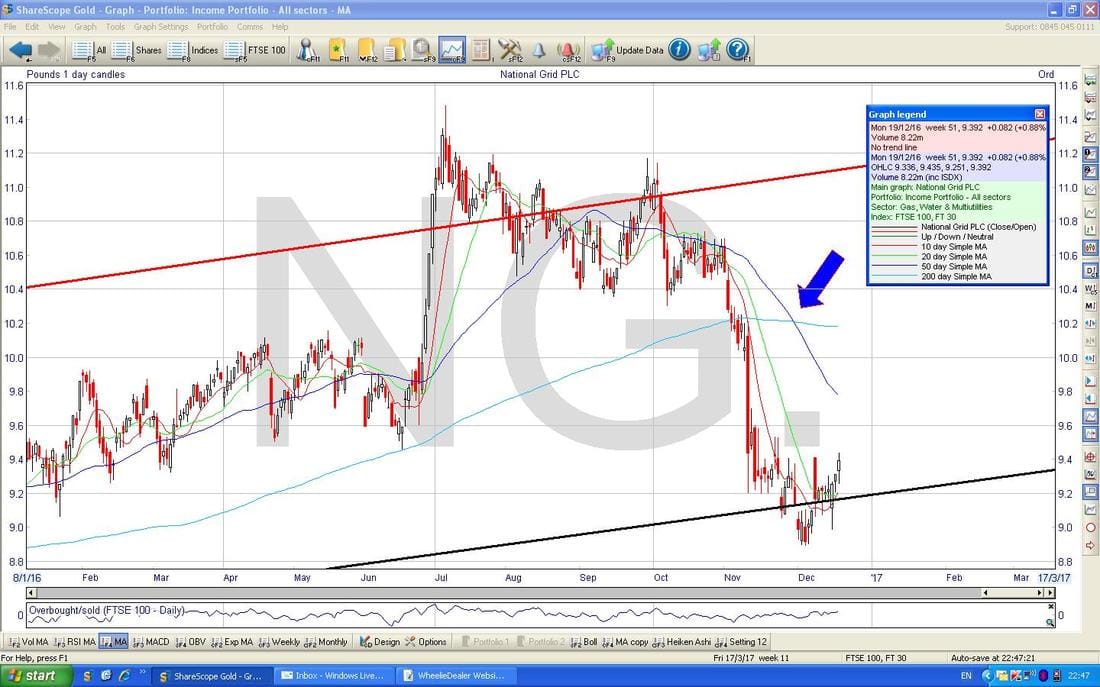
On the Screen below we have the Daily Candlesticks for NG. for most of 2016 and my Blue Arrow is pointing to a ‘Death Cross’ between the 50 day and 200 day Simple Moving Averages. This is obviously not something I really want to see but it is worth bearing in mind that these kind of Crosses are quite lagged and I have seen many occasions where they soon get reversed with a ‘Golden Cross’ - there are no guarantees of course but I suspect a similar thing could happen here. Due to this lag, it is very possible that the Share Price can rise up in the Short Term from here.
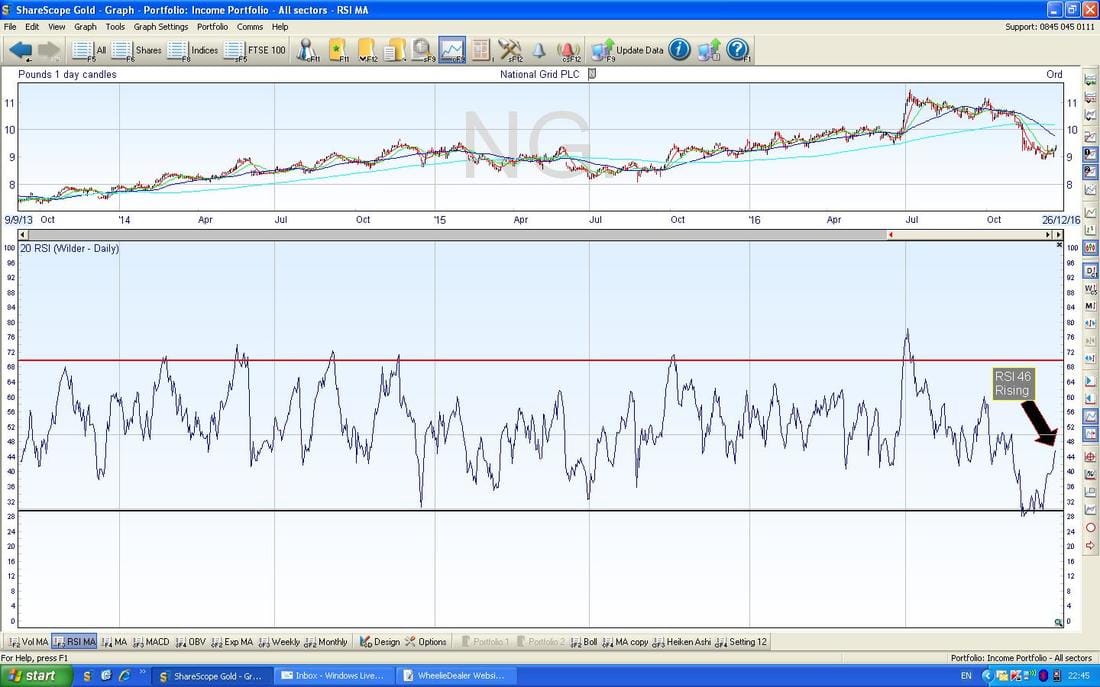
In the bottom window on the Screen below we have the RSI (Relative Strength Index) for NG. Daily. Note where my Black Arrow is that we have a reading of RSI 46 and it is rising. I think conventional charting wisdom is that when it passes through RSI 50 on the way up that is a good thing - so it will be nice to see if we get that in coming days.
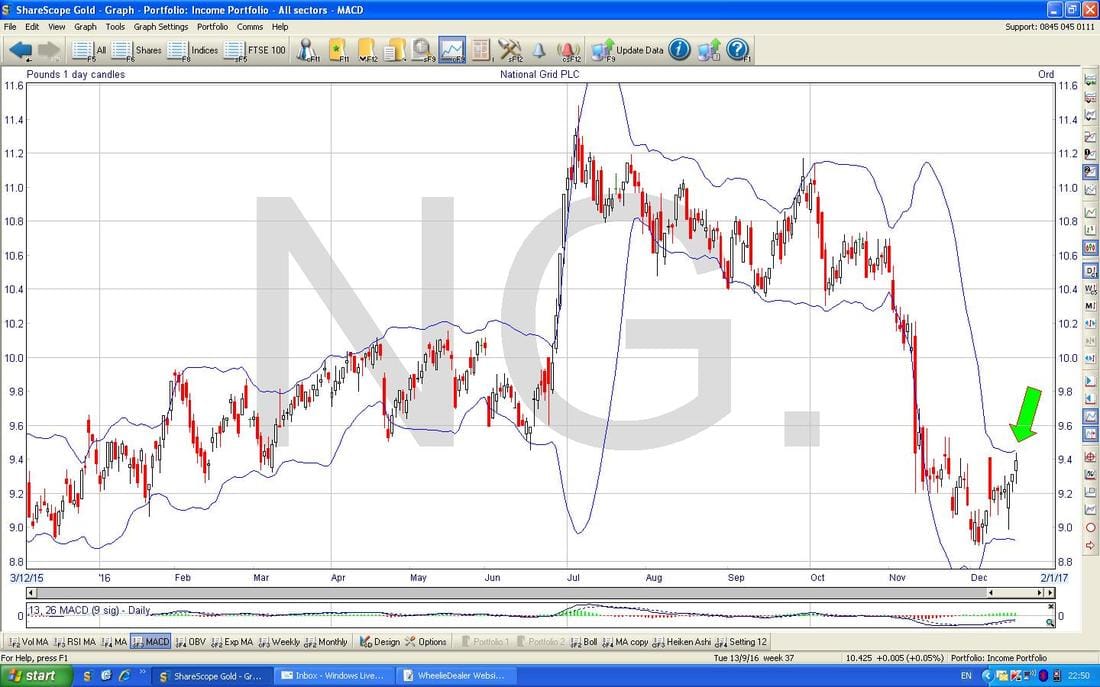
The Chart below has the Daily Price Candles surrounded by the Blue Wiggly Bollinger Bands above and below. My Green Arrow is pointing out how the Price has got up near the Upper Bollie Band so it is likely it will ease back in the Short Term so this Screen is telling me not to buy quite yet.
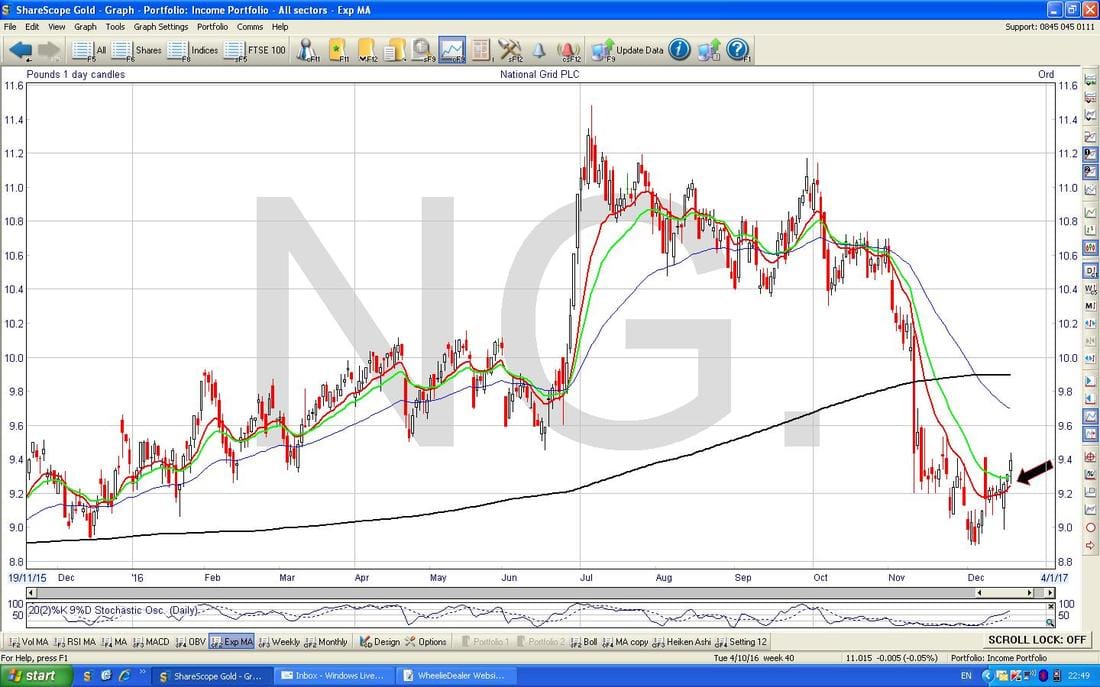
On the Screen below my Black Arrow is pointing to where the Red 13 Day Exponential Moving Average (EMA) is looking like it will soon cross the Green 21 Day EMA - this would be a nice Bullish Development as such a Cross often means we will see a few more Days or Weeks of gains.
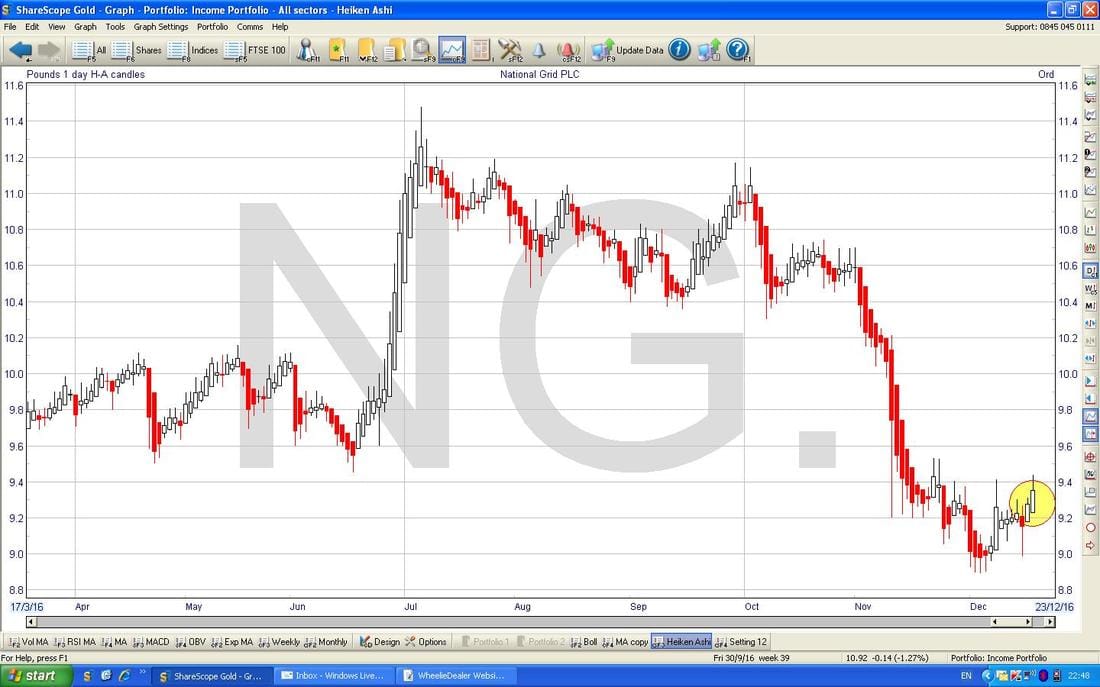
This is probably the Screen that got me most excited to buy and was the key element. The Candles below are not of the usual variety - these are this new discovery of Heiken Ashi Candles and I really love the things because they give very clear Signals of both when to Enter and Exit a Trade but also because they help me stay in a Trade once it is underway (there is perhaps a small price to pay in terms of lag and delay but the certainty and clarity of the Signals probably overweigh this minor drawback).
On the Chart below note we had about 6 Small White ‘Up’ Days and then we got a Red ‘Hammer’ Candle which was then followed by 2 White Up Candles (I don’t like using the term Hammer here because we must realise that HA Candles have almost nothing to do with Normal Candlesticks - so we should be careful mixing the nomenclature). My Yellow Splodge is highlighting the Red Hammer and the 2 subsequent White Up Candles. When using HA Candles like this, we have to look for the Red Hammer first and then when we get the first of the White Up Candles that is telling us the Trend might be turning Up again. Once we got the second of the White Up Candles, I took that as a ‘Buy’ Signal. Note the huge string of Red Down Candles that started around the 1060p level - I have been watching this move down for weeks and weeks and have been waiting for the appearance of a ‘Bottom’ - as per my previous Charts I think the Bottom is probably in now and I was happy to make my move. As I mentioned on the GSK Blog recently, I like to think of a concept of ‘Dividend Support’ - once a Quality Stock like NG. with a decent big Divvy gets to a certain level, the Dividend Yield starts to kick in and Supports the Price because Income Buyers (like me !!) have been waiting on the sidelines watching it fall and once the Yield is juicy enough, then they pounce. Support is usually understood (framed?) in terms of certain Technical Price Levels where Buyers come in and ‘Support’ the Price - my concept of ‘Divvy Support’ is slightly different to this but in effect it does a similar role of stopping the Price from dropping too far.
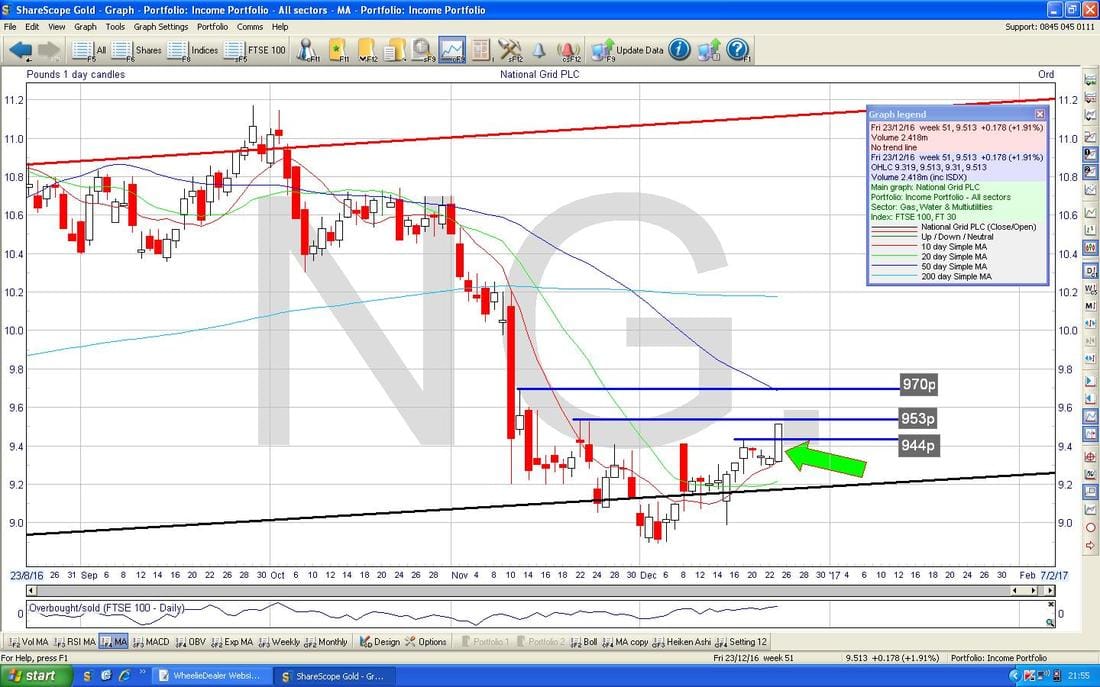
Here’s a bit of a Brucie Bonus for Readers who have stuck with this Blog so far and it’s your reward for the pain and suffering. I don’t normally do this because I like my Blogs to be showing the ‘Real World’ situation that prevailed when I made my Decision to Buy or Sell but something quite sweet happened today (Friday 23rd December when I am typing this) and I wanted to point it out.
The Chart below has the Daily Candles as they stand after Friday 23rd December and my Green Arrow is pointing to how a Big White Up Candle was produced today and the key thing is that it broke over the 944p Resistance Level from a couple of days ago. As you can see on the Chart, we now need to crack 953p and then 960p and 970p - if we crack the latter then there is not much Resistance all the way up to 1000p. With patience here I think a Target of around 1060p is very possible and on my Buy Price of 937p this would give something like 120 Points of upside. Note the 13 Day EMA did actually do a Golden Cross against the 21 Day EMA - I will not point this out to you - you can look at the ‘Graph Legend’ and my previous Chart to understand which Lines I am talking about !! Anyway, it is likely if we get a strong rise I will sell the Spreadbet Position but I will keep the Normal Shares in my Income Portfolio whatever happens - I see NG. as the sort of Stock I can just tuck away and ignore for years and years and it will keep pumping out a decent near 5% Divvy that should rise through time, albeit slowly. Obviously a Risk here is that Interest Rates in general will rise and this could reduce demand for such High Yield Divvy Stocks - my own view on this is that even if Interest Rates do rise it will be very slowly and Stocks like NG. will probably do pretty well in coming years. OK, that’s enough, Happy Santa Day everyone !! Cheers, WD.
0 Comments
Leave a Reply. |
'Educational' WheelieBlogsWelcome to my Educational Blog Page - I have another 'Stocks & Markets' Blog Page which you can access via a Button on the top of the Homepage. Archives
January 2021
Categories
All
Please see the Full Range of Book Ideas in Wheelie's Bookshop.
|


