|
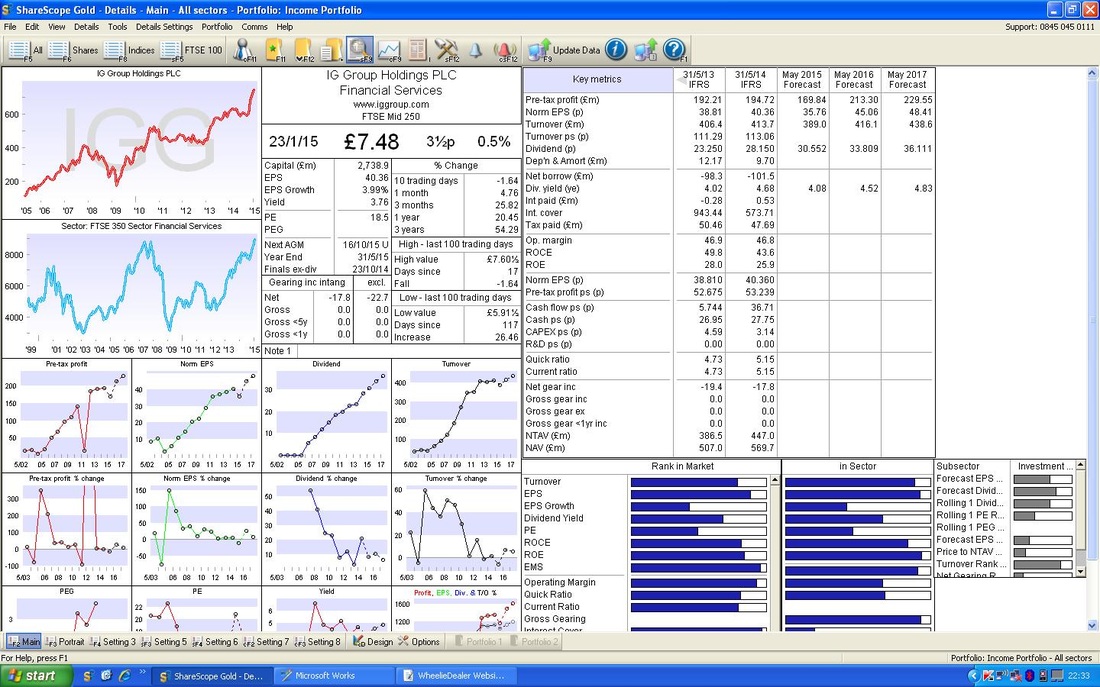
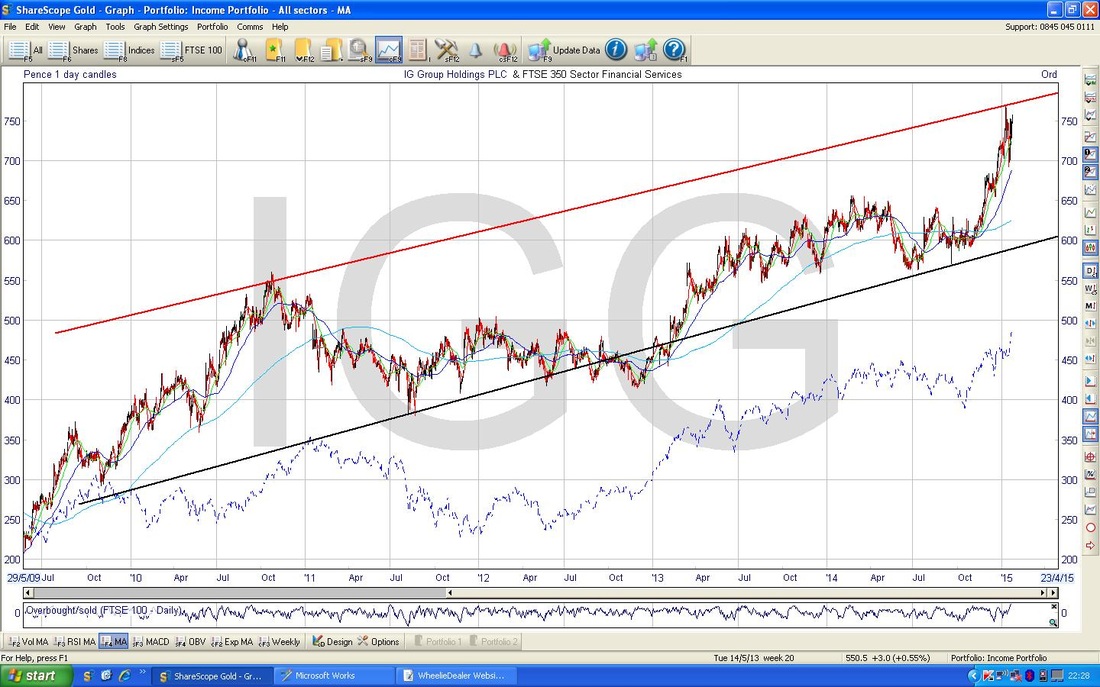
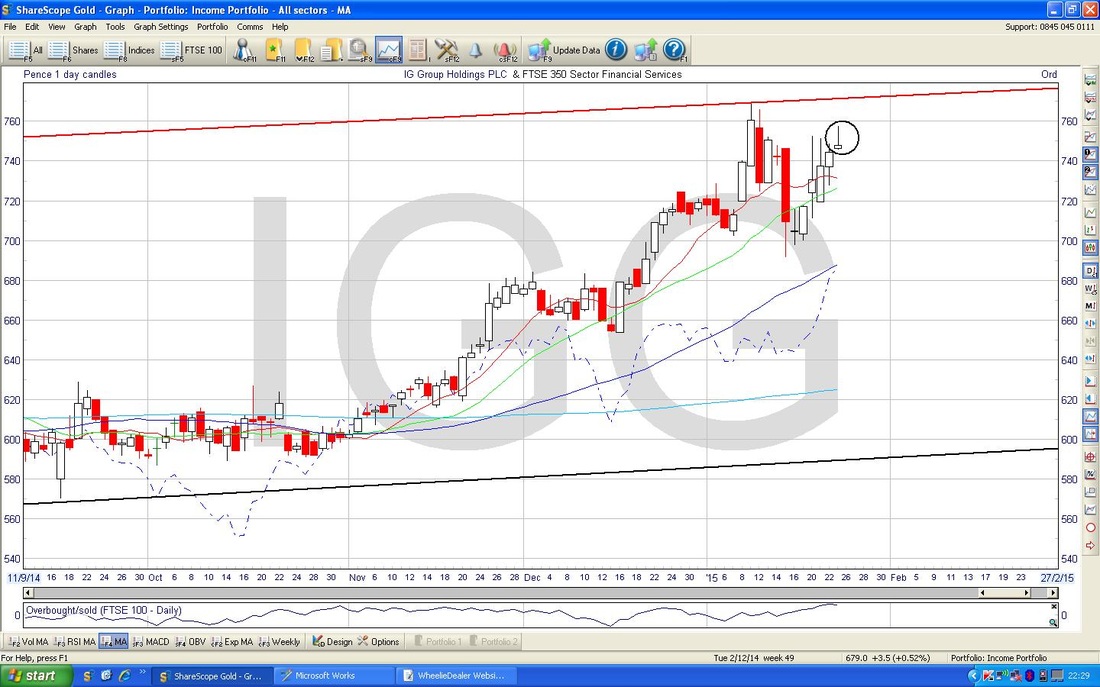
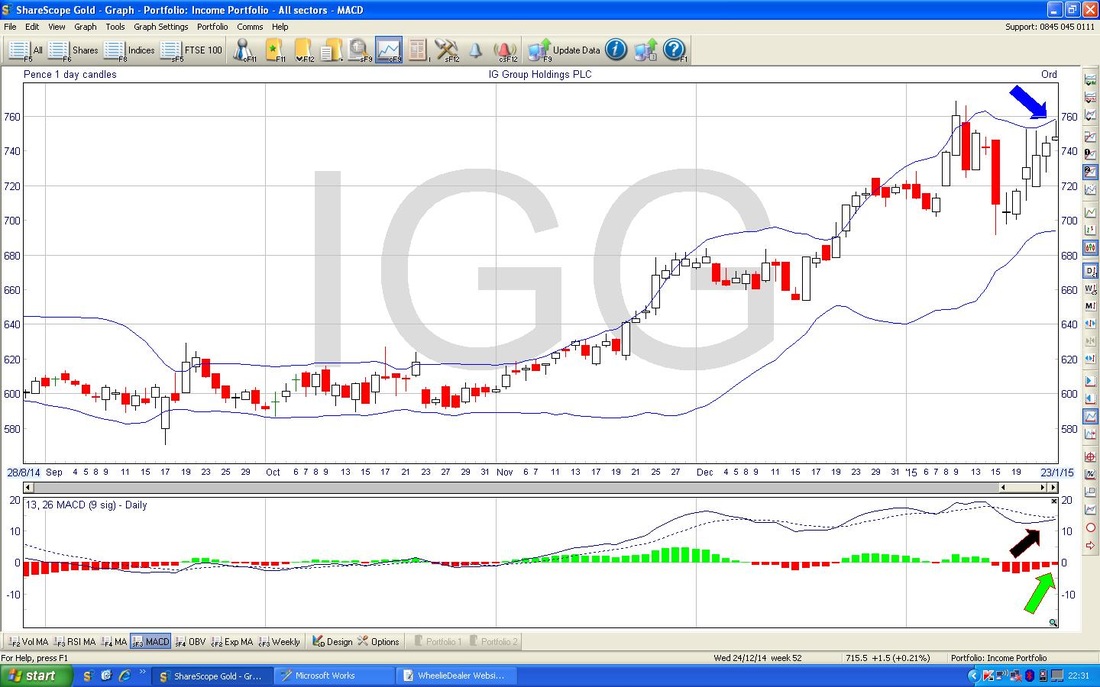
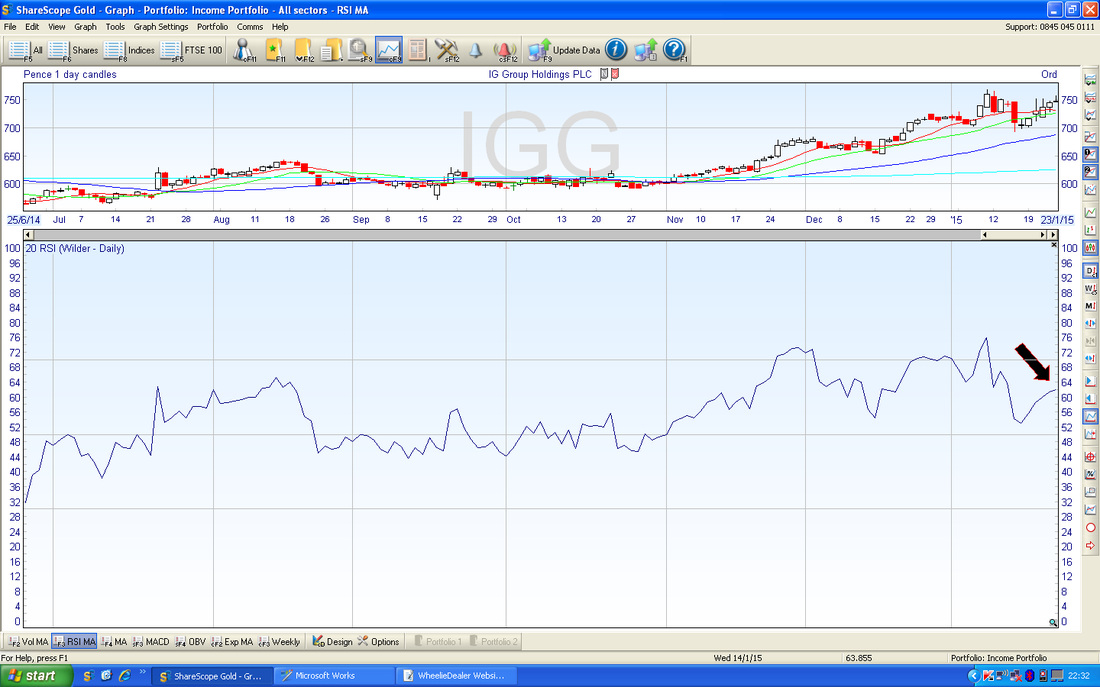
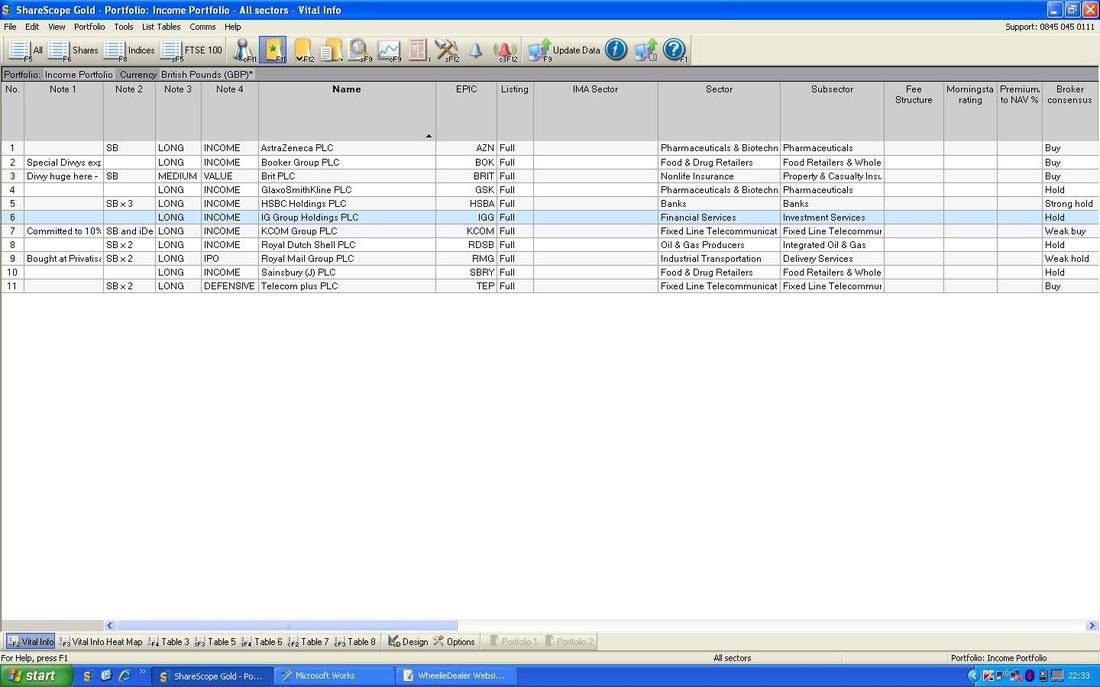
THIS IS NOT A TIP. I AM NOT A TIPSTER. PLEASE DO YOUR OWN RESEARCH. PLEASE READ THE DISCLAIMER ON THE HOME PAGE OF MY WEBSITES. I sold off some IGG yesterday - but have kept a chunk in my Income Portfolio as I think it is a great Stock long term but seems Toppy for now and I want to build Cash and reduce my Exposure in the early months of this year as we head towards the uncertain General Election. This period of the Year is always bad and the Election will give the ‘Media’ plenty of time to get the Fear of God into Investors and have them panicking for the Exits. “Sell in May and go away” and all that……….. IGG still produces a good Divvy so it deserves it’s place in my Low Maintenance Income Portfolio (please see my ’Trades / Portfolios’ page for details), and a wonderful sideline is that because I will still be in IGG, I will be looking at the Chart every night and will be able to spot an Opportunity to buy back in again if one shows up. I find with Stocks in general that when I don’t own them, I tend to get distracted and move on to something else (I think the Psychology term is the ‘Availability Heuristic’ - we are attracted to things that are jumping up and down and flashing in front of our eyes, and we forget the other Great Stock that has now become ancient history !!) Peter Lynch in ‘One up on Wall Street’ (I think this is available in Wheelie’s Bookshop www.wheeliedealer2.weebly.com), said that he often took a tiny stake in a company he liked as a sort of ’Pilot’ Position because then he kept an eye on it, and could buy more if it made progress. Anyway, the main reason I sold was because it was starting to get a bit expensive in p/e terms and stuff. If you look at the ScreenScrape from ShareScope below, you will see that EPS for 2016 is 45.06p - at the Price of 748p, this gives a Forward p/e of 16.6 - bearing in mind the Cash Pile, this is not too high but it is no longer ‘cheap’. I consider Cheap as p/e 10 or below, 20 is high and ‘Expensive’. Technically it had got very over-stretched to the Buy Side recently and seemed primed for a fall. I find that Short Term (days/weeks) moves come in Waves - you get a ‘Wave’ of Buying followed by a ‘Wave’ of Selling and Vice Versa - it just goes on like this all the time for ALL markets (don’t confuse with Elliott Waves - that is just pure Fantasyland in my view - never understood it - and never seem to need to. Maybe it is more for Daytraders and Position Traders). There was also a good Portfolio reason for Chopping some IGG - I have been mulling over the HSS Hire IPO as a possible ‘Stagging’ opportunity, where I would buy in the Public Offer and then ditch very soon after Float - hopefully for a good profit very fast. Obviously I would need Cash to do this so I wanted to be ready - and IGG looked like the best thing to prune in my Portfolio. However, I probably won’t bother with HSS as looks like any move up would be pretty limited and it doesn’t seem worth the hassle - not decided for definite yet though. In addition, I have my eye on a particular Stock and I need a bit of Cash for it. Worth adding that it is always worth banking a Profit. Remember “A Profit is not a Profit until you Bank it” - I have been hurt too many times where I have a lush Paper Profit but it gets wiped out by a sudden Profit Warning or other ‘Out of the Blue’ event. I find most Investors totally fail to allow for these unexpected, Black Swan, type events - we think of them as General Market phenomena - but to my mind you can apply the principle to individual Stocks as well. In both cases they are unwelcome !! This Black Swan problem is even more acute if you only hold a small number of Stocks - for example, if you have just 8 stocks then a Black Swan could peck your Bum Cheeks in a very painful way !! (oh dear, Mr Wheelie, gonna have to refer you to the RSPCA again……) Technicals Long time Readers (LOL - WheelieDealer has only been around since October 2014) will probably know that I tend to Buy companies based on Fundamentals and use Technical Analysis techniques to time my Buys and Sells (Entries and Exits). To be honest, when Buying I tend to put most emphasis on Fundamentals, but when it comes to Selling, I probably put more emphasis on Technicals - for more details on how I go about Selling, look at my Blog Series ’An Overview of WheelieDealer’s Sell Triggers’ which you should find under the Category ‘Selling Rationale’ or ‘December 2014’. If you look at the Chart below, this gives a clear view of a fairly Long Term Uptrend (since 2010) - the ‘Channel’ is pretty clear here and I have marked it with the Black and Red lines. As you can see, the Price was up at the Top of the Channel. Please note, all these Charts are from Sunday Night - so this is what I was looking at when I made my ‘Sell’ decision - I always try to make decisions to Buy and/or Sell outside of Market Trading Hours so that my Emotions are not affected by the crazy gyrations and swings we get. For Your Information, the blue wiggly line lower down is the Sector Chart. The next Chart (below) shows a much shorter Time Frame and the Daily Candles are clearly visible (for more details on the wonders of Candlestick Charting, please nip over to Wheelie’s Bookshop at www.wheeliedealer2.weebly.com and get yourself a copy of ‘Candlestick Charting for Dummies’ - it is a cracking book and quite easy to understand - can make a huge difference to your Returns). I have put a Black Circle around the Candle from Friday. This is what is called a ‘Gravestone Doji’ or something like that - scary name or what? I can’t really remember the name properly (it could well be a ‘Hanging Man’) but that is not the point - I just know that after a Short Term Upmove of a few days, to get one of these is Ugly for Bulls - a clear and early Sell Signal. The Chart Below shows the Bollinger Bands in the top window. I have put in a Blue Arrow to show that the Price was up near the Top Band - shows it was getting Toppy. However, in the bottom window, you can see the MACD Indicator (Moving Average Convergence Divergence) which actually hints at a Positive Move - if you look at the Black Arrow it appears that we might get a Positive Crossover which would be good for the Bulls and this is confirmed in the Histogram Bars marked with the Green Arrow. This highlights the point that often with Technical Analysis you get situations where you get conflicting signals - in this case, a MACD crossover had not actually happened and it was very likely it would bounce down and miss the Crossover. There is a certain ‘art’ in figuring out which Indicators are likely to be the most accurate - comes with experience but always Probabilistic. It is worth appreciating that the Candles are pretty much the first warning you get - they are more ‘timely’. For more Information on the Technical Analysis Indicators I use, click on the Category ’Buy Rationale’ and find my OPAY blog series - these give very detailed TA stuff and explain if quite well, I hope. The Chart below shows the Relative Strength Index (RSI) in the bottom window. I have marked in Black that it is reading about 62, which is not Overbought (this is really around 70) so this Indicator is not really all that negative a Sign. It was clear to me that the Nasty Gravestone Candle thing was the earliest warning that I should sell. ShareScope Screens That pretty much covers it. Anyway, I thought I would just cover one other thing. I have had some recent Tweeterer chats with people about ShareScope functionality and I intend to do a proper detailed Blog on it in future (god knows when, the Stack is huge !!). So, to be helpful (yes, I know that is rare !!) I decided to just bung the ScreenShot below in as well. ShareScope Bronze (the Cheap, ‘End of Day’ version, that is all you need) essentially has 3 Screen Views which you can ‘cycle’ through by plonking your ‘Enter’ key. The screens are the ‘List’ screen below, then the ‘Chart’ screen (I have shown you gazillions of these little beauties) and then the ‘Fundamentals’ screen which is the one I showed right at the start with the Earnings and Numbers stuff on it. That’s it, all you get. But in reality it is amazing Software and the Configuration possibilities are amazing. I don’t think any other TA package comes close for the Price - stunning value.
Anyway, that is for another Blog, just wanted to show you these basic screens. I’ve got another one to do now for EZJ - no peace for the Dodgy People and all that……… Roll on…….wd
0 Comments
Leave a Reply. |
'Educational' WheelieBlogsWelcome to my Educational Blog Page - I have another 'Stocks & Markets' Blog Page which you can access via a Button on the top of the Homepage. Archives
January 2021
Categories
All
Please see the Full Range of Book Ideas in Wheelie's Bookshop.
|


