

|
educational blogs |
|
THIS IS NOT A TIP OR RECOMMENDATION. I AM NOT A TIPSTER. PLEASE DO YOUR OWN RESEARCH. PLEASE READ THE DISCLAIMER ON THE HOME PAGE OF MY WEBSITE. IF YOU COPY MY TRADES, YOU WILL PROBABLY LOSE MONEY.
You may have noticed that I bought some Galliford Try (Epic Code GFRD) Shares today at 1469p and I also did an equivalent sized Spreadbet at about 1462p - I did the Shares straight after the Spreadbet so it is surprising just how fast the price changed (normally I would expect the Spreadbet price to be within a few pence.) I have gone straight in quite heavy here because I really like the GFRD business and Readers may have seen from various comments that I am generally pretty Bullish on the Markets at the moment and I want to maximise the opportunity which I think exists. I have gone for an exposure of 3% to GFRD in my overall Total Portfolio Exposure - so no mucking about.
Housebuilders tend to go well in Quarter 1 each year and I would expect Simon Thompson will be doing his Investors Chronicle article to this effect very soon - must be a great one for him to write, as a lot of it will be Cut & Paste - good luck to him. Recently Housebuilders have come right off the boil and I think this gives a great opportunity to get in now before the Q1 rush and hopefully I can pick up on the Santa Rally as well (it better happen !!).
I held GFRD for a couple of years but sold out (with a juicy profit and after nice divvys) a few months before the Scottish Independence Vote - they have operations in Scotland and I was concerned that they would be hit if the Vote went for Independence. GFRD is a funny wee beastie, because it is a hybrid of Housebuilding (mainly as Linden Homes) and General Construction. This really appeals to me because I don’t have any of the usual Housebuilder Stocks (although I do hold a small position in McCarthy & Stone MCS which do Retirement Homes and I also have Empiric Student Property ESP - which does what it says on the tin. So I sort of have related exposure but nothing that is direct) and I also no longer hold any Construction related Stocks as I sold out of Costain COST a while back. It is pretty clear that the current Government has a huge problem with undersupply of Houses and is also trying to get loads of Road Building and Rail and other Infrastructure Projects going - so there should be plenty of work for the decent Constructions Players. Housebuilding makes up about 54% of Revenues and Construction is the remaining 46%. I note a chunky Order Book in the Final Results from 16th September 2015 for Construction and that 90% of this year’s Revenues were secured - since then there has been a few months so I expect they are pretty much covered now. They had £17.3m of Debt at Year End - i.e. nothing much. GFRD is FTSE250 Listed and I note they are due to do a Half Year Report on 23rd February 2016. Recent Trading GFRD issued an AGM Statement on 13th November 2015 which you can read here. It is all nice and positive and says in line with Expectations: http://www.gallifordtry.co.uk/investors/regulatory-news Greg Fitzgerald the current Executive Chairman was CEO until very recently but now a chap called Peter Truscott has arrived from a Senior Role at Taylor Wimpey to be the New CEO - it seems a pretty orderly and well managed transition so far. Greg Fitzgerald has always seemed impressive and will still be around as a Non-Executive Chairman from 1st January 2016. Director Selling There was a lot of Director Selling on 28th September 2015 - from what I can tell this was because they had been awarded Shares under Long Term Incentive Plans and were selling part of the Shares to satisfy Tax Liabilities which arose as a result of the Awards. The Directors all seem to have sizeable chunks of Stock - skin in the game and all that. Website You can find the Company Website here: http://www.gallifordtry.co.uk/ The Investors section is here: http://www.gallifordtry.co.uk/investors Risks
Valuation I won’t spend hours on this - you can use the numbers from the Screenshot below to figure out the P/E and Divvy Yield etc. if you want to check them. As I see it, the figures are as follows: Forward P/E for 2017 (next year) is 9.7 Dividend Yield for 2016 (current year) is 5.4% Forward Dividend Yield for 2017 (next year) is 6.8%. (these are based on my higher Spreadbet Buy Price of 1469p). Good value I am sure you will agree. Visibility is quite good really due to the Order Book and stuff, in the absence of a Slowdown, the Revenues and Earnings Expectations look realistic. 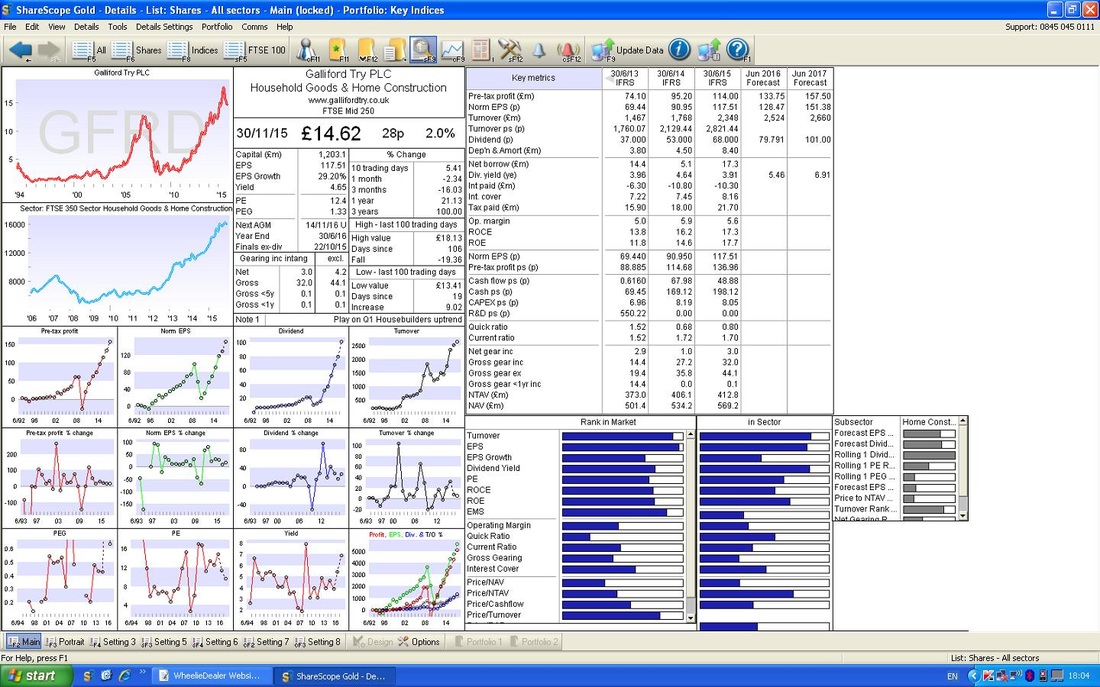
Targets
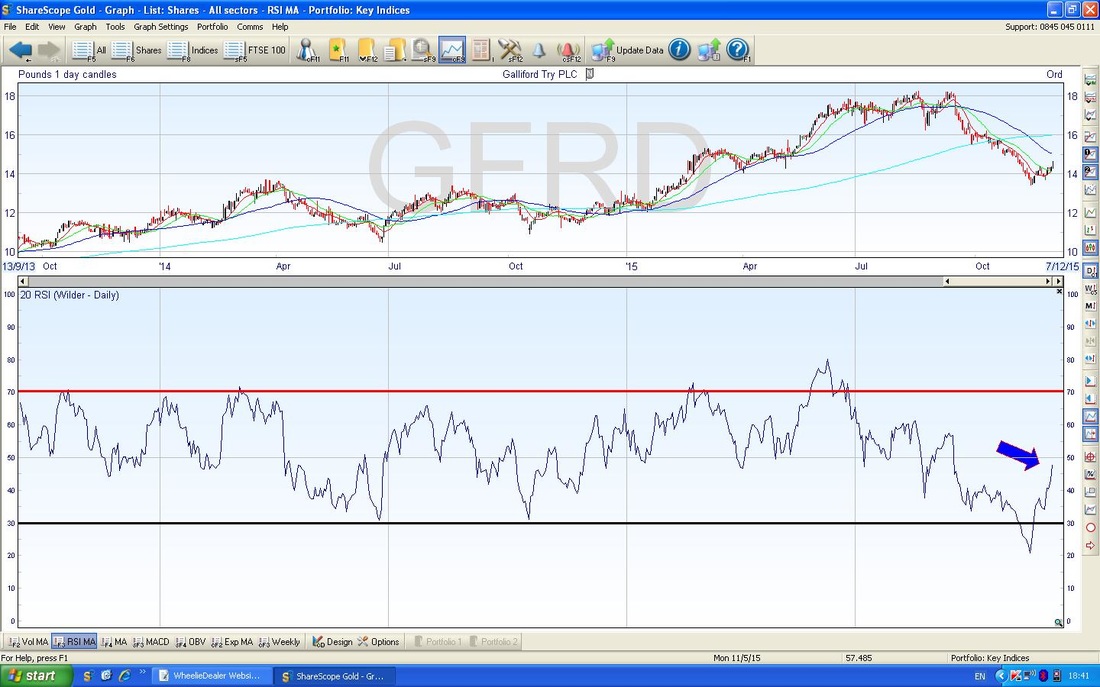
This is quite a difficult one because the Cyclicality of Housebuilders traditionally means they trade on quite low P/E Ratios. If GFRD was to trade on a Forward P/E of 12, then the Target Price would be 1816p. Interestingly, the recent Highs from September 2015 were 1825p ish - so perhaps to get back up here will do nicely. It’s a difficult call, I think a Target around 1800p is good enough for now and if and when it gets up near these levels, I will need to reassess the situation. It might be more of a time thing where I just dump before the Summer Slump. It is not inconceivable that if they can rise well in Q1, it might be possible to see 2000p or so. Technicals As usual, all the ShareScope Charts are as they were when I decided to Buy last night - so they are as per Monday 30th November 2015. The Chart below is a Long Termer (remember, always start with the Big Picture first) covering about 5 years or something. You should see a very nice clear Uptrend Channel and we are just coming up off the bottom Channel Line. It’s a powerful trend and clearly in the Bulls’ favour. 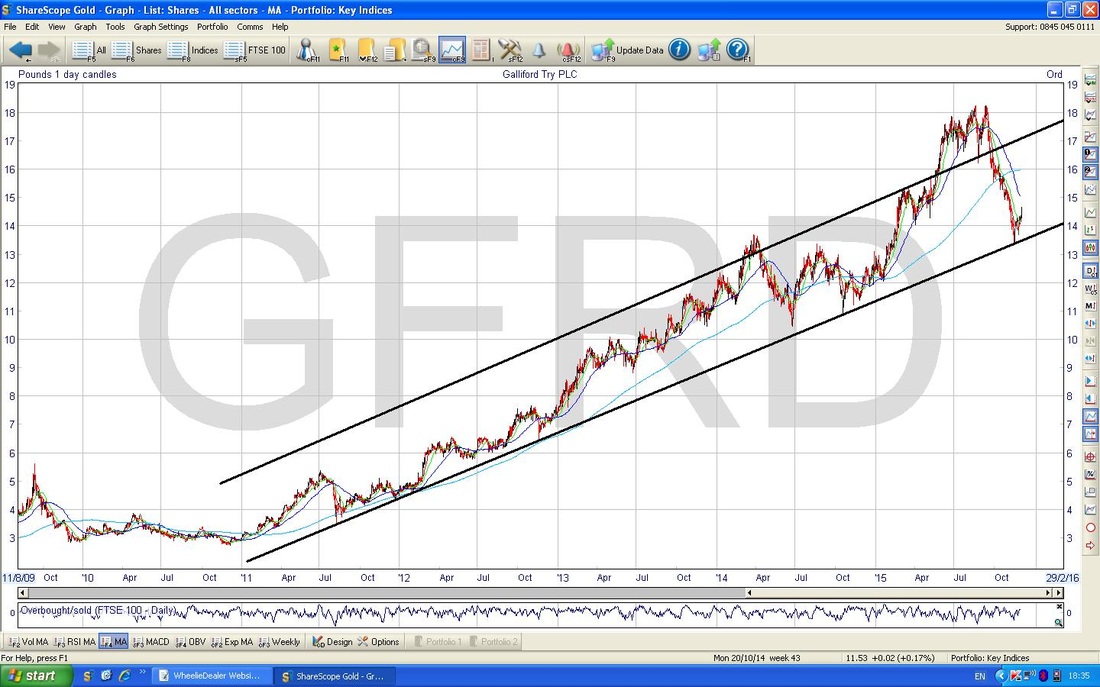
Regular Readers will know I love my ‘Breakouts’ - the Chart below zooms in a bit and you should see the Counter-Trend Channel which formed from about September up until now. My Green Arrow points out where the Price has Broken Out of the Downtrend Lines.
OK, I am a bit late here and it would have been better to have got in a week ago !!! The 50 Day Moving Average (dark blue wavy line) might be Resistance around 1500p or so and the lighter blue slower Line which is the 200 day Moving Average might be Resistance around 1600p. High Class Problem in both cases…… 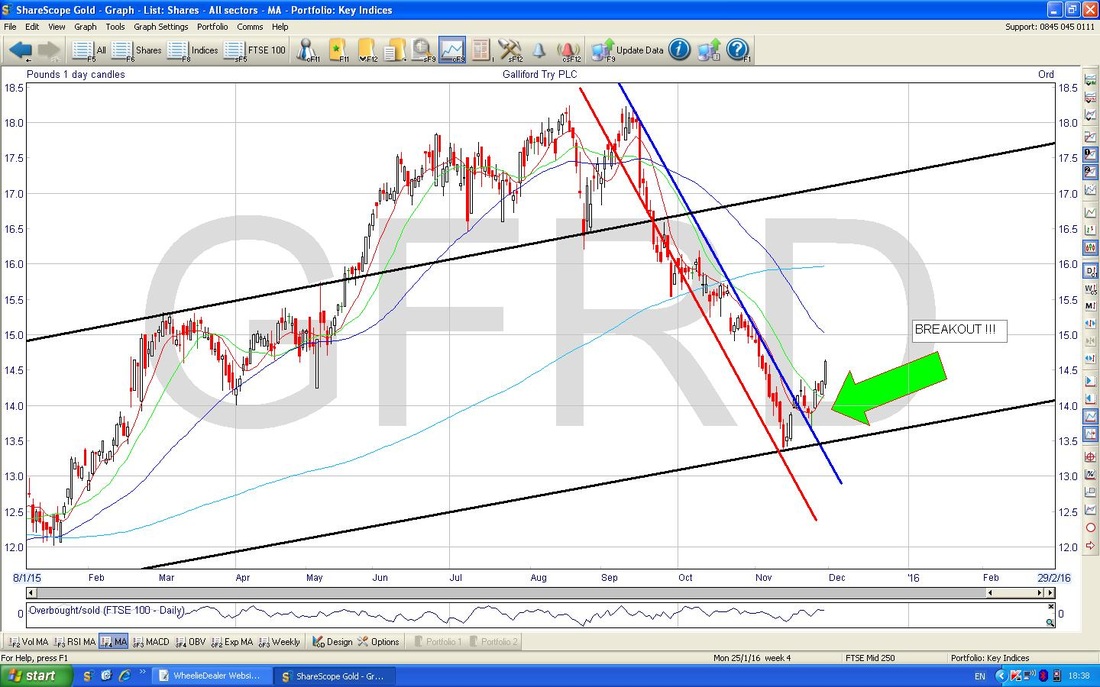
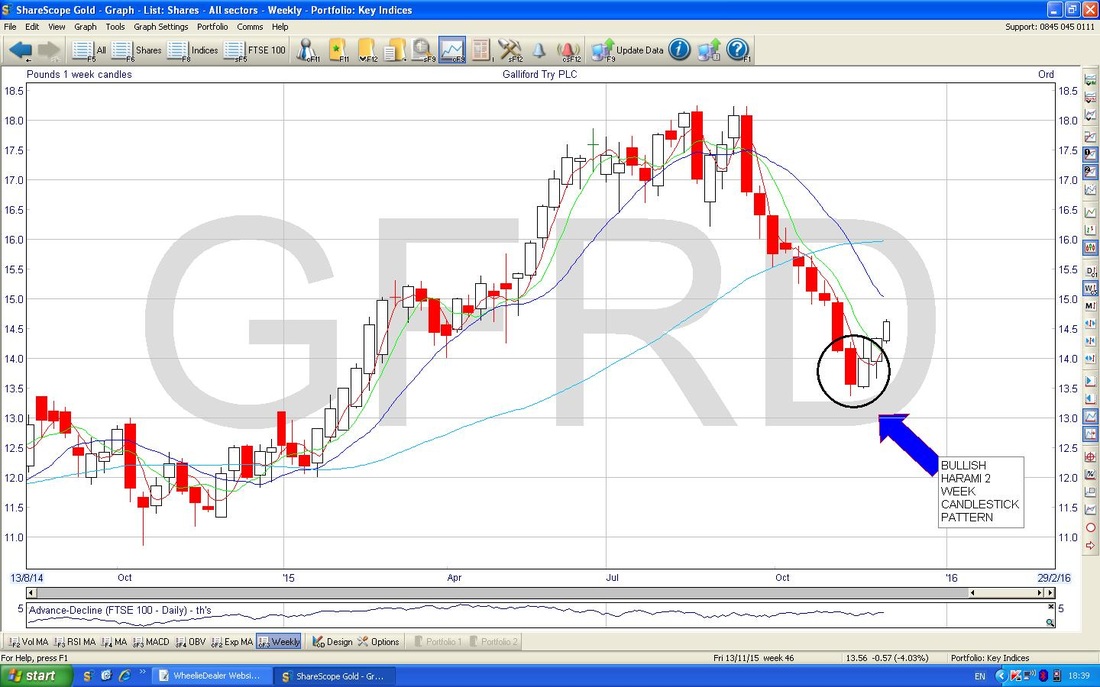
The Chart below shows the Weekly Candles - I have marked a Bullish Harami 2 day Pattern (the preggers woman one) with a black circle.
In the bottom window of the Chart below, please see the RSI (Relative Strength Index) - this shows the Price was very oversold just recently when it was around RSI 22 (usually RSI 30 is getting Oversold) and is now rising nicely and just under RSI 50 - so lots of room to go up and if it can pass through 50 that will be very good.
The Top Window in the Chart below shows the Bollinger Bands. The Price is up near the Top band and this might hold things up for a while - although it is quite normal for a Bullish Stock to hug the Line on the way up.
The Bottom Window shows there was a bullish MACD crossover about 2 weeks ago - I should have bought it then !! Right, that’s enough, I need some tucker, cheers, WD. 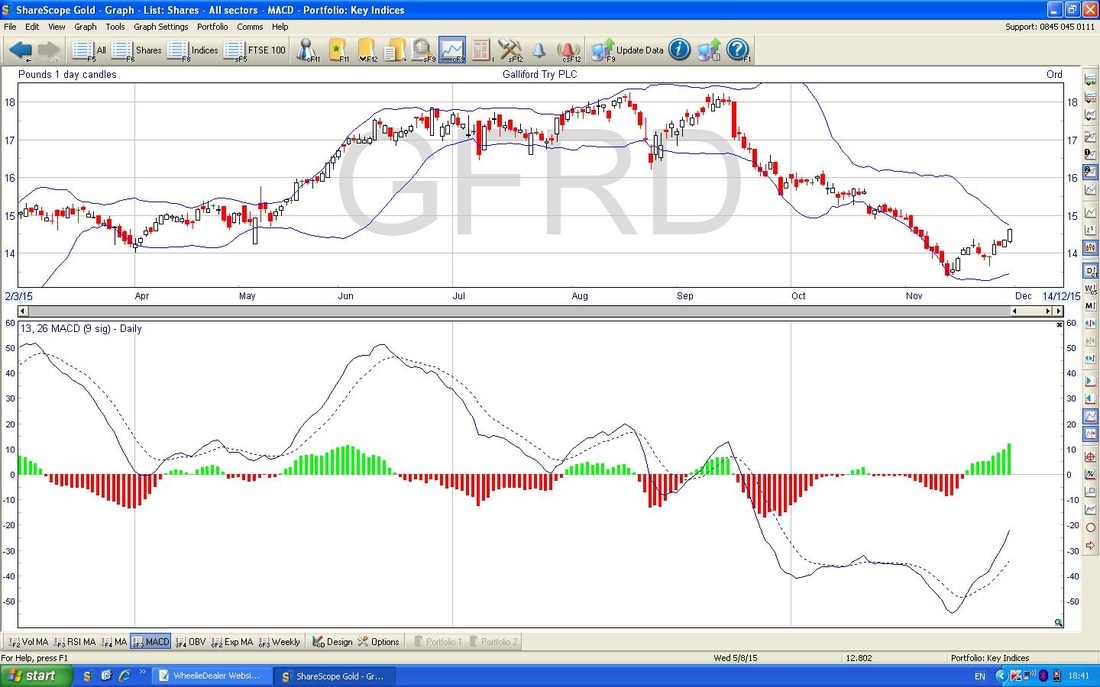
1 Comment
8/12/2015 01:23:44 pm
I am generally pretty Bullish on the Markets at the moment and I want to maximise the opportunity which I think exists. I have gone for an exposure of 3% to GFRD in my overall Total Portfolio Exposure - so no mucking about. Leave a Reply. |
'Educational' WheelieBlogsWelcome to my Educational Blog Page - I have another 'Stocks & Markets' Blog Page which you can access via a Button on the top of the Homepage. Archives
January 2021
Categories
All
Please see the Full Range of Book Ideas in Wheelie's Bookshop.
|
