|
THIS IS NOT A TIP. I AM NOT A TIPSTER. PLEASE DO YOUR OWN RESEARCH. PLEASE READ THE DISCLAIMER ON THE HOME PAGE OF MY WEBSITES. I am feeling a bit Blogged out, so I will try and keep this Short and Sweet - ok, I appreciate that is against my nature !! This morning I said “Goodbye, and thanks for all the Profits” to EZJ, for the following reasons:
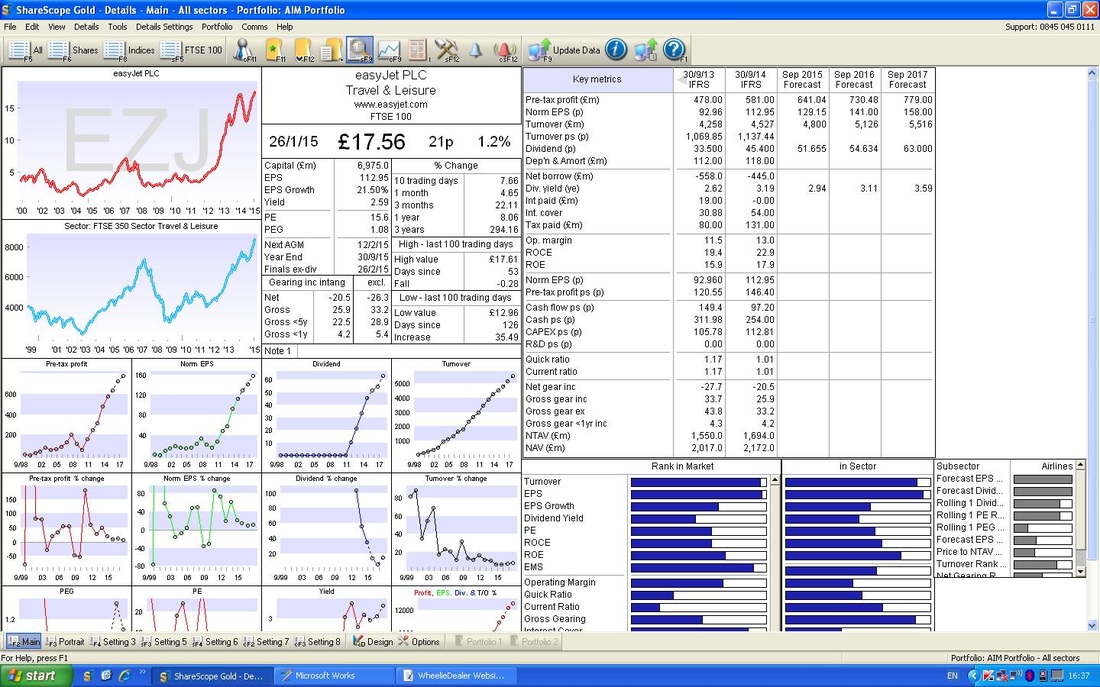
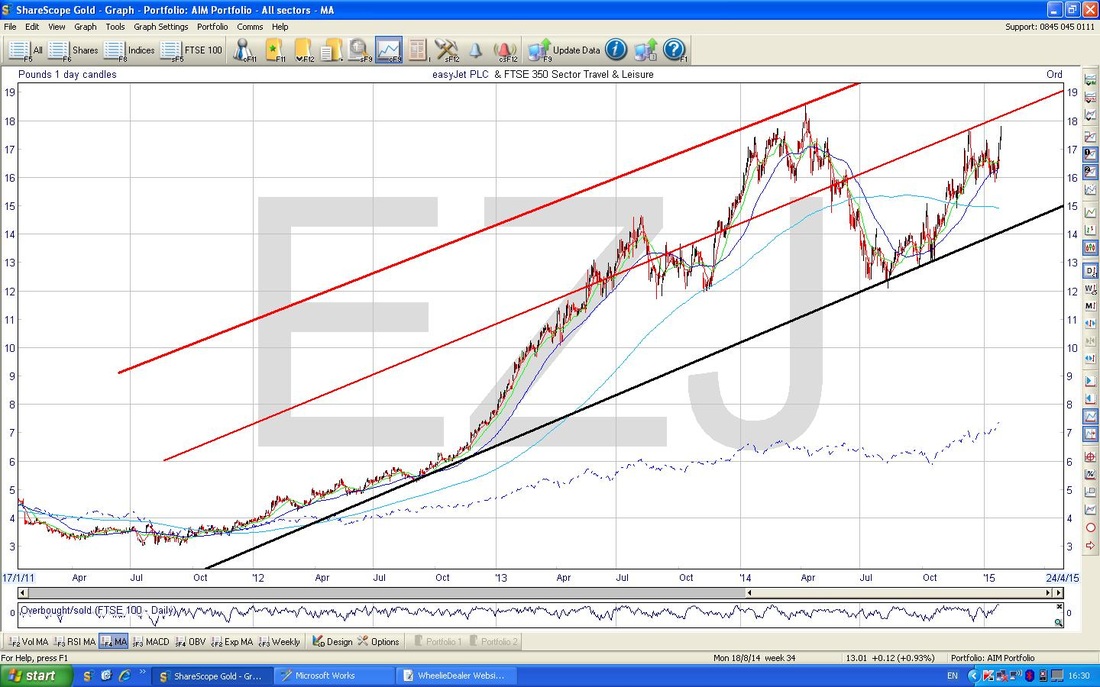
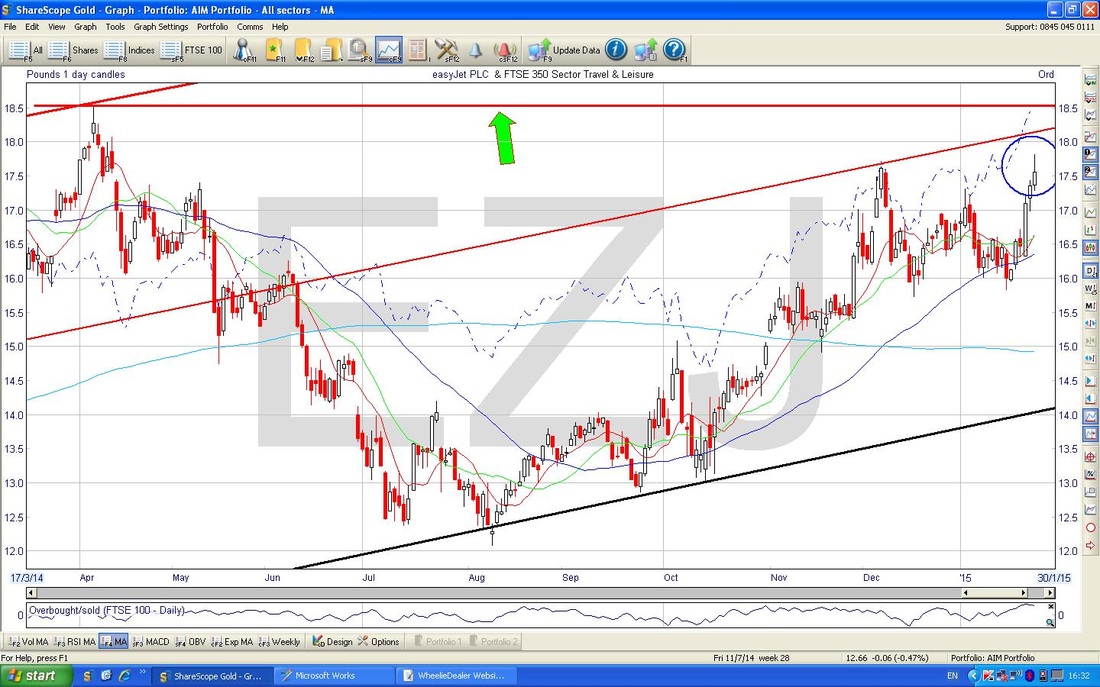
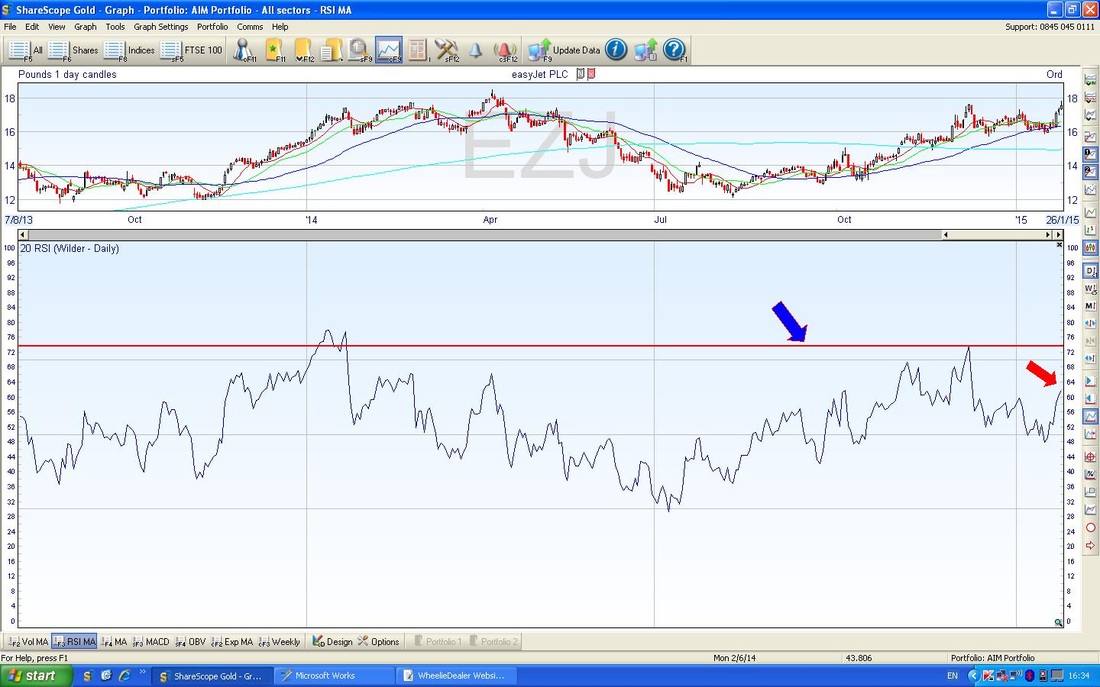
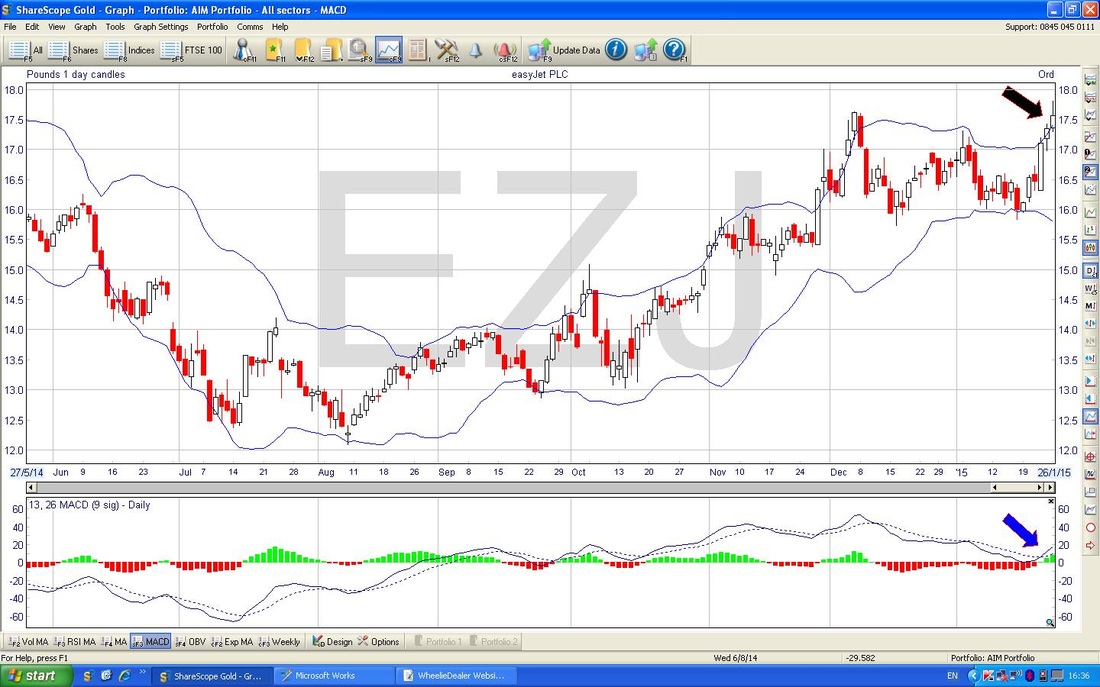
I still think it is a great company and I have added it to the WheelieWatchlist - I would love it if a good Entry Price arises over the Summer - at the moment I am not really keen to buy much at all. Valuation Shown below is the ‘Fundamentals’ screen from ShareScope that I looked at last night, when I made the decision that I would Sell my EZJ holding if the Results disappointed. In the event, the Results read very well, but it was interesting that the Price jumped up early on and very soon started to pull back from the All Time High at 1850p - this is Massive Resistance and it was obvious that Sellers (like me) would come in at this level. I hate making snap decisions during Trading Hours, but because I had already decided that it was time to sell, I hit the Sell button. If the Shares had jumped up and stayed strong, I might have held on - I was really looking for a Breakout from the 1850p level - the failure to achieve this makes me think they will struggle for a while. In fact, I would say they need some amazing News to get them up and through that level - seems unlikely that we will see such news for a while as they only just update the market. You will see from the Screen below, that the Broker Consensus EPS for 2016 is 141p. At a price of 1756p, this gave a Forward p/e ratio of 12.4 which does not seem too bad at all, especially when you consider the Cash they have as well. However, my view is that Airlines should never be on Top End p/e ratios due to their Cyclical and High Risk nature - On a very Long Term view, it is probably an OK buy but seems to be ignoring a lot of potential Risk. It is finely balanced to be honest, and for me, the bigger factor is the Resistance at 1850p. Note, I used 1756p as the Price for my forward p/e calculation - this was to show you the thought processes that I followed Last Night when I made the decision to Sell. At 1850p, the forward p/e would be 13.2. Technicals If you look at the Chart below, you will see a Lovely Uptrend Channel which I have marked with the Red and Black lines. You should be able to see that it is coming up to the Resistance of the Middle Red line - this will hinder it from more upside most likely. Remember these Charts are from Last Night (Monday 26th January 2015). The Chart below is a much shorter Time Frame and shows the Daily Candles more clearly. Note the Green Arrow pointing to the Horizontal Resistance at the All Time High (ATH) of 1850p and I have put a Blue Circle around the sort of ‘Hammer’ Doji Candle that was produced yesterday. The Pullback from the Intraday Highs is a Reversal Signal after the run-up in Price over recent days. It’s not strictly a great Hammer Candle - you would expect a smaller ‘Head’ to the Hammer, but that is the best description - it’s bad whatever you call it. By the way, if it can break the 1850p All Time Highs, then we have a Very Bullish situation and that would be a great time to Buy most likely. The chart below shows the RSI (Relative Strength Index) in the bottom window. It is reading about 62 where I have put the Red Arrow - this is not Overbought (70 is usually the kind of Overbought Level, but depends on the Asset). So this is not saying 'Sell'. Some conflict with the other Indicators I use. The Blue Arrow marks a sort of Resistance Level for the RSI - this is where it tends to turn down on EZJ - and the Share Price will fall with it, usually. It’s reading about 73 on the RSI. The Screen below has the Bollinger bands in the Top Window - I have marked with a Black Arrow that it has touched and even breached the Top Band. This is a sign it is getting Toppy - although Stock Prices often climb up these Bands, as happened for a few days in the past on this chart. The Blue Arrow in the Bottom Window shows that there was a recent MACD (Moving Average Convergence Divergence) crossover on the Bullish side - again, this is an Indicator that is giving a different message to some of the other stuff I look at. It is all about which Indicators give the earliest warnings - see my OPAY Buy Rationale Blogs for more details.
That’s it, shockingly short for a WD Blog, see ya, wheelie
0 Comments
Leave a Reply. |
'Educational' WheelieBlogsWelcome to my Educational Blog Page - I have another 'Stocks & Markets' Blog Page which you can access via a Button on the top of the Homepage. Archives
January 2021
Categories
All
Please see the Full Range of Book Ideas in Wheelie's Bookshop.
|


