|
THIS IS NOT A TIP. I AM NOT A TIPSTER. PLEASE DO YOUR OWN RESEARCH. PLEASE READ THE DISCLAIMER ON THE HOME PAGE OF MY WEBSITES. IF YOU COPY MY TRADES, YOU WILL PROBABLY LOSE MONEY.
You may have noticed that on Monday 10th August I bought more Boohoo.com BOO via a Spreadbet at 29.32p, equivalent in size to about 1% of my Portfolio Total Exposure. I already had about 1% in them as I bought in initially at about 45p and then at 52p back in September 2014. It was all working out nicely, until they did a Profit Warning and the Stock fell off its Perch.
Once I had stopped crying (geddit?), I did a cold hard assessment of the Stock and I still liked it and decided that there was no need to sell out and it could recover - especially if I helped it on its way with a sneaky ‘Average Down’ (Boo hiss - geddit?).
Back in June this year BOO put out a very positive Trading Update and things are clearly going nicely. This got me alert to the fact that it was now time to look for a Buy Signal to topup my holding and I have been patiently waiting. Anyway, I finally cracked and decided the picture was now good enough to Buy more as the Technical Section below will help show. Seeing as I am getting fat and lazy these days, I will not do a massively detailed Blog here - just the real meat that Readers like to see. Overview Boohoo.com is a pure Online Fashion Retailer - it has no physical Stores. In this sense, it is very reminiscent of ASOS (ASC), but is much smaller and is specifically focused on aggressively priced Clothes for 16 to 35 years olds and it Sells to over 100 Countries. BOO designs, sources, markets & sells own brand clothing, shoes and accessories. I like to think of BOO as ‘Primark over the Web’ - and it’s appeal is that it enables young fashionistas to buy ‘throw away’ clothes easily and cheaply. Something that got me interested in the first place was when my Cleaner told me about her young Daughters (aged about 21 and 18) who utterly adore BOO and shop online via their Fones all the time. The Company Website can be found here: http://www.boohooplc.com/ The Shopping Website is here: http://www.boohoo.com/ Key reasons to be bullish on BOO
Key Risks
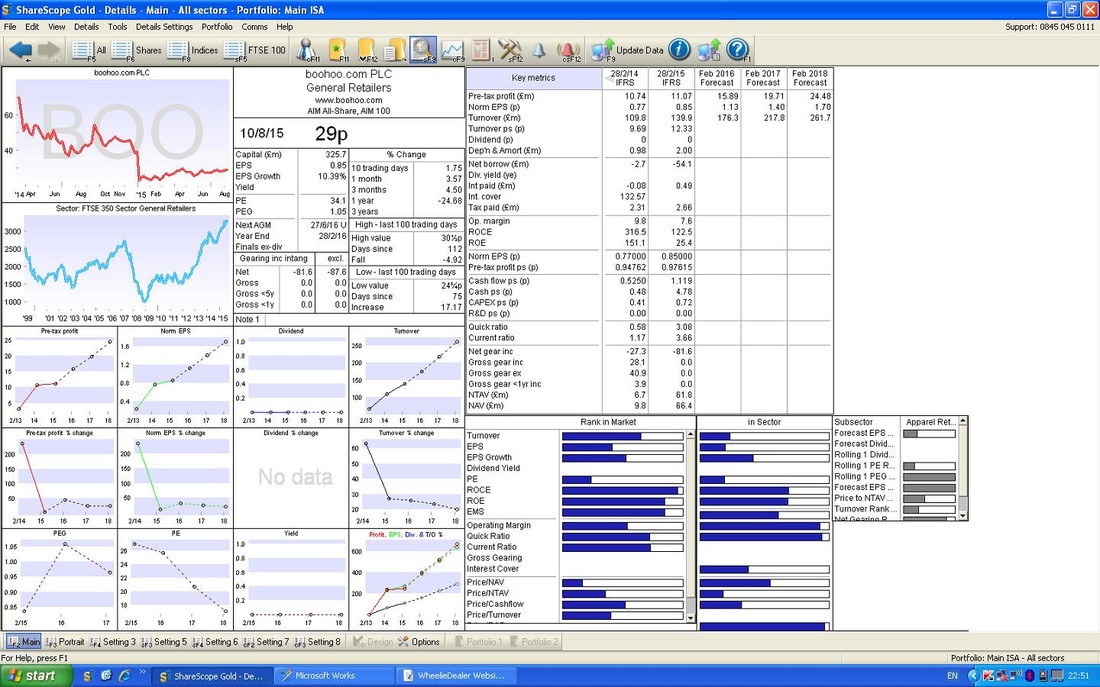
Valuation If you look at the ScreenShot from ShareScope below, in the Top Right Hand Corner you should see ‘Norm EPS (p)’ for ‘Feb 2017 Forecast’ is 1.4p. At my Buy Price of 29.32p, this gives a P/E Ratio of 21. On first glance, this will seem high, but remember there is very high growth here. However, if you look at the recent ‘Trading Update’ from 10th June 2015, you should see they have Cash of £58m. Against the Market Cap of £326m, this represents 17.8%, so we can effectively reduce the Price I paid by 17.8% to Value the Company appropriately for the Cash Pile. On this basis, 24p is the right Number to use, and the Forward P/E Ratio for 2017 now works out at 17 (24p divided by 1.4p). The recent Trading Update had Sales growing at 35%, but from some quick calculations I see that Forecast Pretax Profits are due to grow by 20% (this looks light, which makes me wonder if Management are being quite conservative with their Guidance Numbers after the problems they had shortly after the IPO when they issued the Profit Warning). Nevertheless, a Forward P/E of 17 ex Cash is fairly good value with Profits due to grow at 20%. In terms of a PEG Ratio this is 0.85 - you might recall that a PEG under 1.0 is generally seen as Cheap. There is no Dividend Forecast but with all that Cash it must be possible that the Company does a Special Dividend or something.
Targets
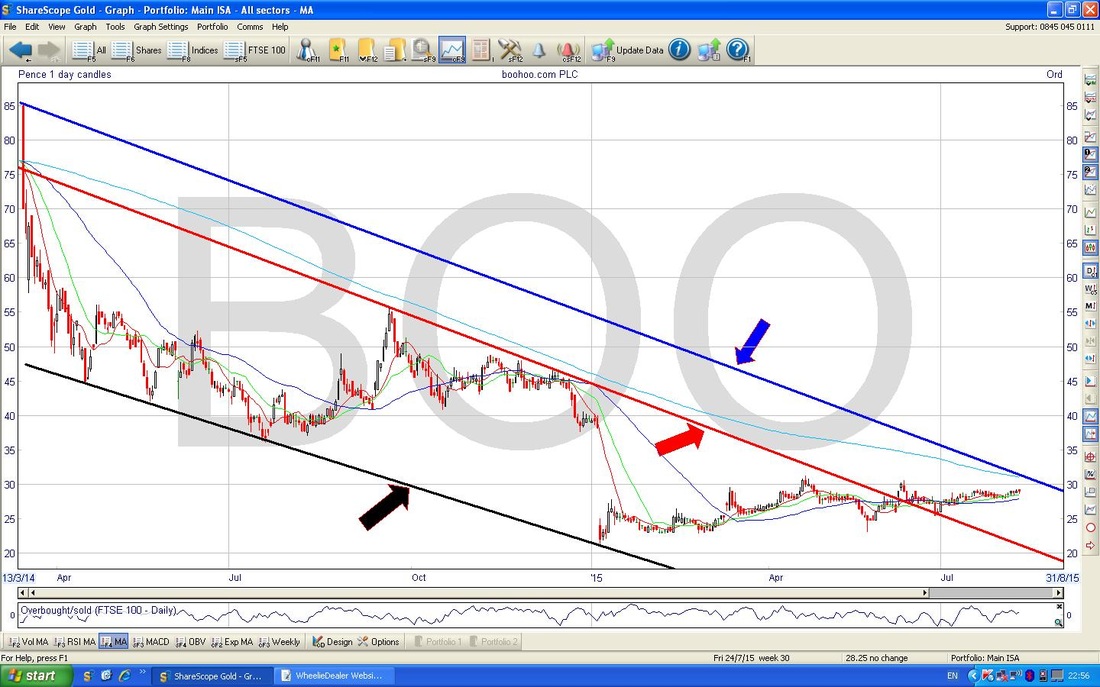
In terms of P/E Expansion, it seems possible to me that if BOO can consistently deliver on the Expectations it sets and can sustain a pretty high Growth Rate around 25% ish, a P/E of 25 is justifiable. On this basis, for Next Year 2017, a Target of 40p would be realistic (25 times 1.4p plus the 5p per Share of Cash). It we go forward a bit, it is not hard in a few years to imagine 2p of EPS (bear in mind that the Forecast number for 2018 is 1.7p, so it wouldn’t take much to hit 2p), on this basis, with a P/E of 25, we get a Target of 55p. But we could also get a little more excitable - if you look at the extremely high P/E ASOS (ASC) has always commanded (often as high as 80 !!), then maybe a P/E of 30 is possible for BOO. On 2p of EPS, this would give a Target of 65p. In terms of Chart based Targets, there is a gap to fill which runs up to 40p. After this, 55p would be next in the Sights and the All Time High on the Chart is from when BOO first listed and hit 85p. This is obviously a long way up and if it can get up to these heights then I would be very happy - I suspect this could be some years away though. Technicals As ever, let’s start with the Long Term which only actually covers the last 1.5 years or so because BOO has not been listed on the Stockmarket for all that long. As per usual, the Screenshots I have put in this Blog are all from the Evening of Sunday 10th August 2015 which is when I made my Decision to Buy more BOO. On the Chart below, I have drawn in a Downtrend Line in Black and marked it with a Black Arrow. This forms a sort of Bottom Line for the motion of the Share Price and there is a choice of 2 lines which are arguably both valid to mark a Topline to the Downtrend Channel. The first Red Line (marked with a Red Arrow) is by far the neater of the 2 options and to be honest it is the one I think is more valid. As you can see, the Red Line has several ‘touches’ of the Price Peaks and it neatly fits parallel to the bottom Black Line. The other Line is the Blue Line marked with the Blue Arrow. This one is far less neat as it does not actually touch any Peaks on the Price Chart - so it is of questionable value really. However, the Blue Line runs nicely Parallel to the bottom Black Line and it would be understandable if cautious Bulls waited for a Breakout of the Blue Line before buying in. I had decided from the Fundamentals Viewpoint that I wanted to buy more of the Stock and because the Red Line seems more valid, I am happy to buy on the Breakout from the Red Line. As you can see, the Breakout occurred many weeks ago and to be honest I was looking for a more purposeful Buy Signal - but nothing has been forthcoming until now.
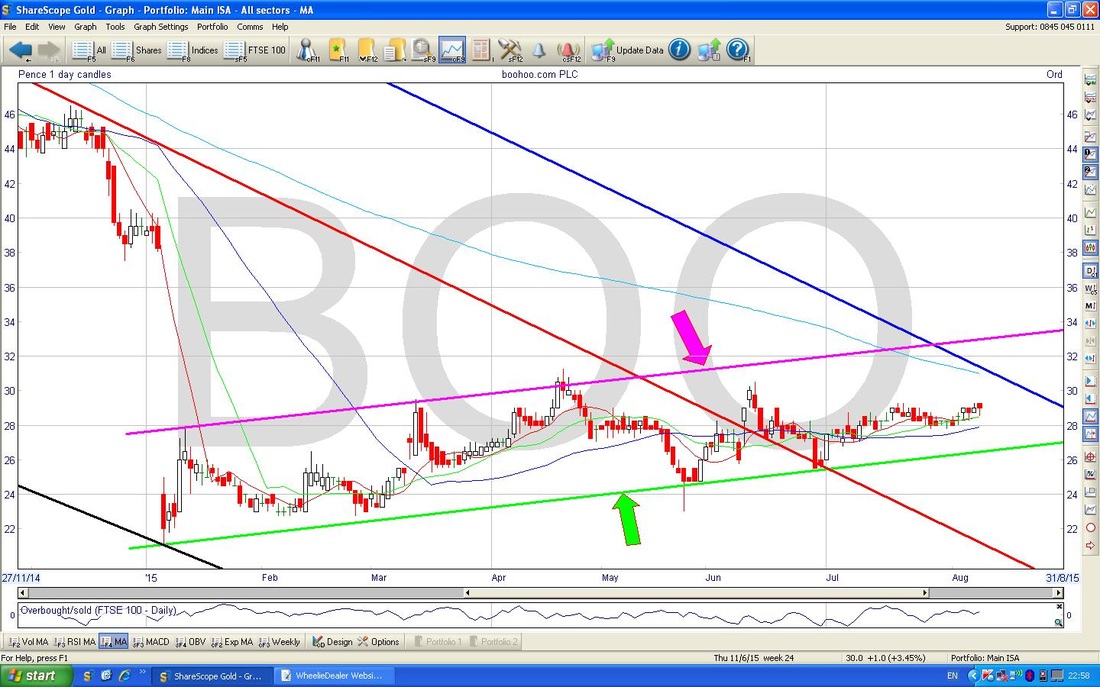
On the Chart below, I have zoomed in to really just 2015 and I have drawn in the Uptrend Lines for a Channel that has developed over this time. It is a ‘Slow’ Uptrend in that it is very shallow (almost flat !!) and the Price is just slowly grinding upwards.
For clarity, the Green Line with the Green Arrow shows the bottom line of the Uptrend Channel and the sort of Mauvey Line with the sort of Mauvey Arrow shows the topline of the Uptrend Channel.
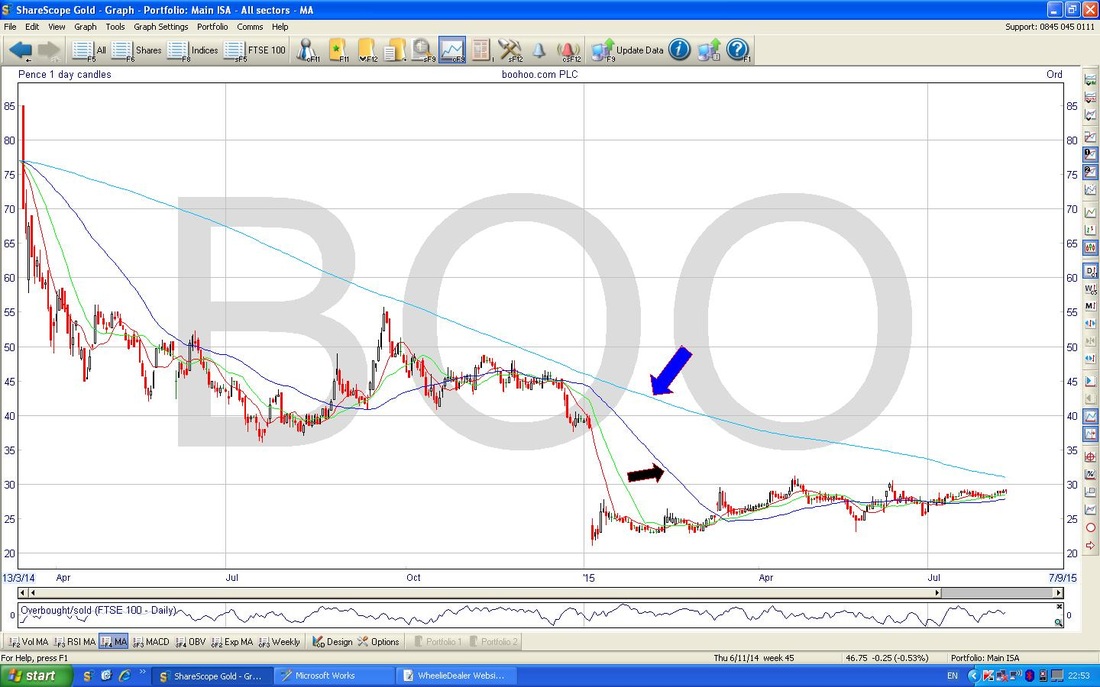
I have thrown in the Chart below to show how the Dark Blue Line of the 50 day Moving Average (marked with a Black Arrow) is coming up to the Lighter Blue Line of the 200 day Moving Average (marked with the Blue Arrow), from underneath and it looks like it could cross over and form a ‘Bullish Golden Cross’.
It is also worth noting that some Traders / Investors will be waiting for the Price to get above the 200 day Moving Average before they buy in to the Stock - this is because the 200 day MA can often act as Resistance and a breakthrough of this Line would mean it should then become a Support Level for further rises to build from.
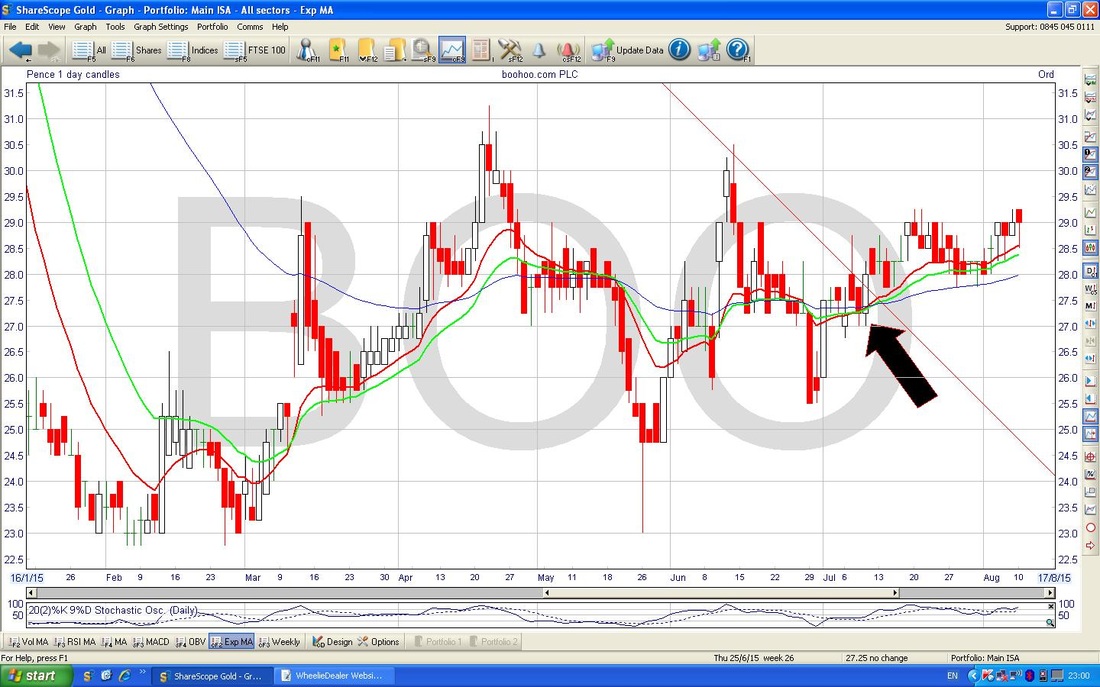
On the Chart below, I have zoomed in to the last 6 months or so, and the Black Arrow points out where the Red 13 day Exponential Moving Average (EMA) has crossed over the Green 21 day Exponential Moving Average - this is a good sign as it usually means the Stock will keep going up for a few weeks at least.
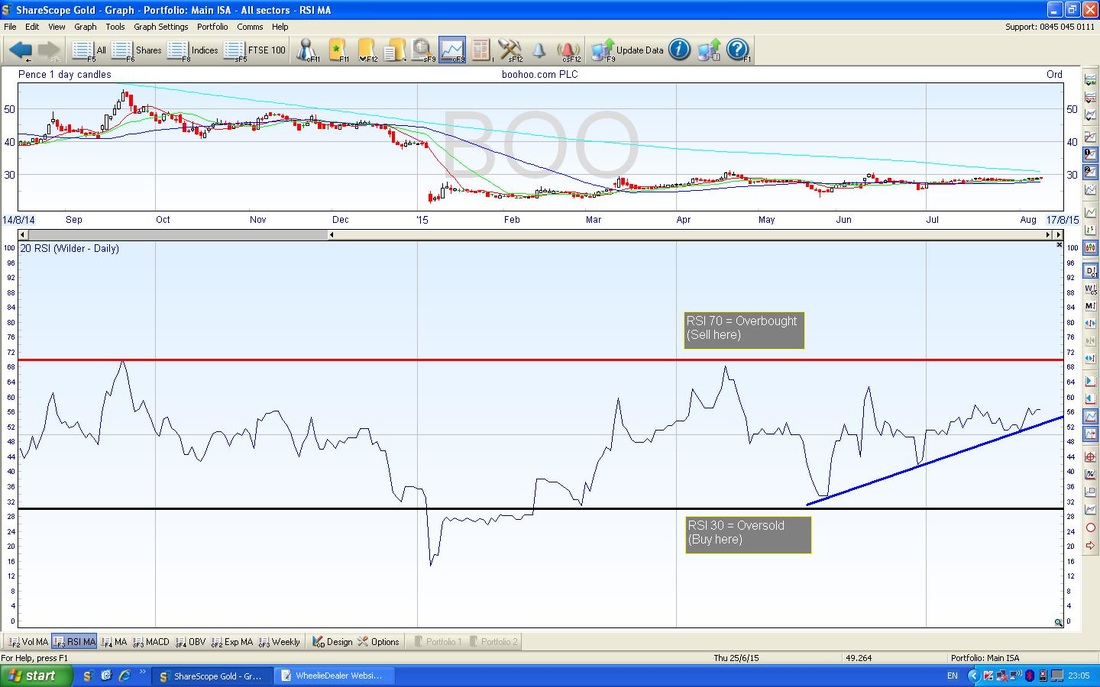
On the Chart below, please look at the bottom window which shows the RSI (Relative Strength Index) Indicator. Here I have marked the usual RSI 30 and RSI 70 Levels which are Oversold and Overbought respectively. You should be able to see that the RSI when I made my Buy Decision was up around 55 - so it has plenty of room to move up some more before getting Overbought and the Blue Sloping Line shows how the RSI has been trending up - this is good for Bulls.
I hope that helps explain my topup Buy, speak soon, wd
8 Comments
catflap
14/8/2015 11:53:17 am
A great post. Quite a lot to digest.
Reply
WheelieDealer
17/8/2015 02:46:30 pm
Hi catflap, thanks for the comments. You're right, weather seems to often be blamed for Profit Warnings from Fashion Stocks - although I do wonder sometimes if there is actually some other underlying reason but they would rather blame the weather !! It is certainly another Risk for Investors to weigh up - maybe BOO's ability to push out New Lines so fast can help mitigate against such problems - although or course it didn't in the Autumn !!
Reply
awhawh
15/8/2015 02:59:28 am
Great post. The only thing I disagree with is with one of your key risks (For instance, his Son runs other Websites which could be seen as competitors - this is not ideal !!). In fact if you look at the AIM admission document (http://www.boohooplc.com/~/media/Files/B/Boohoo/documents/prospectus/boohoocom-plc-final-admission-document-5-march-2014.pdf) section 15.6.1, BooHoo has the option to buy prettylittlething.com
Reply
WheelieDealer
17/8/2015 02:50:01 pm
Hi awhawh, thanks for your Comments - you are spot on, what I saw as a bit of a Risk could definately be an Opportunity as you suggest. The sort of 'Conflict of Interest' aspect of Father and Son is an issue people need to grapple with and weigh up - but as you say this could prove quite handy in the future.
Reply
andrewfmills
16/8/2015 02:38:44 am
Great article. FYI im pretty sure a share buy back was agreed at the AGM.
Reply
WheelieDealer
17/8/2015 02:53:17 pm
Hi andrewfmills - you're spot on, I hadn't seen this. I often find AGM details so dull that I pass over them quickly. According to a skim read, BOO now have been authorised to buy back up to 10% of the Shares - so that could be a helpful little boost to the Share Price once they start doing it.
Reply
ali haouas
22/8/2015 05:40:12 am
when you buy/add like here for boohoo- you use spreadbetting- is the rationale for addition still valid throuhg buing the shres on the market
Reply
WheelieDealer
24/8/2015 04:17:23 pm
Hi ali, yes you are right, my logic for buying the Spreadbet on BOO is exactly the same as with the Shares. I tend to buy a Share Position first and if it starts to move up I quickly add a Spreadbet sort of like a 'Mirror' position. If you click the Blog Category 'Spreadbetting' you can find a series on exactly how I use Spreadbets to create a 'Mirrored Portfolio' using Leverage. It's Risky so you need to understand it but a great way of boosting returns. Cheers WD
Reply
Leave a Reply. |
'Educational' WheelieBlogsWelcome to my Educational Blog Page - I have another 'Stocks & Markets' Blog Page which you can access via a Button on the top of the Homepage. Archives
January 2021
Categories
All
Please see the Full Range of Book Ideas in Wheelie's Bookshop.
|


