

|
educational blogs |
|
THIS IS NOT A TIP. I AM NOT A TIPSTER. PLEASE DO YOUR OWN RESEARCH. PLEASE READ THE DISCLAIMER ON THE HOME PAGE OF MY WEBSITES. IF YOU COPY MY TRADES, YOU WILL PROBABLY LOSE MONEY.
Observant Readers may have noticed I topped up on BAE Systems BA. via a Spreadbet at 453p earlier this morning (Thursday 1st October) to add to the other Spreadbet Position I already have and the normal Shares I have in both my Income Portfolio and in my Trading ISA (as per usual, check out my ‘Trades / Portfolios’ Page and you can see what stuff I am holding).
A large part of my thinking here is that with the recent General Market drops, I wanted to increase my Long Exposure a little bit but I can’t say that I feel super confident and gung ho about buying more stuff. So, on that basis, I wanted to buy something that was perhaps a bit defensive in case we get more downside and also something where there were good reasons to think it could rise. It feels to me like we could get a rise in the Markets in coming weeks and I want to play into this - obviously I have loads of Stocks already so I don’t need to go crazy with a Buying frenzy.
My Buy Case for BA. Was outlined in my earlier Blog here: http://wheeliedealer.weebly.com/blog/bae-systems-ba-buy-rationale And this has not really changed much. If anything, the situation has improved because the Middle East has gone utterly nuts and BA. just signed up a big Typhoon Deal. Risks The Risks are as per my previous Blog but I wanted to highlight a couple of things:
Valuation Again, the Value Case has not really changed much since my earlier Blog - I enclose the ShareScope ‘Details’ screenshot below and you can work out for yourselves that it’s on a Forward P/E of 11.9 for 2016 and a Forward Divvy Yield of 5% for 2016, on my Buy Price of 453p. 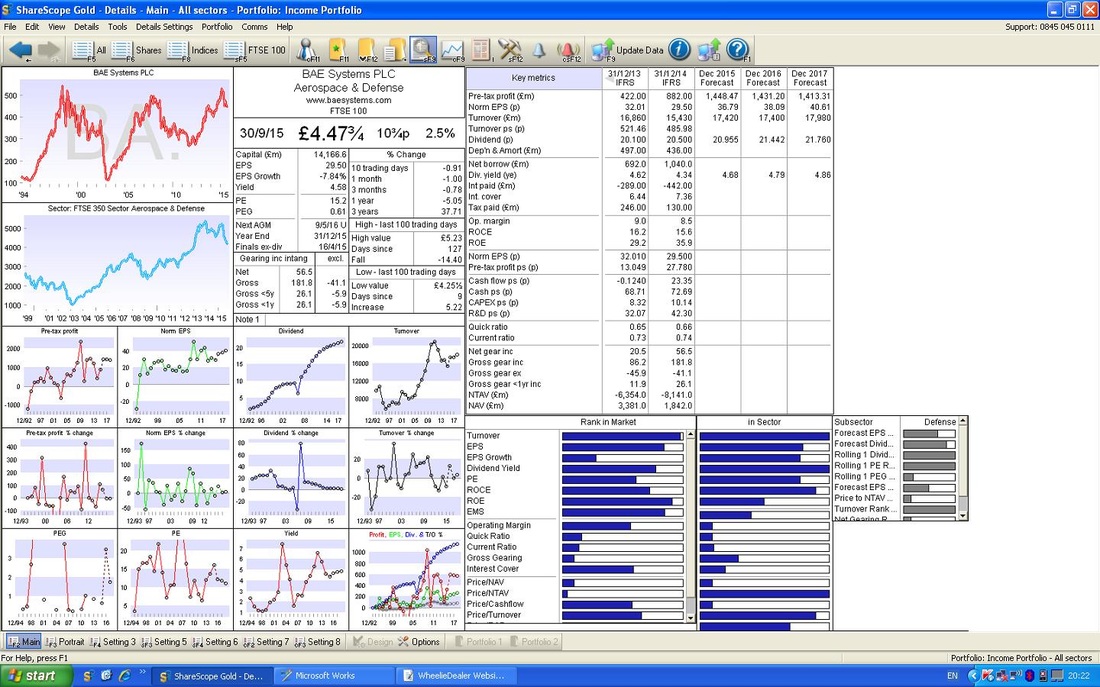
Technicals
All the screenshots are taken from the situation that confronted me when I decided to buy the Spreadbet last night. I have jumped the gun on this one - but rather than just relying on the Technicals to nail my timing, I have put a lot of weight on the Fundamental Drivers mentioned above and on the Value Case here with a Dividend Yield around 5% - this should provide a lot of Support to the Share Price as Income Buyers flood in if it drops much more. In addition, some of the technicals are giving very good buy signs. Remember, I am very much a Long Term Investor and as much as I like to time the Perfect Entry and Exit, sometimes I am happy to move a little bit out of sync as Stocks held for long periods of time nearly always make me money - and of course I pick up the Divvys as well. The Screen below shows a fairly Long Term Chart with about 4 Years in view. You should be able to see the clear Uptrend Channel marked by my 2 parallel Blue Lines and I have shoved in another Black Line which I have marked with a Black Arrow, which shows that the Price is still in a Downtrend short term. On this basis I have bought in too early and more patient Buyers would wait for the Black Line to be broken out of. 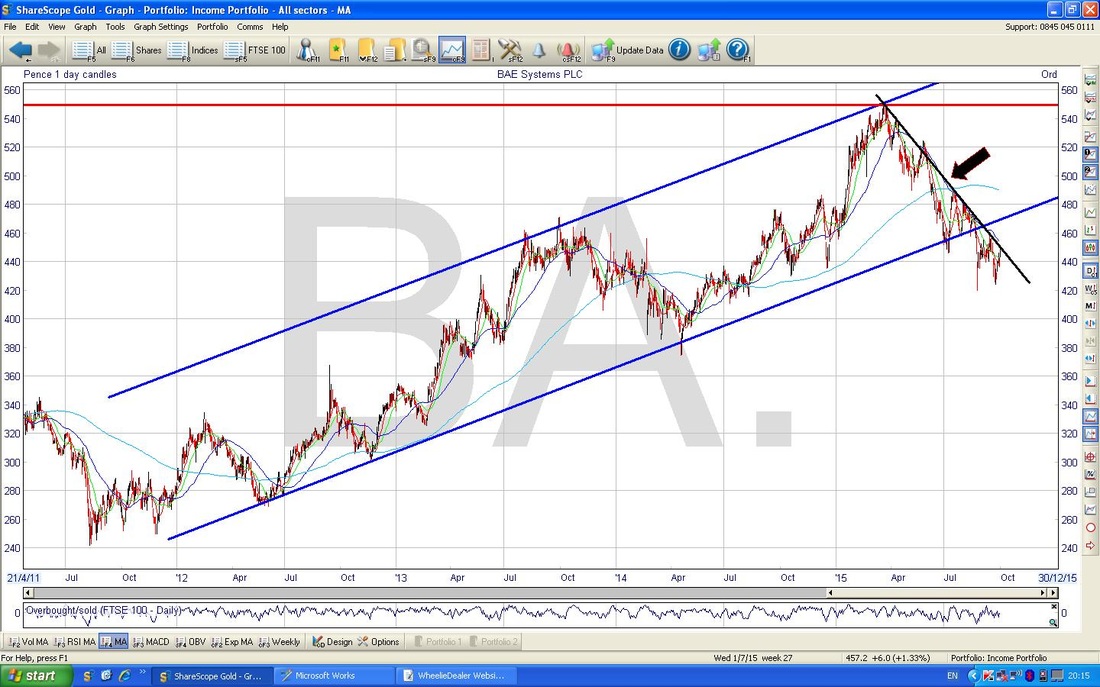
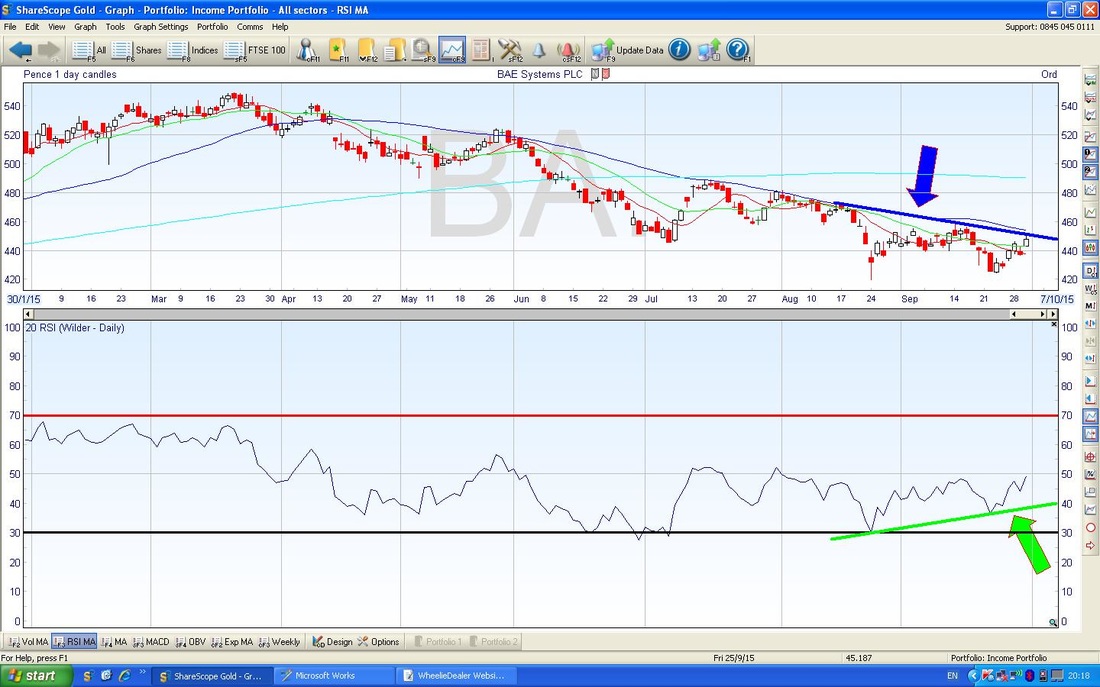
The Screen below shows the Relative Strength Index (RSI) in the Bottom Window. What I want to show here is the ‘Bullish Divergence’ that has developed as the Green Line I have marked with the Green Arrow is diverging from the Blue Line (marked with a Blue Arrow) in the Top Window. This is good for Bulls often.
The Screen below shows the Bollinger Bands in the top Window - my Green Arrow points to how the Price has moved up off the Bottom Band (thin Blue Line) and is now moving upwards towards the Top Band.
In the Bottom Window, my Blue Arrow marks how the MACD Histograms (Moving Average Convergence Divergence) have gone Green and Positive (i.e. Bullish) and the Black Arrow shows where the MACD Signal Lines have crossed in a Bullish Way (these are just representations of the same thing). 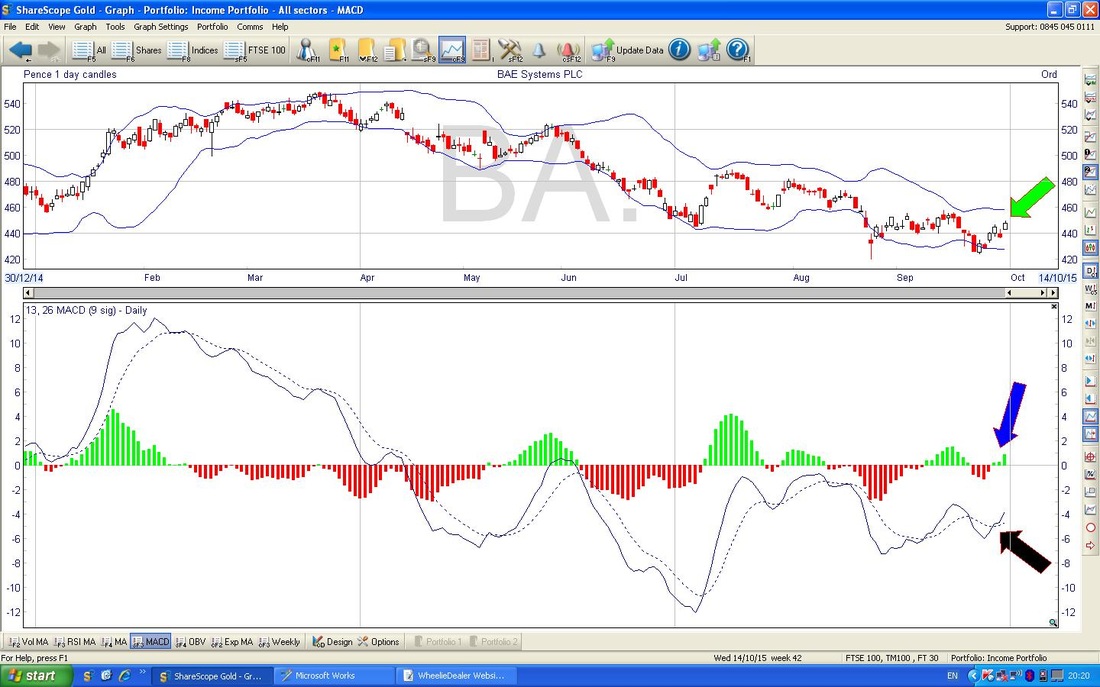
The Screen below shows the Weekly Candles. Obviously the Week was nowhere near complete when I made my Buy Decision last night, but things were shaping up quite nicely. My Blue Arrow is pointing to a Hammer Candle which should mark a Reversal of Trend and the Price can most likely move up from here. The White Candle following the Hammer is for this week so far and if we can get a nice Big White Up Candle that would be real bullish.
I have shown the Black Downtrend Line here very clearly - as I said earlier, it would be best to wait for this to break perhaps. However, you cut it, there is Strong Support at 420p. That’s it - my goodness that was unusually short for a WheelieBlog !!, see yous, WD. 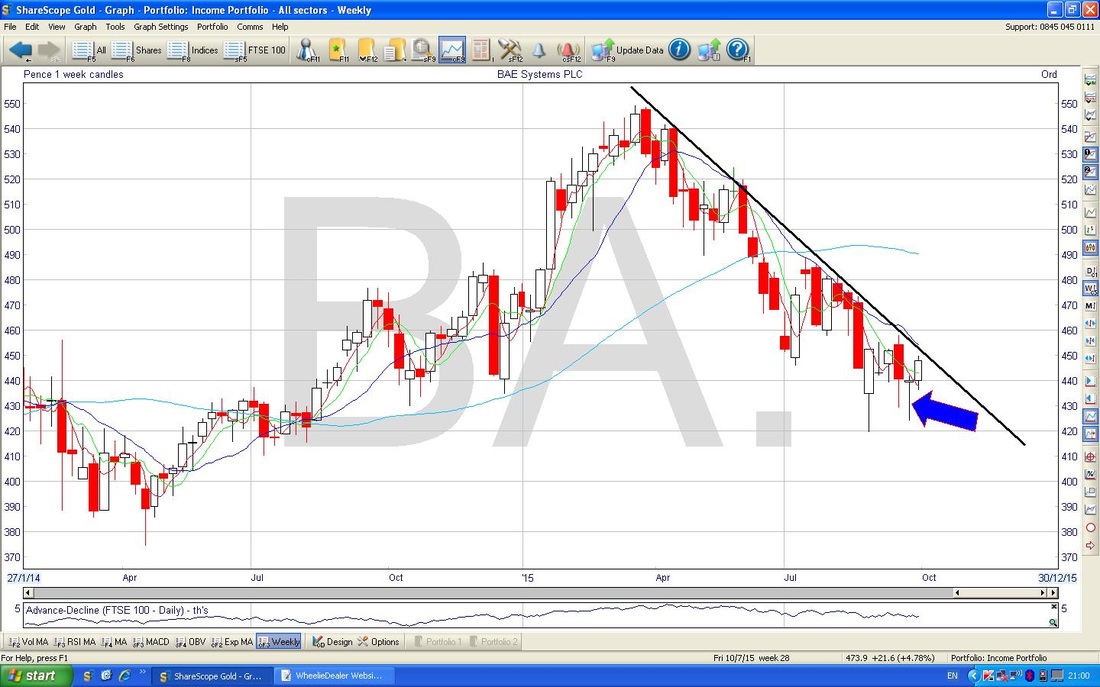
2 Comments
catflap
1/10/2015 10:17:11 pm
Thanks for this informative post.
WheelieDealer
3/10/2015 12:10:36 am
Hi Catflap, thanks again for your thoughts. As you say, it looks a very good play for Income and the downside seems fairly limited. Sadly, the World will always be spending daft amounts of Cash on Weaponry cos Humans are a bit nuts on the whole !! Leave a Reply. |
'Educational' WheelieBlogsWelcome to my Educational Blog Page - I have another 'Stocks & Markets' Blog Page which you can access via a Button on the top of the Homepage. Archives
January 2021
Categories
All
Please see the Full Range of Book Ideas in Wheelie's Bookshop.
|
