|
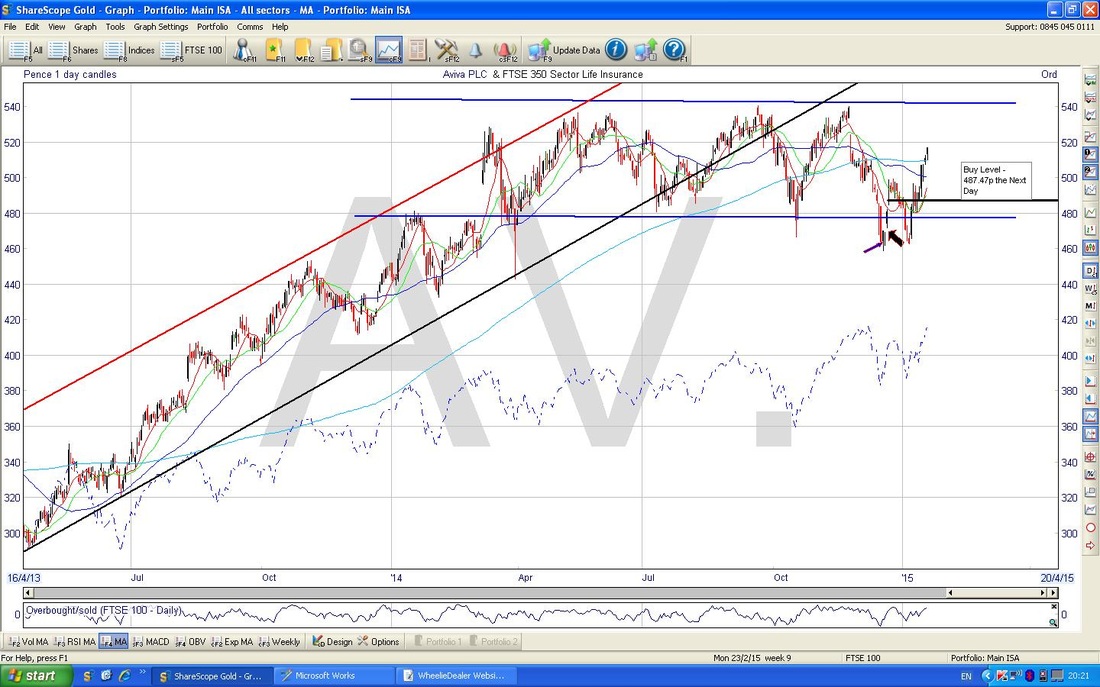
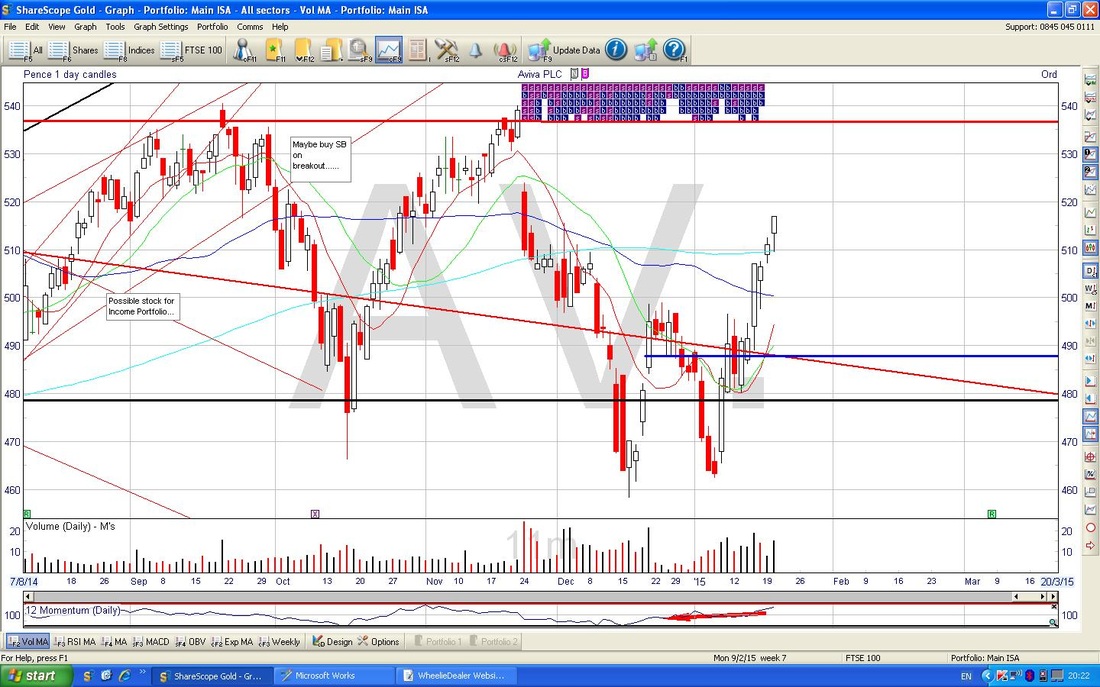
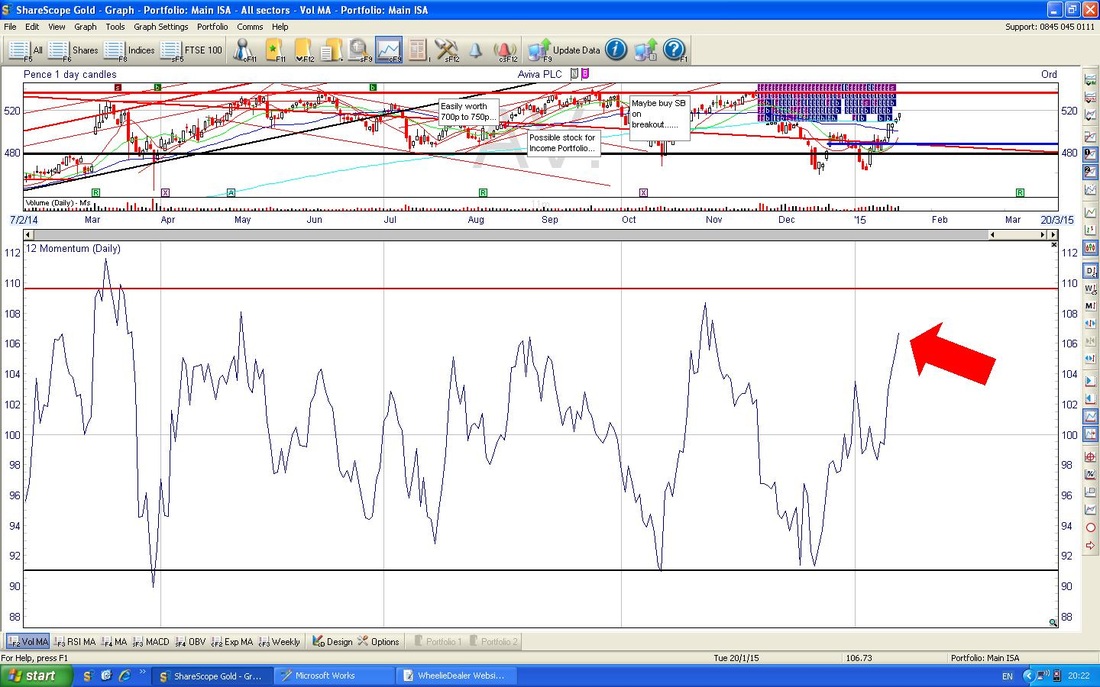
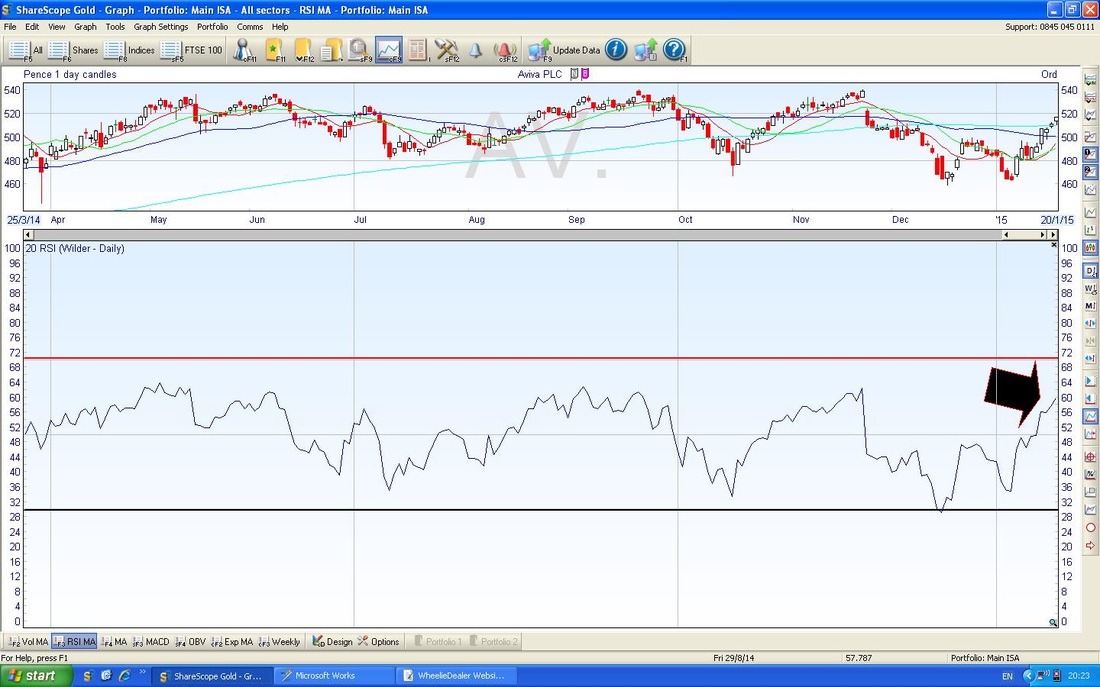
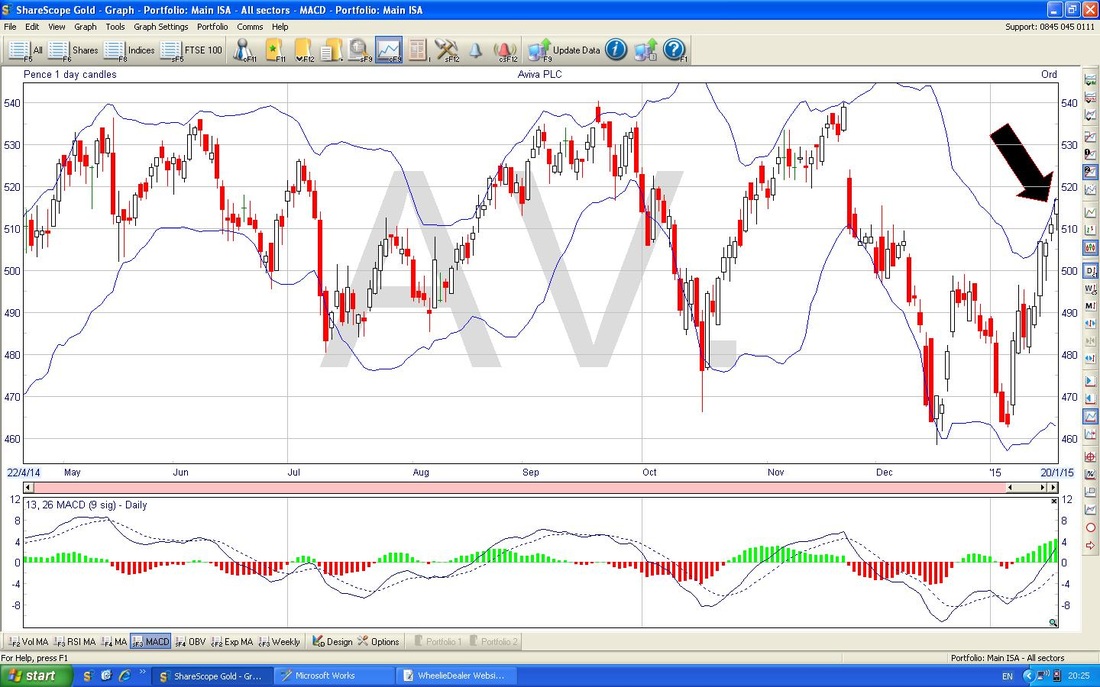
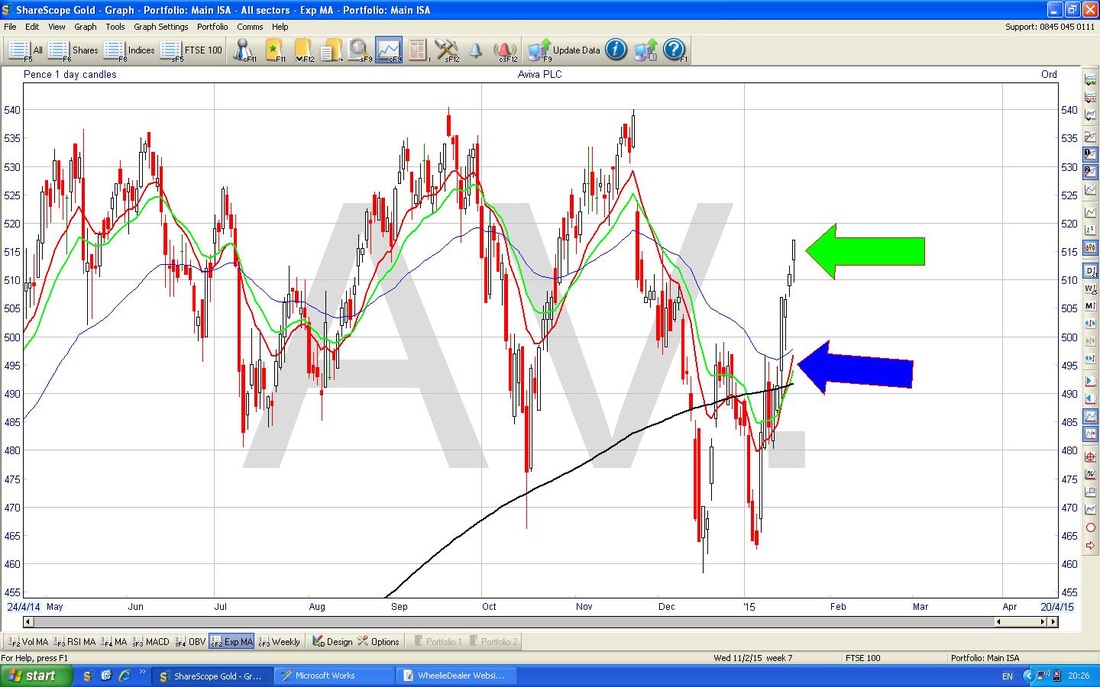
THIS IS NOT A TIP. I AM NOT A TIPSTER. PLEASE DO YOUR OWN RESEARCH. PLEASE READ THE DISCLAIMER ON THE HOME PAGE OF MY WEBSITES. If you follow my Twitter Feed and look at the Changes List on the Homepage of my Main Website, you will hopefully have noticed that I sold all of my Spreadbet Positions on Aviva AV. this morning at 519p. This was a Spreadbet Price - the Price in the Normal Shares Market was about 521p at the time - the ‘Spread’ on a Spreadbet is wider for many reasons which I will explain in a future Blog - if you cannot wait, then Robbie Burn’s Naked Trader 4 Book has a Section on Spreadbetting that explains it all very well. I banked about 0.5% of my Total Portfolio Value on the trade so it was ok, but nothing special. On the recent buy from roughly 3 weeks ago I made 6% on the ‘Exposure’ and on the other position which I have held since October 2013 (a long time !!) I made 20%. Of course, because these are Leveraged I actually made a lot more than that as a Percentage of my Capital Employed - probably near 100% but I have not worked it out yet. I really missed a trick here, I should have chopped out the October 2013 Position earlier, but of course I am speaking with Hindsight Bias now and in reality it may have been less clear at previous times - and I most likely expected AV. to go much higher faster - as I still expect it to eventually do. As you will see from the Technical Section below, it is stuck in a Range now. The point I am trying to make is that maybe I could have traded that Range earlier - Hindsight Bias though……… It may be an idea to look under the ‘Category’ ‘Buy Rationale’ on this Blog Page for the recent AV. buy Blog if you have not read it or fancy a reminder. This is just a fairly quick Blog to give some reasoning behind why I made this decision - apart from giving you delightful Readers a view of my thinking, it is also a great discipline for me to undertake this exercise. Fundamental Reasons for the Sell OK, this is really a mix of some Fundamental Reasons and an explanation of some Technical aspects that are around the markets and my Portfolio Management at the moment, although they sort of have a Fundamental flavour as well. The key driver is that I am starting to get the view that Markets have got a bit ‘tired’ on the way up and we could see a move down soon. This Week so far (I am typing this on Wednesday night, although my Sell Decision was made on Tuesday night) has been pretty good as the Market is of the Opinion that the European Central Bank (ECB) will announce a Quantitative Easing (QE) Programme on Thursday. But this likely QE has been so well flagged by Super Mario and the Politicians etc. that there can be no one who is unaware of this - and I suspect that when it finally gets announced tomorrow, there is a fair chance the markets will fall. This would be a classic example of “it’s better to travel, than to arrive” or “buy on the Rumour, sell on the Fact”. For the markets to continue higher, we would probably need something utterly surprising like a QE Programme that is much larger than current expectations - however, this seems pretty unlikely as expectations seem very heightened. Anyway, if we did get such an Upside Surprise, I doubt it could last as markets have run up and of course there is the Greek Election on Sunday (where the Left Wing, Anti-Austerity, Party, Syriza could be the Winner). It is easy to envisage a situation where many Market Participants would want to reduce their Risk going into the Weekend - so we could get a poor end to the Week - who can tell for certain? Of course no one can know 100% what will happen, so I feel that the best I can do is just lighten up a little and make sure I am prepared for any drop. It is important to think in this way - our Portfolios must always be resilient for whatever circumstances can arise. It is not good having a High Risk Portfolio of a few Small Cap Stocks if an unforeseen event occurs (terrorism?) and you get totally wiped out in minutes. This is why spreading Risk by Diversification across many aspects (Stock size, Industry, Geography, Defensives or Cyclicals, Value or Growth etc.) is vital. I do feel that even my Portfolio would suffer in a Black Swan event, but my wide spread may save me a little bit. For example, the Credit Crunch was nasty but I lived to fight another day whereas many ‘Investors’ got wiped out. With my normal Shares this is not an issue really - of course it is best to Topslice and even put a Hedge on using a Short FTSE100 ETF like XUKS - however, I don’t tend to get too hung up on this with my Long Term Portfolios. They go up, they go down. It happens. Deal with it. However, Spreadbets are a bit different. The simple fact is that when you have a Long Portfolio of Spreadbet Positions like I do, a certain amount of my money is tied up as ‘Deposit’ or ‘Margin’ and I have to have this to keep the Positions open. Alongside this, I have a Cash amount that moves up and down as the Markets wiggle around. If my Stocks do well and go up, then my Deposit figure rises a bit but the Cash figure soars up fast - at some point in the future, I intend to do a Blog on Spreadbetting but it is some months away probably. If things go against me, and my Stocks fall, then the Deposit figure reduces slowly but the Cash figure just evaporates - it can be quite nasty if you have Too Much Exposure and if you have insufficient Cash. If this happens, then igIndex will be on the Phone to me asking for more Cash - a Margin Call. I have the Cash, but I do not want to use it unless I have to. Therefore, when my Stocks are going well, all is rosy and happiness abounds, but if times are tough, then I have to be fully in control of my Deposit and Cash figures and make sure I have things managed. The best way to do this is to make sure that when Markets are a bit toppy, I reduce my Exposure to some extent - but it is the usual ‘Art’ form of deciding what stuff to chop - obviously it is a nightmare it you chop stuff and then it keeps soaring up - but that is how the Markets go sometimes, you will never be right every time and most times probably get it wrong with your precise timing. But it is better to be Roughly Right than 100% Wrong. My preferred method when things are going well is to Sell some holdings into the Rally and then to place a FTSE100 Short Spreadbet to ‘Hedge’ my Long Spreadbet Holdings. This can work very well, but timing is key. Obviously as the Markets fall, and my Long Positions probably drop, the FTSE100 Short will gain Cash to offset the losses on the Long Positions. Apologies if that makes no sense, but it is quite complicated if you have never done Spreadbetting or Contracts for Difference (CFDs) before. By selling a Spreadbet Long Position, I reduce the overall ‘Exposure’ to the Markets and I free up the Deposit that would be used to keep the Long Position open. In this case, I freed up a fair bit of Cash by Selling Aviva and reduced exposure by probably about 3% over all my Spreadbet Positions - obviously I would like to reduce it more. Of course, one great side effect of this Blog is that it might make Readers appreciate just how Dangerous Spreadbetting can be - and any other form of Leverage for that matter - it is all pretty complex for the uninitiated. Anyway, the upshot of all that is that even though I think AV. is a cracking Stock and a great Company run by a superb new CEO, I need to chop some Positions and AV. was an obvious candidate for the Technical Reasons which will show up below. I stress this point - I still have my normal AV. shares - I will not be selling those and I expect to be buying an AV. Spreadbet again when I think the time is right. Technical Analysis Factors As usual, I was ‘plonking’ through my ShareScope Charts last night (I call it ‘Plonking’ as I just have to ‘Plonk’ the Space Bar and ShareScope cycles from one Stock’s Chart on to the next one). As I was doing this, I was aware that I was looking for Stocks to trim or to Sell entirely (if you have been following my Blogs you may know that I am keen to reduce my Number of Holdings as I have far too many). I try to make my Buy or Sell decisions in the Evening when the Markets are closed - this reduces a lot of Emotion (think Fear and Greed) that can influence decisions made during the Trading Day as prices swing to and fro - I like to keep things as Spock - like as possible and cut out Emotion. That is the beauty of Charts, they are reasonably objective and numbers based. “Trade what you SEE, not what you FEEL.” AV. stood out for a trim for the following reasons - remember these Charts are from last night (Tuesday). I have pasted in the Key Charts with short explanations of what made me feel it was toppy: In the Chart below, you can clearly see the ‘Range’ nature of the Stock at the moment, the Bottom is around 480p and the Top is around 540p. These levels are marked by the horizontal Blue Lines. Unfortunately it is rare that the Price moves exactly within these levels and sometimes (like I did today) you will Sell a bit early - but it is a fact of life really. If you look back a bit to your Left, you will see that the Share Price struggled (met Resistance) around the current level previously. The Chart below I have just put in here to show you how strong the Price had been in recent days - it looks ‘overstretched’ after such a powerful move up - too far, too fast. On the Chart below, ignore the mess in the Top Window - I have just closed it up to show you the Bottom one. This shows the ‘Momentum’ Chart and you can see that it is right up near the Top of where it normally goes. If you have read my epic Technical Analysis Blogs on OPAY (and survived !!) then you might appreciate that Momentum is one of the ‘Timeliest’ Indicators that a Stock Price might be getting Overbought (or even Oversold at the other end). Remember the HOT (Hierarchy of Timeliness) guff?………… In the Chart below, you can see the RSI (Relative Strength Index) Chart in the bottom window - ignore the Top one really. As you can see where I have put the Black Arrow - it is not totally Overbought (this would be 70 or so on the Axis) but it is reading about 60 and crucially this is where previous moves have turned down - look to the Left and you will see what I mean hopefully. The Next Chart below shows the Bollinger Bands in the Top Window. My Black Arrow is pointing at how the Share Price has touched the Top Bollinger Band (blue wiggly thing) and I think it is likely that it will drop from here soon - although Prices can ‘hug’ these bands for a while. This Chart below is really of the Exponential Moving Averages (EMAs) - but I am not really showing you it for that reason. Please just look at the Green and Blue Arrows - what I am trying to point out is that there is a big gap between the Points of the two Arrows - if you look at the Graph to the Left, you will see that when the Price gets this far away from the Red and Green wiggly lines (13 day and 21 day EMAs), it tends to drop. I hope that helps you understand the thinking (if there was any) behind my Topslicing decision.
Happy Hunting !! wd
0 Comments
Leave a Reply. |
'Educational' WheelieBlogsWelcome to my Educational Blog Page - I have another 'Stocks & Markets' Blog Page which you can access via a Button on the top of the Homepage. Archives
January 2021
Categories
All
Please see the Full Range of Book Ideas in Wheelie's Bookshop.
|


