

|
educational blogs |
|
Baba O’Reilly, I just realised it is precisely and accurately 1 solitary week to Xmas - crazy how that has crept up so fast this year and we are now on the final run-in to close out 2016 (I hope fans of The Who loved that start !!. Talking of which, I watched the Hyde Park gig from 2015 on Sky Arts Friday night and got to admit they were really on song [Pure & Easy] - I saw some 2016 stuff and felt that Roger was starting to show his age so I suspect that Hyde Park one is probably the last great gig they will do - worth watching if you can, probably on DVD or something.)
I have not really liked 2016 much from a Market point of view - of course it is most likely because I screwed up terribly on my Hedging Strategy and this has meant I will make a Loss for this year and that sucks. I have felt all year I have been unable to make progress as the Shorts have wiped out any gains from my Longs but in addition I have been hit by more Profit Warnings and Swans of the Noir variety than I ever thought possible. Despite all that, I am actually really looking forward to 2017 with quite a hunger - the tragedy with my Shorting has forced me to confront a clear flaw with my Approach and I reckon that my Fixes (basically careful Entries, Tight Stoplosses and Smaller Position Sizes) will enable me to make money whatever the Markets throw at me (check out my Blog from 23rd November 2016 ‘Final Word on my Hedging Fiasco (hopefully) - Some New Rules‘).
Obviously it was not just the Hedging that has hurt me and the countless Profit Warnings etc. have taken their toll - however, despite the challenges I have faced, if I ignore (take out) the impact of the Hedges on my Overall Result for 2016, I would actually have made a low Single Digits % gain - to show this clearer, the Portfolio I run with/for a close friend is actually up about 6% on the year and she has exactly the same stocks but we only hedged in a very small way on her Portfolio (I think the Hedges cost about 2% for her). In other words, the Profit Warnings and other hits have been offset by good Gains on other Stocks - this is exactly how the Diversification in my Portfolio should work. I have taken a very Risk Averse and careful stance this year so that in itself would have hurt the Performance of the Portfolios as Markets have actually favoured Risk Takers this year. I am pretty relaxed about having a poor year on the basis that the Key Screw-up is totally controllable and avoidable in future and I have many years of successes behind me to know that my Stockpicking and Portfolio Management (with emphasis on Risk) does work and I just need to keep plugging away and the Results will come.
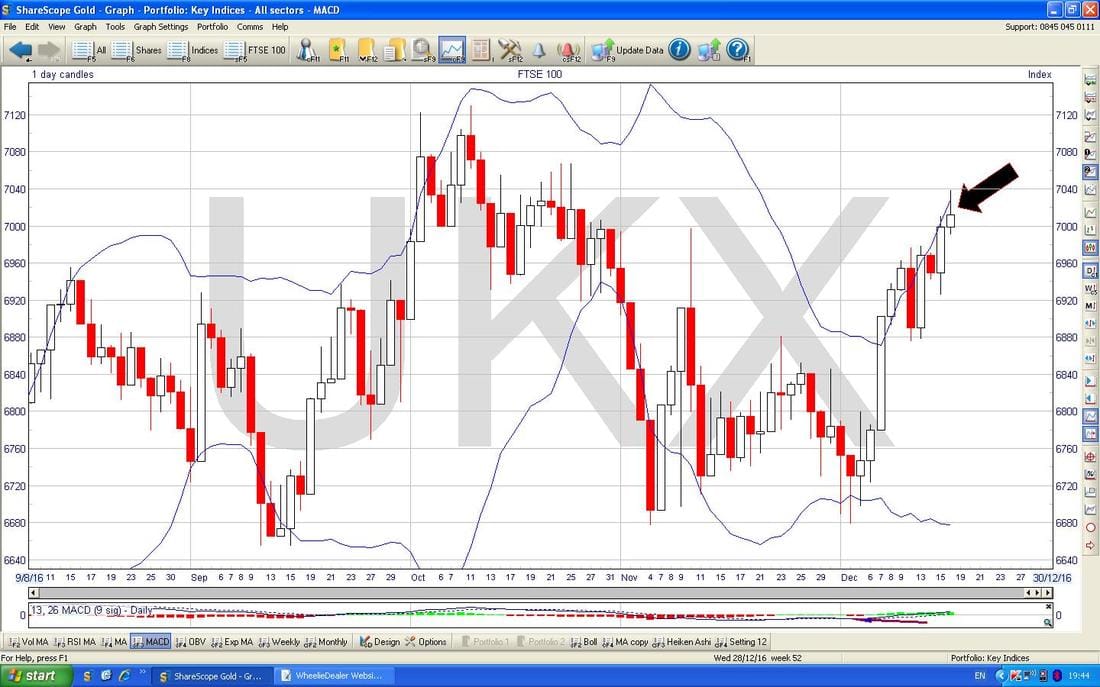
We must also bear in mind that there is an element of Hindsight and Outcome Bias here - if Markets had dropped as most people expected after Brexit and Trumpy, then my cautious stance would have looked like the work of a genius. Loads of my Stocks have been really battered since 2015 - quick examples which come to mind are IGG, PAYS, DVO, SPRP, CIU, QP., ETO, MCS, PETS, SIV, KCOM - and I reckon it is very likely that many or most of these will bounce back in 2017 - if you buy Quality Stocks, then these kind of bounce backs are highly possible and if any of them start to show a turnaround in fortunes (and more importantly the Charts start perking up) I will be considering Averaging Down which of course will accelerate any recovery. It is a real testament to the Power of Diversification if I can take so many hits to my Long Portfolio but still produce a small gain overall (obviously I am not counting the Hedges here). I am still plodding along with the Blog about a specific Company and probably have it about half written - I am struggling to find some details like Director’s Shareholdings which has delayed things a bit but it might well be that I release it in 2 Parts - we shall see. I will probably bash out a Blog this week on some or other subject and of course as the year closes I will be soon doing a ‘Scores on the Doors 2016’ Blog with a full breakdown of how my Portfolios have performed over the year - I will be particularly interested in the Income Portfolio because it was doing quite nicely when I last looked about a month ago but since then it has been battered by IGG but it has probably received a few Divvys (check out my ‘Portfolios’ page to see what I am going on about). That’s enough waffle anyway, I need to crack on because I want to watch the Apprentice Final at 9pm. As usual, I will study the Almanac first and then pick out some relevant Charts on the Indexes and stuff. Yuletide Week according to The Almanac According to the UK Stockmarket Almanac 2016, for the coming Week (w/c 19th Dec 2016) the FTSE100 has historically been up for 81% of Years with an Average Return of Positive 1.1% - so the backdrop is pretty strong and this must be one of the Best Weeks of the Year. However, before we get too excited, as you will see further down, many of the Index Charts look soggy. The LSE (London Stock Exchange) is closing at 12.30 on Friday 23rd December and the Japanese Market is closed this day for the Emperor’s Birthday. So say the BBC started putting out Daily News Broadcasts on this day in 1922 (and has been putting out Establishment Propaganda ever since !!……..and getting us to pay for the privilege). FTSE100 On the whole I think US Markets look crazy toppy and the FTSE100 less so - as I mentioned above, we are coming into a 2 Week period that has been historically very strong for the FTSE100 but of course this strength doesn’t always work and it is possible that we won’t get much upside or we might even drop - nothing is guaranteed in this game. So much of 2016 has been dictated by Currency movements - in many ways I have felt more like a FOREX Trader than an Investor this year - we might see this playing out in the next few weeks as well - this could have a big impact on what the FTSE100 does around Christmas. As ever, all the Charts are from the brill ShareScope software that I use as my ‘workbench’. The Chart below is just a scene setter and all I want to point out (just like I have so so so many times before) is the Long Term Uptrend Channel marked by my Red Parallel Lines - the Red Arrow is pointing to the Bottom Line of this Channel. Please ignore anything Green. 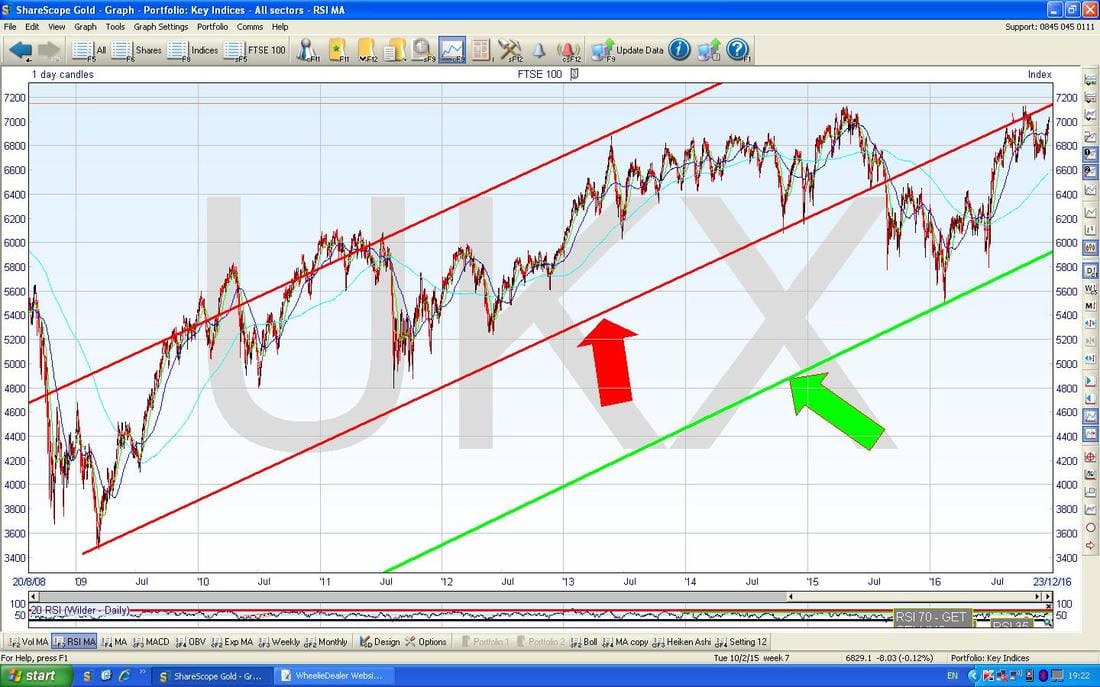
The Chart below is really important and has a couple of Key things on it. First off note my Yellow Circle which has an ‘Inverted Hammer’ Doji which was bashed out from Friday 16th December - in the context of the up move of about 2 weeks before, this looks very Bearish and I suspect this IH will act as a Reversal Pivot from which the FTSE100 will drop. With such a lovely Sell Signal I would be very tempted to put on a Short Position (with a tight Stoploss just above the ‘Wick’ of the IH at about 7045 or something) if I didn’t already have a Short in place and if we weren’t in the 2 weeks around Xmas which have historically been so strong. Chances are if I did not have a Short on already, I might be tempted to do a small one on this Signal.
It is worth bearing in mind that many people go Long on the FTSE100 around these final 2 weeks to play the historic trend - it is quite possible that this Long Trade will not work this year. Alternatively, maybe we get a couple of weak days before reversing into the normal Xmas Rally nearer New Year. The next important thing here is that we have not managed to reach the Red Line from the previous Chart - I have marked this with my Red Arrow here. This is very bearish - we need to crack through this Red Line and get back into the Uptrend Channel - so far we are not doing very well on this score. Perhaps the historic strength around Xmas can push it up more and back into the Uptrend Channel - we shall see but this is a major weakness at the moment. Note also we are very near the All Time High (ATH) at 7130 - this needs to be cracked as well. On the downside there is a lot of Support below in a wide band from 6920 to 6676 ish. 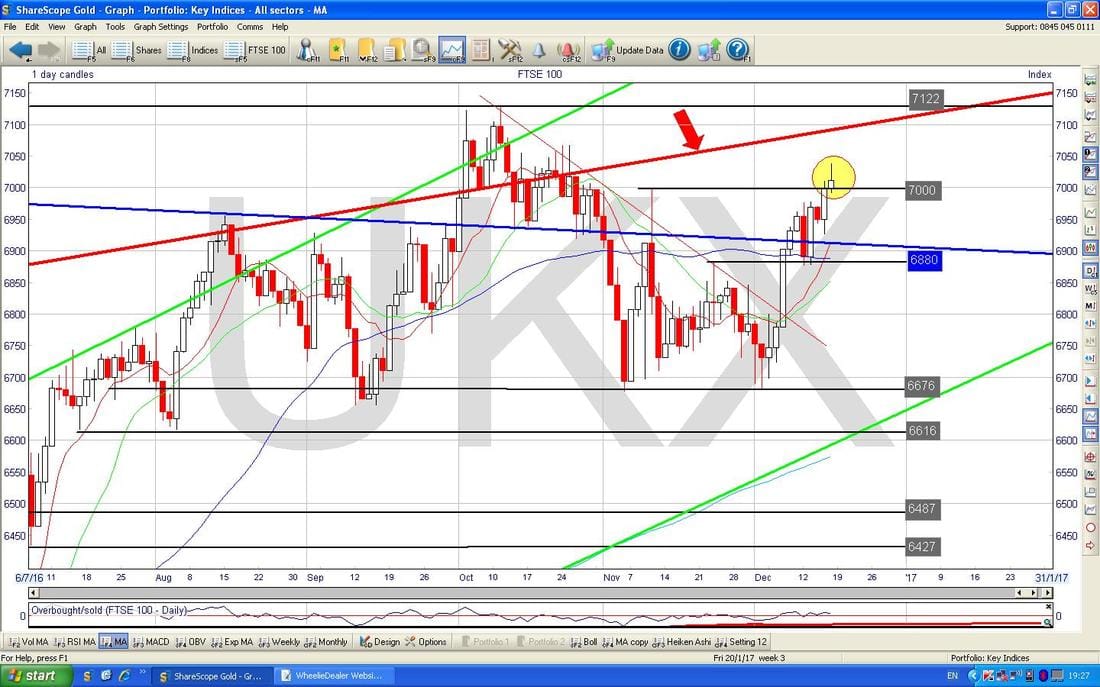
On the Chart below, the Blue Wiggly Line is the 50 Day Moving Average and the Green Wavy Line is the 20 Day Moving Average and the Red Wavy Line is the 10 Day Moving Average. Note where my Black Arrow is that the 10 Day and soon the 20 Day are about to do ‘Golden Crosses’ with the 50 Day - these are not such reliable signals as a Golden Cross with the 50 and 200 (and they are much more Short Term) but they might suggest more gains to come soon.
Note in the bottom Left Hand Corner I have included the ‘Graph Legend’ Box - whenever you see these on my Charts they will give more detail on what the various Lines are. 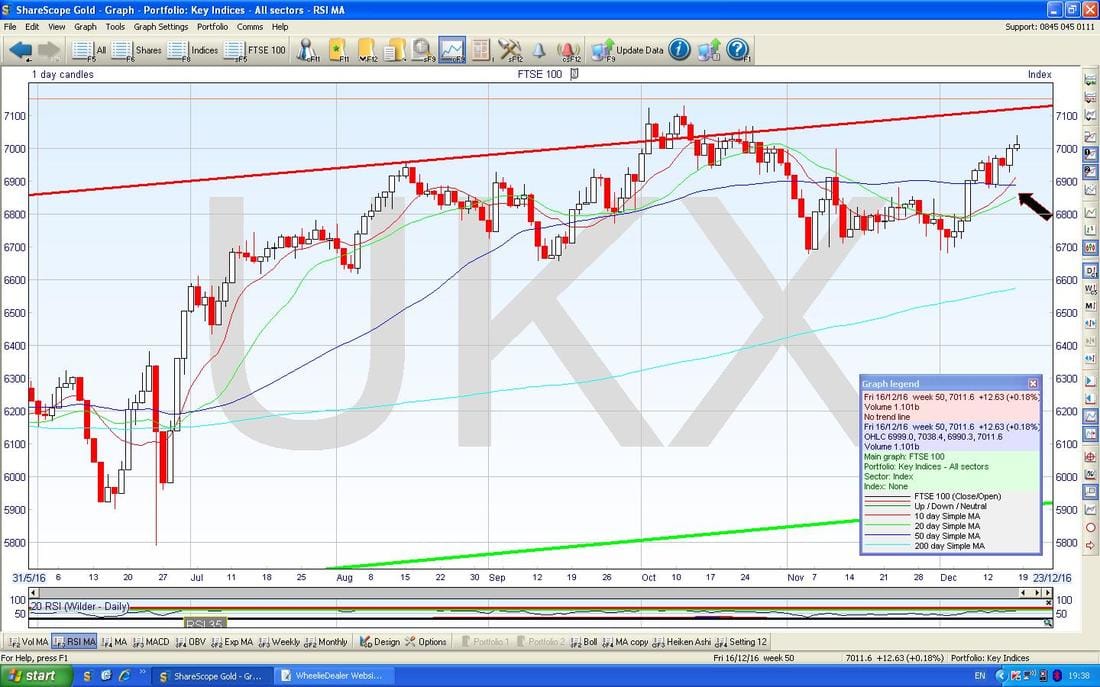
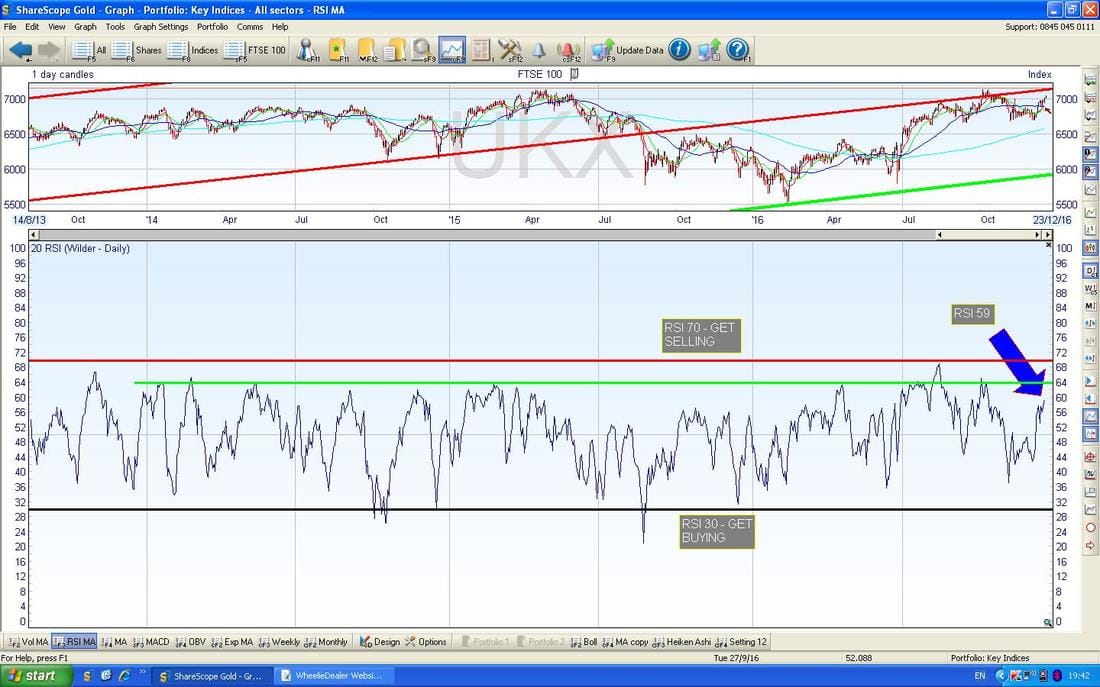
The bottom window on the Screen below has the RSI (Relative Strength Index) for the FTSE100 Daily. With a current reading of RSI 59 this is not particularly high but of course it is possible that the Index can fall from this level - it has done so before.
In the upper window on the screen below we have the Daily Candles for the FTSE100 surrounded by the Blue Wavy Upper and Lower Bollinger Bands. My Black Arrow is pointing to where the IH from Friday touched the Upper BB and then fell back - if we get more weakness at the start of the coming Week (Monday/Tuesday) then it is likely we are dropping away from the Upper BB.
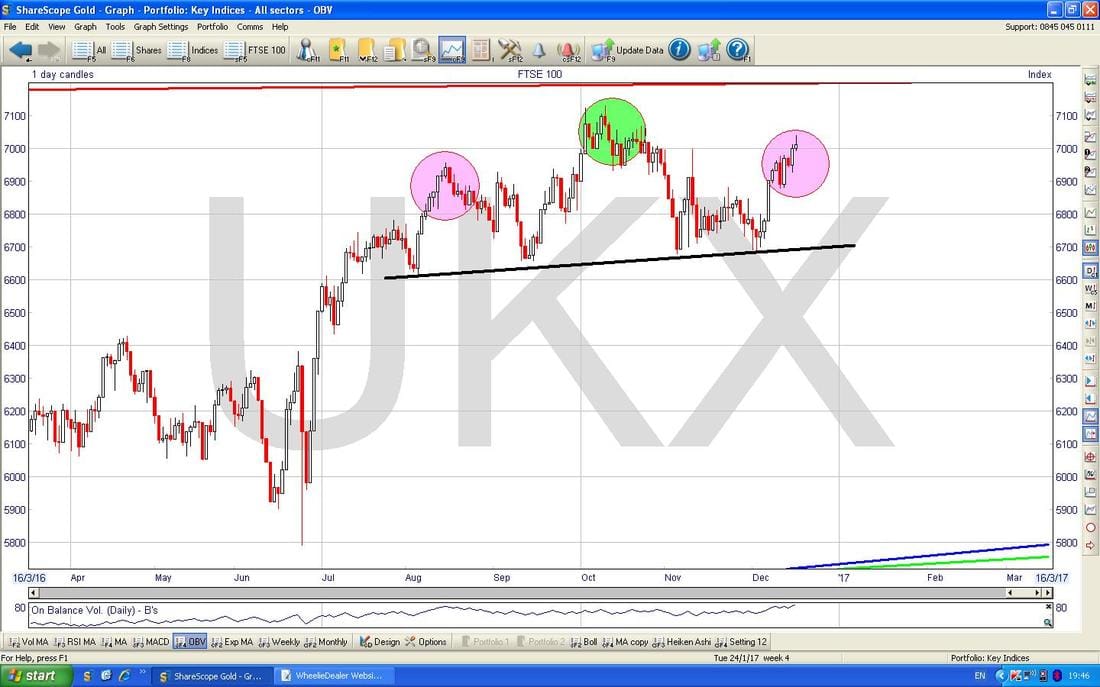
A quick one below (another Who reference !!). Remember I was banging on about that Head & Shoulders pattern a while back? Anyway, the recent moves up have made the H&S less likely but if you look at where we are now, if we get a fall next week then it would really look like a Shoulder where my Pinky Circle on the Right Hand Side Corner is placed. Such a H&S would be very Bearish if the ‘Neckline’ breaks down at about 6700 and could mean a drop to as low as 6200-6300 maybe.
CAC40 (France)
The Chart below has the Daily Candles for the CAC40 going back a few months. I am just showing this because of the Inverted Hammer Candle which I have highlighted with the Yellow Circle - after such an extended Run-Up, this looks a very Bearish context. I won’t show the Chart, but for your Info the RSI is 69 here which is a very high and ‘Overbought’ level. This looks ripe for Shorting. Please excuse the messy chart. 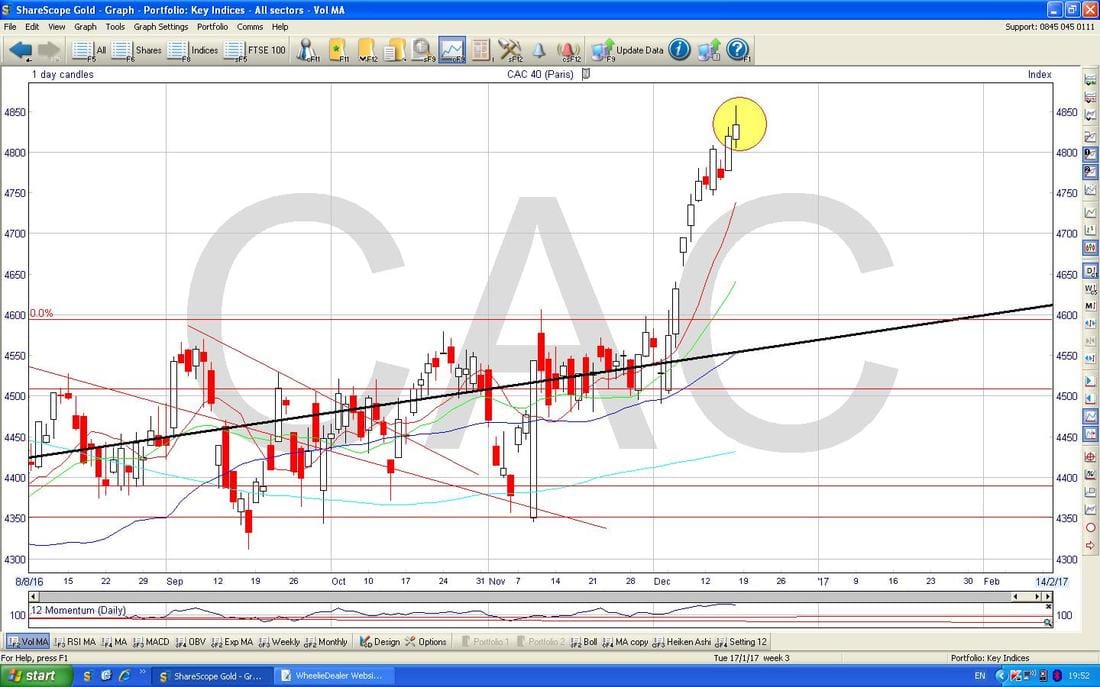
DAX (German)
Pretty much as you would expect, we have the same thing on the DAX. Bearish as hell. 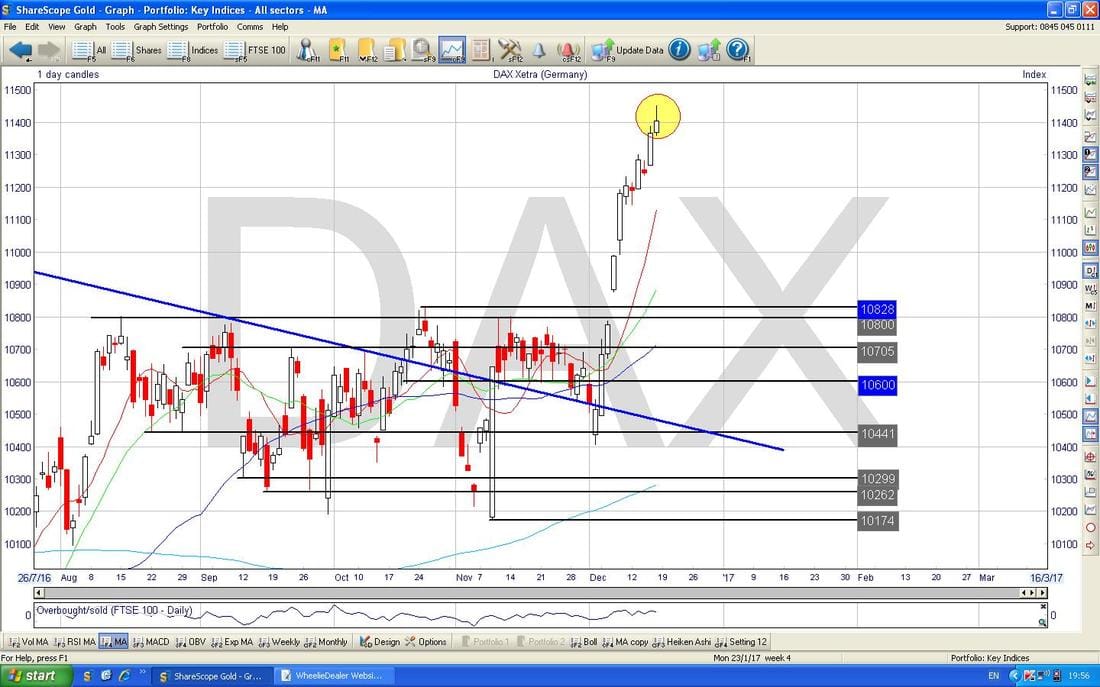
Again I won’t show it, but the RSI is 72 on the DAX - looks a great Short. Again the Stop can be placed just above the ‘Wick’ of the IH.
In the bottom Window on the Chart below we have the MACD (Moving Average Convergence Divergence) - my Black Circle is highlighting how the Green Histograms are starting to ‘rollover’ - I am calling this extremely early but it supports the case of an IH, a high RSI etc. 
Note the Heiken Ashi Candles on the Chart below still look Bullish (we would need some smaller Candles and some Red ones to start suggesting a turn down was coming on these HA Candles) - I am showing this because I want to emphasise the point that even though HA Candles are clearly amazing (and I particularly love the clarity of their signalling), they are ‘slow’ compared to some other Signals like the Candles and RSI readings - in other words we can get Sell Signals (or Buy Signals) from other things before we get a Sell or Buy on the HA Candles. Arguably that is a good aspect of HA Candles because they cut out shorter term ‘Noise’.
‘Cutting out the Noise’ - that has to be one of my Top and Most Important Phrases for 2016 and it seems highly likely I will be writing more specifically about this subject in the new year. 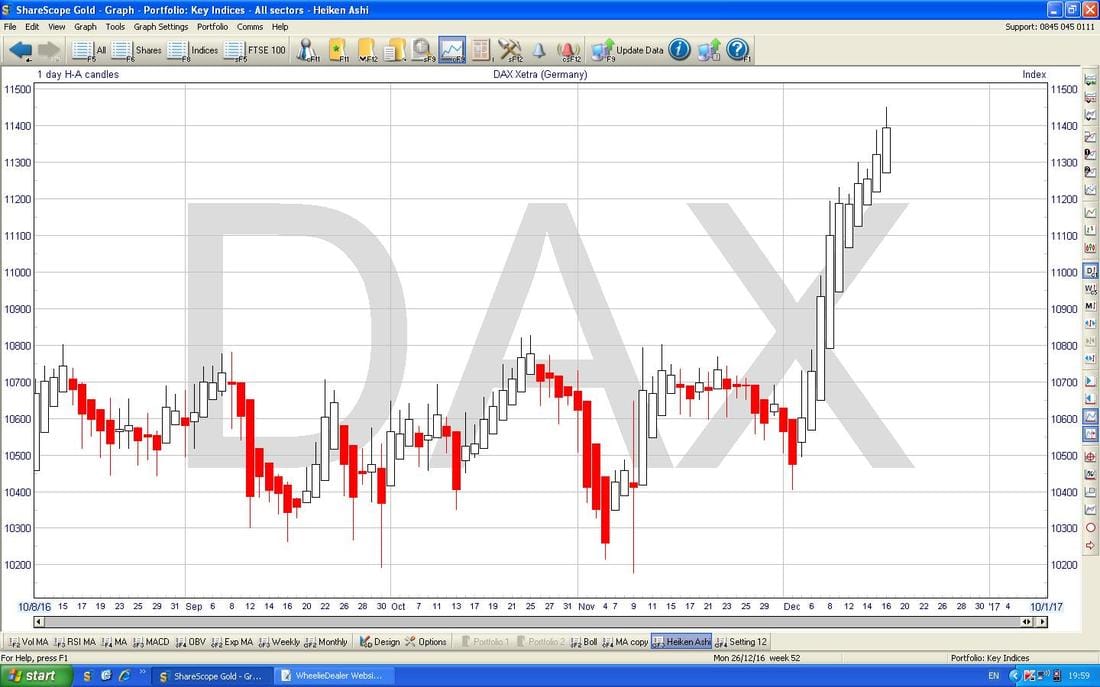
Pound Vs Dollar
As I mentioned earlier, the Markets have been massively influenced by FOREX moves this year and clearly the FTSE100 has been shoved around by the gyrations of the Pound. My Yellow Circle on the Chart below is pointing out 2 Candles which might form a ‘Bullish Harami’ Pattern (Pregnant Madam viewed from the side) and suggest that the Pound could rise against the Dollar - however, the context here is not great - ideally I would like to see more of a sustained move downwards before we get the Bullish Harami - but it might play out with the Pound rising. Note the Support around 1.24 - this is important to hold but there is a lot of Support down below - all this talk of the Pound weakening more seems very wide of the mark to me. Note also how the Pound/Dollar has fallen out of the Blue Lines Uptrend Channel - this is a sign of weakness and if we are to see the Pound recover more, then it needs to get back inside this Uptrend Channel. The Price is also around the 50 Day Moving Average (the Blue Wavy Line) - this could be a good Support Area. 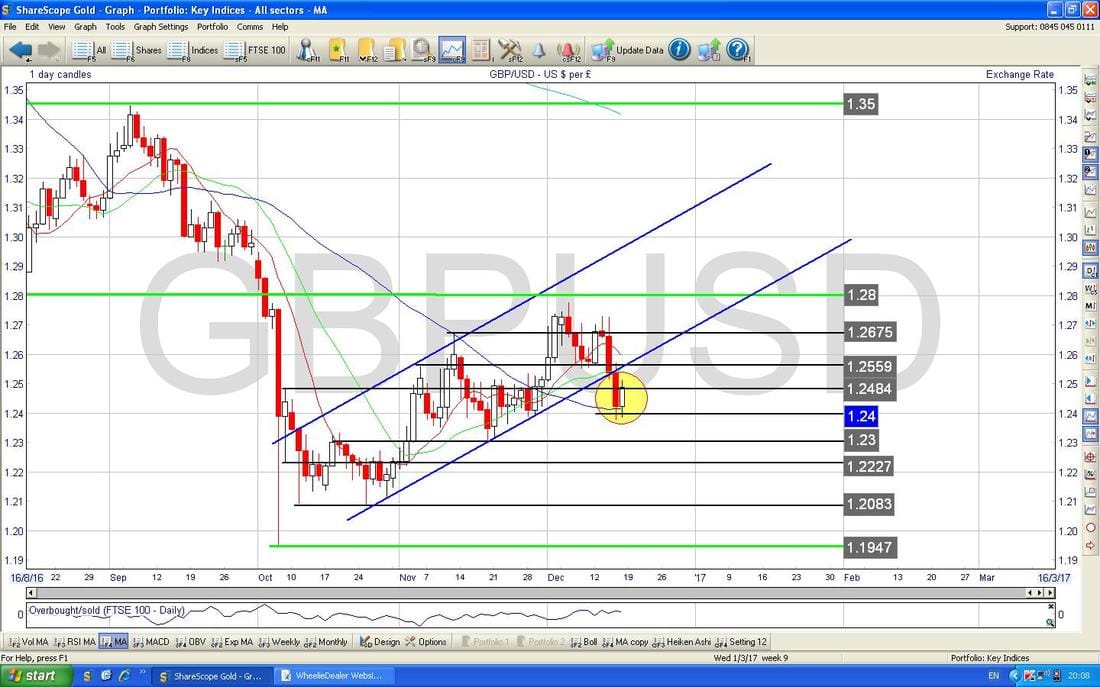
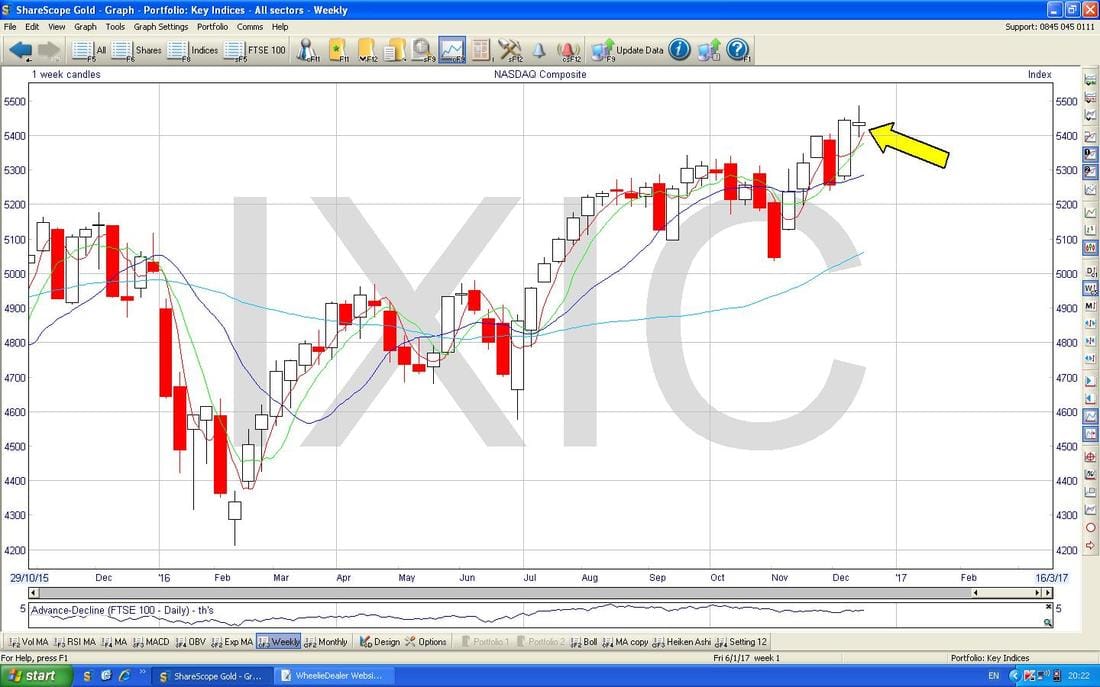
Nasdaq Composite (US Tech)
This one looks bearish in the Short Term as well. My Chart has Daily Candles and if you look at the Blue Arrow this is pointing to an Inverted Hammer from Thursday 15th Dec and then my Black Arrow is pointing to a big down ‘Bearish Engulfing Candle’ from Friday. This is a sweet set-up - the IH gave a Sell Signal on Thursday and then the BEC ‘confirmed’ the Signal by dropping the next day - this looks like we will get more falls. The Nasdaq 100 looks very similar (this is the ‘US Tech 100’ that is available to trade on the igindex platform). 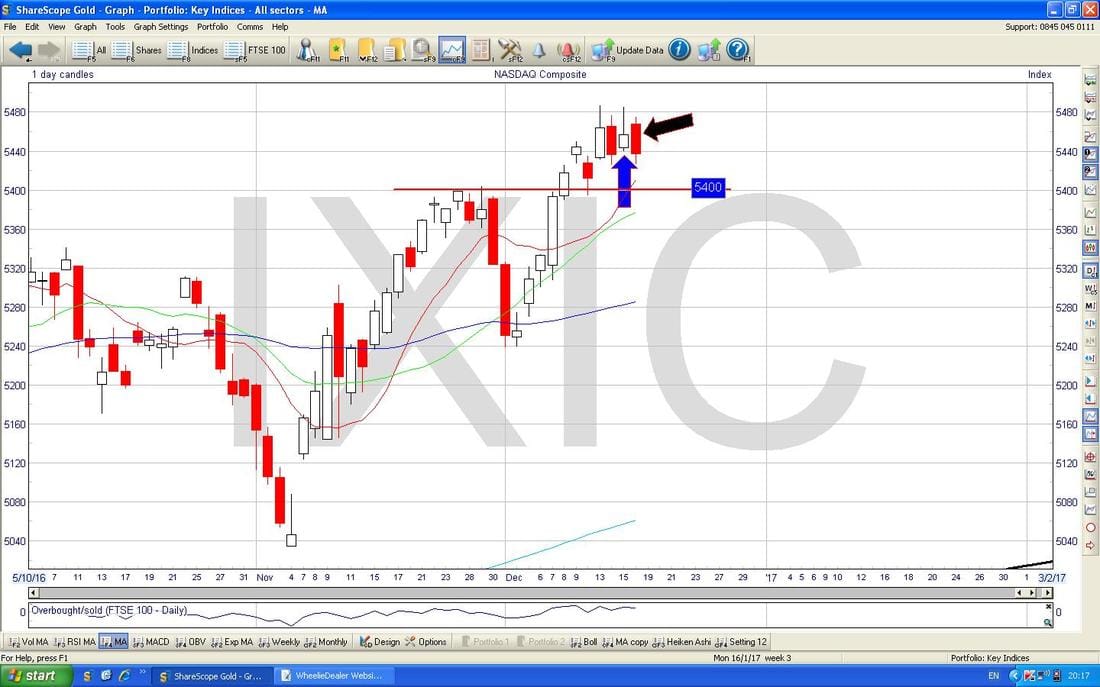
The Screen below has the Bollinger Bands - my Green Arrow is showing where the Red Candle has taken the Price away from the Top BB.

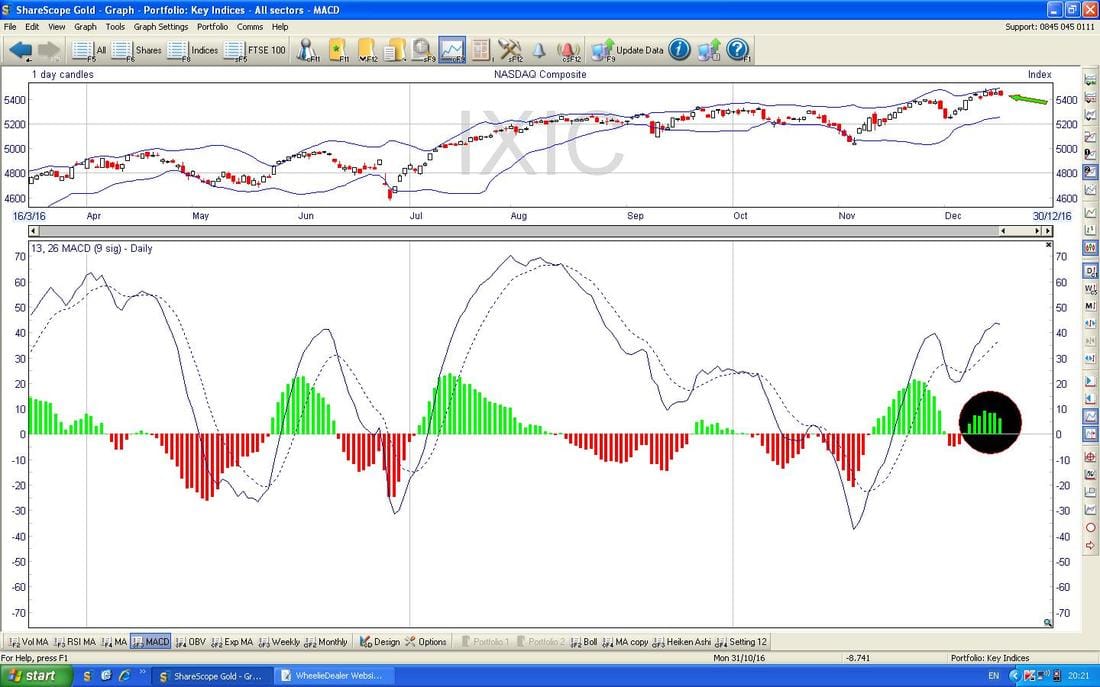
In the bottom Window on the Screen below we have the MACD for the Nasdaq Comp - note where my Black Circle is that the Green Histograms are rolling over and forming a ‘hump‘ (anyone Long the Nasdaq might certainly get the hump………sorry, couldn‘t resist that feeble effort).
The Chart below has the Weekly Candles for the Nasdaq Comp - my Yellow Arrow is pointing to a ‘Narrow Body Doji’ from last week - this suggests we might turn down now - which lines up with the Bearish outlook seen above.
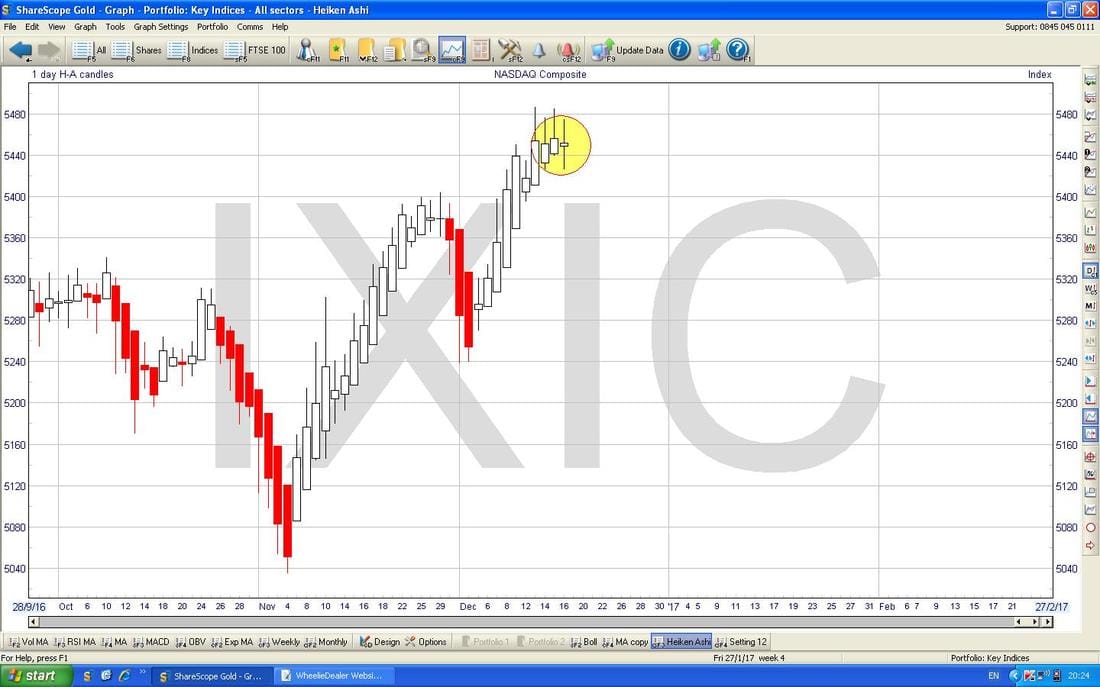
On the Chart below we have the Heiken Ashi Candles for the Nasdaq Comp. You can see loads of lovely Up Candles in White but note that my Yellow Circle is highlighting where the Candles of the last 3 days have become a lot smaller and the one on Friday particularly so. This is not a Sell Signal yet on the HAs, but we now need to be on the lookout for Bearish Candles in the next few days. Ideally for a Bear Case, we would need to see a couple of Red Down Candles. I have put in this to show what to look for on the HAs.
S&P500
For time reasons I won’t show much here. It’s a very similar situation to the Nasdaq Comp with things looking Toppy. The Chart below has the Weekly Candles for the S&P500 - my Yellow Circle highlighting a Bearish looking ‘Shooting Star’ type Candle. 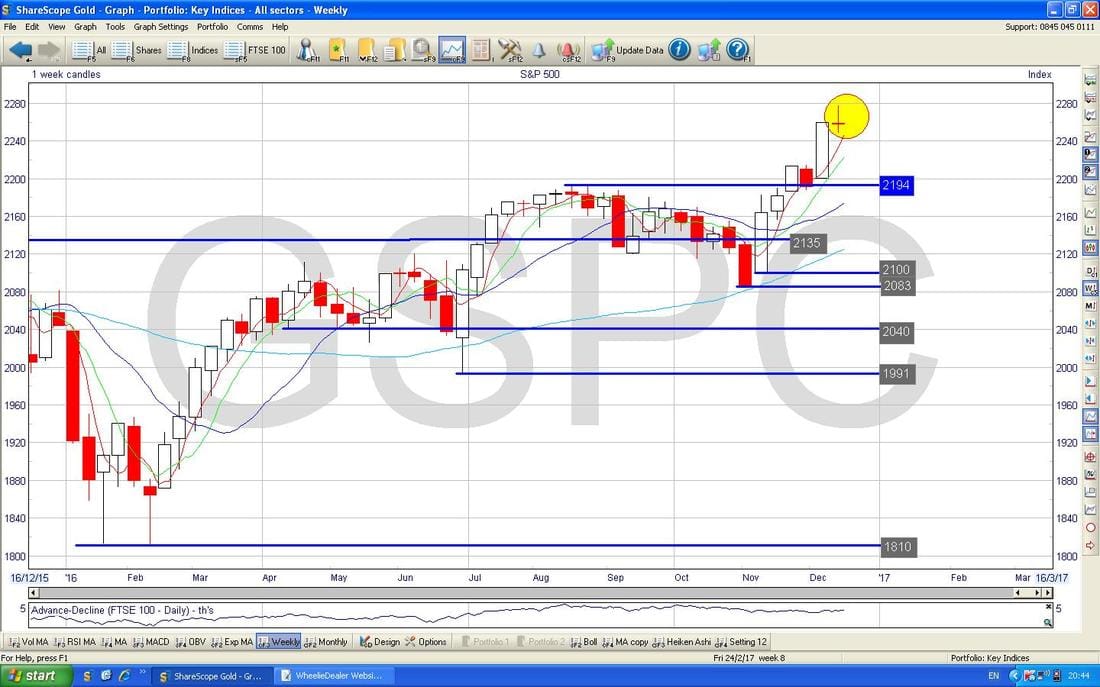
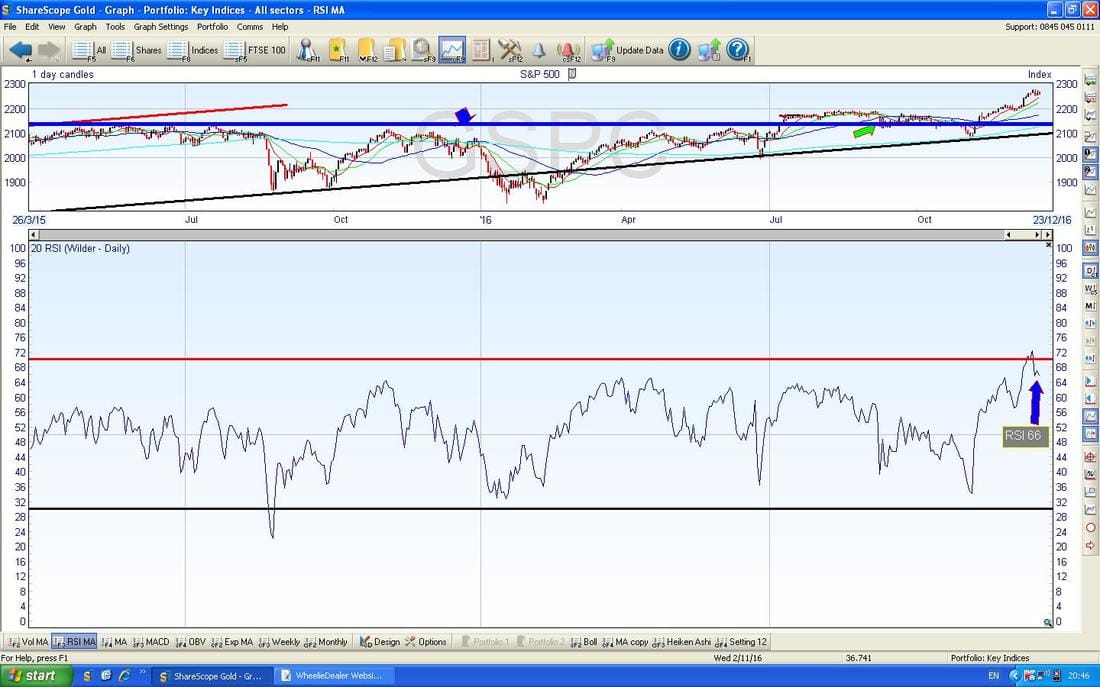
In the Bottom Window below we have the RSI for the S&P500 Daily - with a reading of RSI 66 it is high but note also that it has turned down from about RSI 72 in recent Days.
Brent Oil (Spot)
This looks a bit more positive - which could help the FTSE100 as there are a few chunky Oil Stocks in the upper echelons. The Chart below has the Daily Candles for Brent and my Green Arrow is pointing to a nice Up Candle which swung up off a Hammer Candle from the day before - nice. There is clearly decent Support at $53 and a lot of Resistance up above from $56 to $57.535. 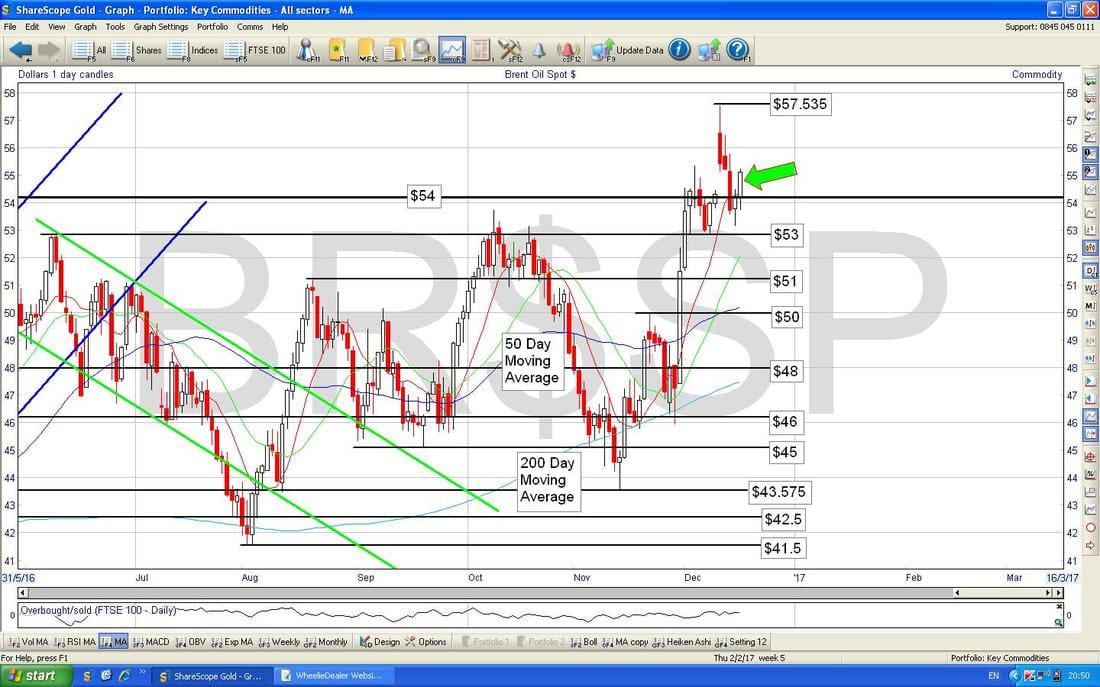
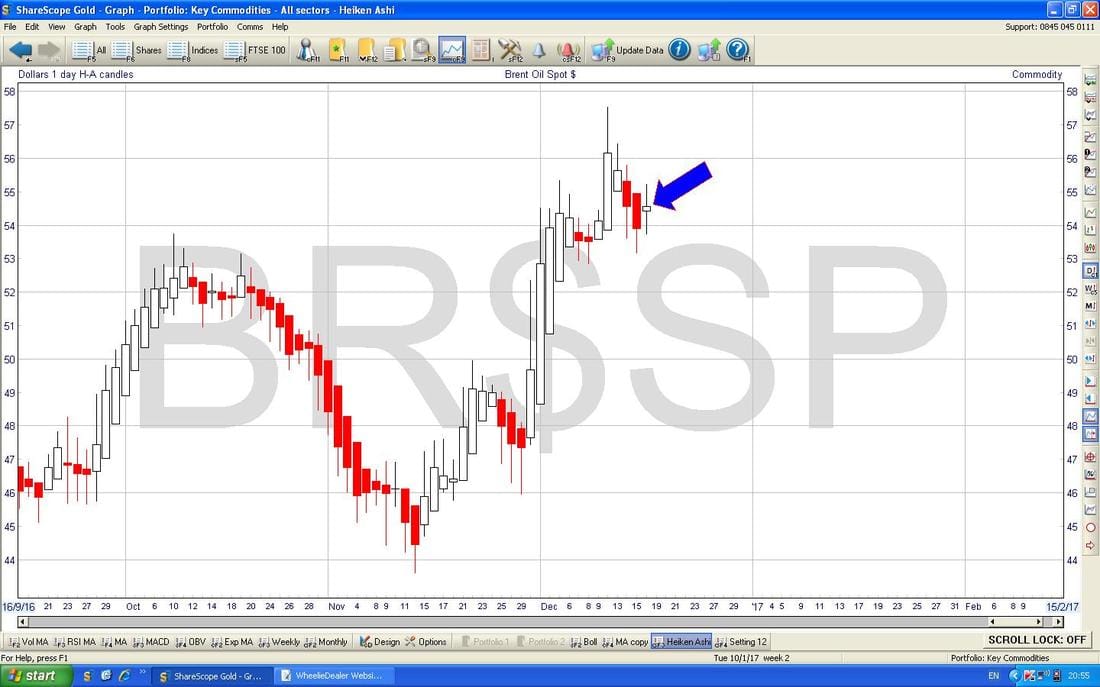
I couldn’t resist a bit more Heiken Ashi - note my Blue Arrow on the Chart below which is pointing to a Narrow Body Candle which on these HA things (remember, the usual laws of Candlestick Charting do not apply to HA) is an early sign that there might be a change of trend. In the context of 2 previous Red Down days - this Narrow Body Candle could be telling us that the Price wants to reverse up. Ideally we need another nice Up Candle on Monday to confirm it is going to move up.
Gold (Spot)
The Chart below has the Daily Candles and I have done a bit of ‘Big Picture’ stuff here. The power of the move down is quite something - it has fallen like a Gold Brick. There is a fair bit of Support just below - $1120 an immediate one but then we have Support all the way through to $1046. As I type this I am wondering that if we see some weakness in the Stock Indexes soon, maybe Gold will rally a bit off that - any move up could be powerful as it is so oversold. 
I have zoomed in on the Chart below - note my Yellow Circle which is highlighting a 2 Day ‘Bullish Harami’ - this could mark a Reversal Point upwards.
Right, The Apprentice has just started……….. Good luck for the coming final days of 2016. Merry Xmas, WD. 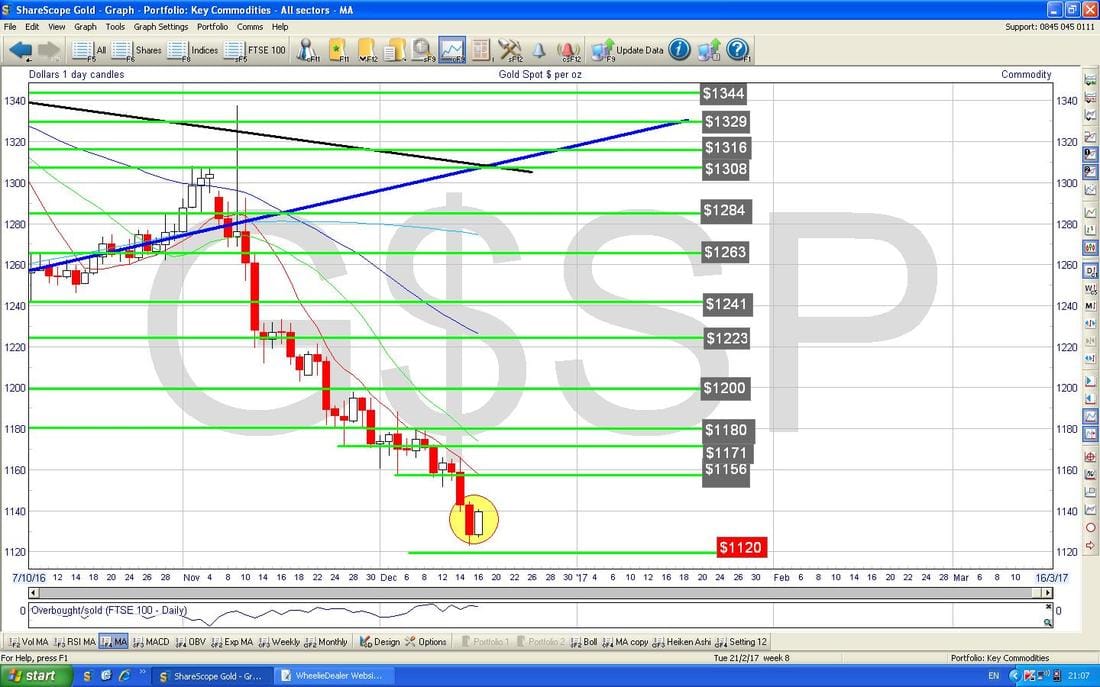
0 Comments
Leave a Reply. |
'Educational' WheelieBlogsWelcome to my Educational Blog Page - I have another 'Stocks & Markets' Blog Page which you can access via a Button on the top of the Homepage. Archives
January 2021
Categories
All
Please see the Full Range of Book Ideas in Wheelie's Bookshop.
|
