

|
educational blogs |
|
I’m always totally thrown by these Clock Changes - I spend most of the day with no idea what time it is and all of the Clocks in WheelieTowers seem to tell me different things - and the confusion isn’t helped by some updating automatically whereas others don’t - hopefully in a few days I will have figured out what is going on !!
One upshot of this is that some ‘normality’ is being returned with regards to the US Markets and what time they Open and Close - in theory they should Open at 2.30pm BST and Close at 9pm. After the drops on Friday maybe it would be better if they just stayed shut !! Last Week Blimey, that was a painful one - after being nicely in positive territory for 2018 so far I got a right kicking last week and my Portfolio ended up down 3.5% on the Week and this means that I am now down 2% on my Portfolio for 2018 - not a situation I like at all. The hit last week was exacerbated particularly by Sprue Aegis SPRP coming out with the News on Friday that BRK has terminated their Agreement early and that SPRP could get stuck with some Stock - there is a lack of clarity on the impact but it whacked the Stock hard and it is a big Position for me. Annoying, but I am not going to panic as the move to new Suppliers is the key to a much improved performance for SPRP but it is frustrating that yet another hurdle has been placed in their way.
In addition to this I took a hit on Moss Brothers MOSB although this is a very small Position so it did not do too much damage. The saving grace here is that MOSB has a huge Cash Pile and that should cushion them through a difficult period and the cause for the problems they have put down to Supplier Switching problems caused by the Weak Pound but they see this as being resolved later in 2018 - I am happy to see how it plays out but of course there is scope for more disappointment here.
I will cover the Indexes later in this Blog but I think we are pretty near a bounce and I closed the Short Spreadbet I had on the FTSE100 late on Friday (see the ’Trades’ page) - in an Ideal World I would now go Long on an Index but I will wait until Monday Night to see how things look but I would love to catch a Bounce if there is one because these moves up off the Bottom are always some of the most powerful and there are many Points to be captured. Of course, seeing as I am mainly a Long Term Investor with a Long Portfolio of Stocks, I am positioned for a Bounce anyway but it would be sweet if I could put on a Long Spreadbet to pinch a bit of Profit if I could. Blog Slate I have made good progress on writing the ‘Wheelie’s New Improved Index Trading System’ Blogs (blimey, that title needs shortening !!) and have realised that in addition to loads of words (most of which are written) it could benefit from some ‘Worked Examples’ which would be Charts showing where to Open a Trade and where to place Stoplosses and stuff like that - obviously this will need quite a lot of work so it may be a few Weeks until I can get much of this out. In the meantime, if I cannot get these in a fit state, then I have some other short Blogs which can be issued so there will be a flow of Blogs as usual. I did quite nicely on a FTSE100 Short Spreadbet Trade last week following the principles I am writing about in my Blogs where I banked a Profit equal to 0.5% of my Portfolio Value - and over recent Months where I have been following this Approach I seem to have banked some nice Big Gains and also taken some Small Losses and that is the key to making this kind of Trading work. It is all about cutting Trades that go against me quickly and with a small hit and letting Winning Trades run as much as I can so the Wins are large. My intention is that when I do the ‘Scores on the Doors’ Blog for 2018 (blimey, I am getting well ahead of myself here !!), I should be able to include a full breakdown of how many Index Trades I did over the Year and what the Total Losses were and what the Total Gains were - if you look at my ‘Trades’ page you can see all of the Index Trades there and if you are so minded you could work out the % Gains and Losses from the information I have given. Empiric Student Property ESP I first invested in ESP probably around 3 years ago and I was hoping it would be a sweet play on Student Housing and able to emulate the success that Unite Group UTG in particular has had. Sadly things went off the Rails but I was a bit lucky because before the Poo really whacked the Fan (that is such a weird metaphor), by pure luck (or by ExtraSensory Perception as one Twitter genius pointed out !!) I closed my Spreadbet Positions and so when it all kicked off I only had the Exposure in my Income Portfolio. Last Week ESP issued Results which you can read here: https://otp.tools.investis.com/clients/uk/empiric1/rns/regulatory-story.aspx?cid=918&newsid=991064 Anyway, as I see it the problems here were really as a result of ESP being a very new Business and how it was previously focused on growth via the route of buying lots of Student Properties but it was clear that very little (if any !!) attention was put on the Day to Day Operational side of running such a Company. The glamorous Property Buying expansion bit is easy but the boring Day to Day stuff was clearly not exciting enough for the previous Directors to pay much attention to. A key problem with ESP Numbers has been that they have paid out a Dividend that has not been covered by the Earnings that the Company is generating - that is fine for a short period of time but clearly is not a sustainable situation. The new CFO, Lynne Fennah, says that the Dividend will be covered by the end of 2019 and I have no reason to disbelieve her because she has instigated a lot of significant changes which will most likely improve the Operational Performance of ESP hugely - here are just some of the Changes she has brought about:
The biggest change however at ESP is the replacement of many Directors - sadly Baroness Brenda Dean who was the Chairman died unexpectedly and Paul Haddaway who was the previous CEO and a Founder mysteriously left the Company. Tim Attlee who was also a Founder has stayed with ESP and is now the Acting CEO - there is clearly a Carrot being dangled whereby if he turns the performance around, then he will be made the Permanent CEO - this is a good incentive. The former CFO, Michael Enright, resigned over a year ago I think and this was when Lynne Fennah came on board. I think she is a breath of fresh air and doing a superb job of sorting the mess out. The first step in any Recovery Situation is for the Directors to change - ESP has clearly had a lot of this and it is a big positive. Anyway, I could go on forever about this but I have lots more to cover in this Blog - so here is a link to a Blog I wrote ages ago when I bought into ESP which should give an idea of what they are trying to do but it needs to be borne in mind that much has changed since then: http://wheeliedealer.weebly.com/blog/empiric-student-property-esp-buy-rationale And here is a link to the BRR Media Conference Call thing which is about 50 minutes and I recommend you listen to it as it really outlines the changes Lynne Fennah is instigating: http://webcasting.brrmedia.co.uk/broadcast/5a4e42f7c6d7d20b64bad90a The upshot of all the above is that I bought more ESP last Week at 86p - at that Price there is roughly 20% Upside to get back to the NAV of 104p per Share, and I will pick up 5.7% Dividend Yield - that looks attractive for a Business that is in Recovery Mode and I think it is a Stock I can hold for several Years and it will pay me a decent Dividend and hopefully some Capital growth - ESP themselves are forecasting a 10% Total Return per year. The Chart of ESP below is from the marvellous ShareScope Software that I subscribe to - as always if you click on the image it should grow bigger so you can see more detail - and the first thing to notice is the Black Downtrend Line which I have pointed at with my Black Arrow and note how the Price has moved Sideways out of this Downtrend - that is not perfect, but it is an indication that the Market is seeing improvements at ESP and it has walked out of the Downtrend. However, despite a good performance last week after the Results, on Friday the Price dipped down below Horizontal Support where my Green Line is (Green Arrow) - this is not a good thing although it is possible that it is a small overshoot - we shall see. My Blue Arrow is pointing at the Big Red Down Candle from Friday. For things to get proper Bullish here again, I would like to see a Breakout above the 88p level, with last Week being generally ropey for Markets, it is possible that ESP can do better going forwards. 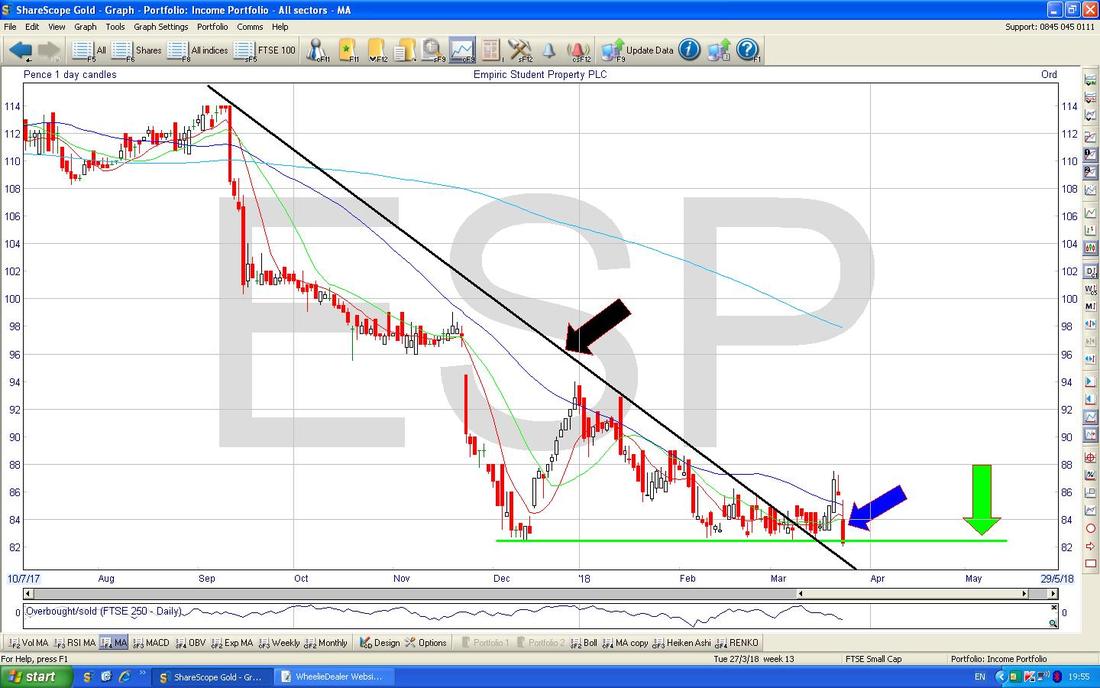
Time for some Indexes……..
FTSE100 I am starting with this one because I had a Short Position on it which I closed on Friday - I want to show why I made this Decision. As it happens, the US Markets fell heavily after I had bought back my Short but whatever happens I think we are near the Bottom in the very Short Term but of course any kind of Bounce up is impossible to predict in magnitude and I think it will be very difficult to make substantial gains without a lot of Chopping around and forming some sort of Base of Support from which the Markets can move up again. With Summer not far off and that normally being a soggy period, I can see us having quite a bit of ‘pain’ coming in the months ahead and I see no reason to take silly risks on the Long side of things. The Charts I will show below are what I was confronted with on Friday Night just after the UK Markets closed and I had to base my Decision to close the Short on this information (I had a decent Profit on the Short and I did not want to hold it over the Weekend and risk it evaporating if something positive was to come about). My Chart below zooms in to the near term action on the FTSE100 and my Green Circle is highlighting a Red Down Candlestick but note how it has a long ‘Tail’ or ‘Wick’ pointing downwards which shows that the Market pushed down early in the Day on Friday but then it recovered later which showed how Bears were in command in the Morning but then Bulls charged in and started Buying. The Low Point on Friday was 6877 and this is now am important Support Level for next Week - if it is breached to the downside, then we could see more weakness ahead. To the upside, we have the 7062 Level just above which was the Floor of the Sideways Range which ran for a while between 7062 and 7326 - the failure of this Range is a big negative and because 7062 was previous Support, it should now become Resistance (“Former Support becomes Resistance and Vice-Versa” and all that) and it could limit gains in the near term and even if the FTSE100 can struggle up over this level, there is still a lot of Resistance at about 7255 and then 7326. My Yellow Circle is highlighting the Bearish ‘Death Cross’ between the 50 Day Moving Average Line (Black Arrow) and the 200 Day MA Line (Blue Arrow) - this is a huge negative and implies Weeks and Months of Market weakness ahead of us. 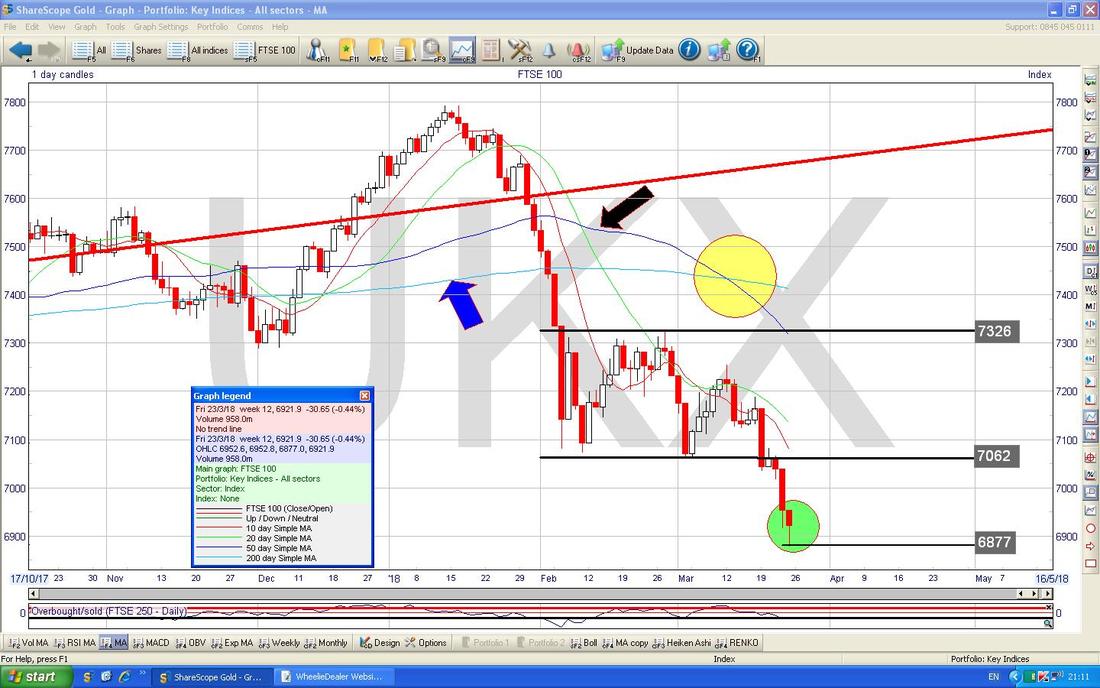
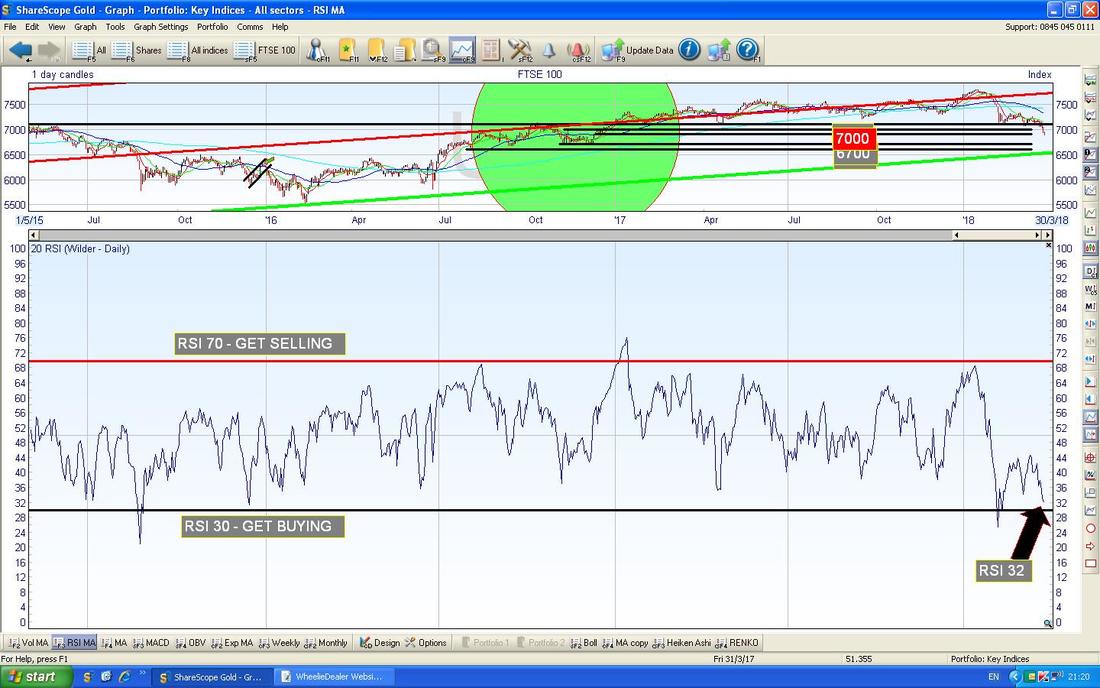
In the bottom window on the Screen below we have the RSI (Relative Strength Index) for the FTSE100 Daily - on a Reading of RSI 32 it is very low and this is a major reason for why I closed my Short and why I think a bounce will come soon. Obviously it can go lower, but we are clearly very near the point where it turns up.
On the Chart below we have the Daily FTSE100 Candles with the Black Bollinger Bands above and below. My Yellow Circle is trying to show that the Candle from Friday is touching the Bottom BB and this doesn’t really show any kind of Reversal is coming - in fact, if you look at the Narrow Green Box then you can see where the Candles have ‘hugged’ the Bottom BB in the recent past and of course this could happen again.
As always, when looking at these Indicators we often find some which disagree with our overall thesis on what is likely to happen next - it is largely a game of getting used to what the Indicators are saying and how reliable they are and then making a judgement based on the Conflicting Information. Much of it is about ‘timeliness’ as some Indicators are earlier predictors than others. 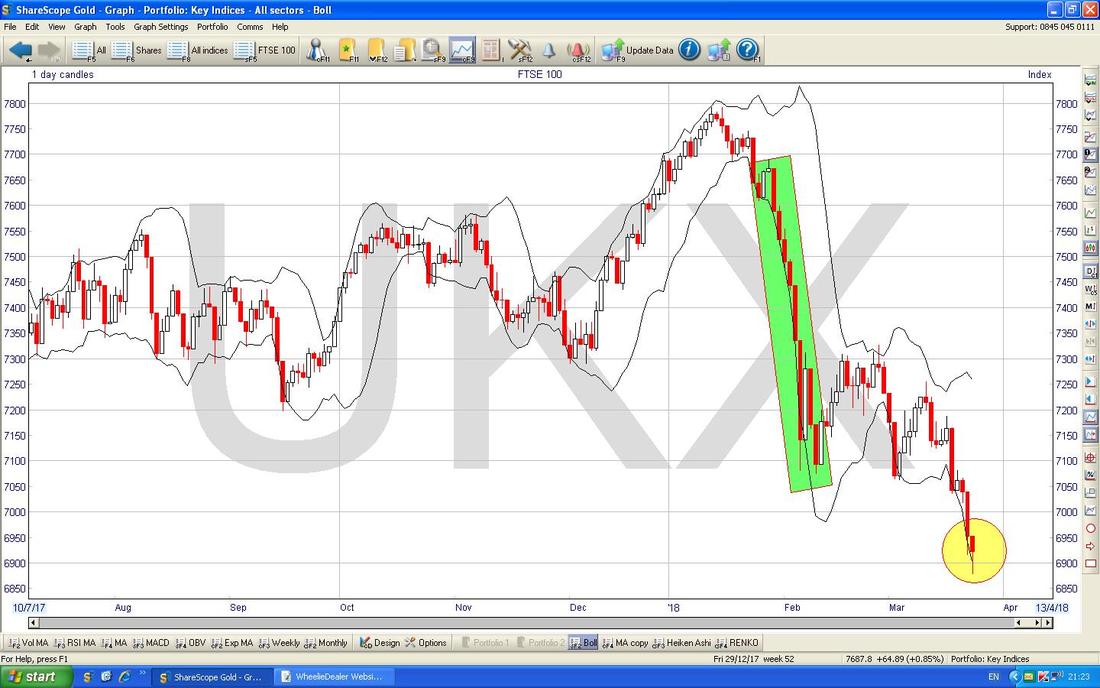
On the Screen below I have pulled out to a slightly bigger picture to try to show where the Support down below is. My Yellow Box is trying to show that there is a big Zone of Support between 7000 and 6700 and it is quite likely that the Market can turn up from somewhere in this Box. Further down, 6600 looks a key support level. If 6600 fails, then things could be very serious.
My Black Arrow is pointing to where we had a 13/21 Day EMA (Exponential Moving Average) ‘Death Cross’ - such Crosses are one of my favourite Indicators and look how this one led to such huge falls - if you had gone Short when this Signal happened and stayed in the Trade (easier said than done !!) then there were a lot of points on the table here. Note how the Candle from Friday is a long way below both the 13 and the 21 Day EMA Lines - this was another reason for why I closed my Short - I expect Mean Reversion to kick in soon here. For things to get more Bullish, we need a 13/21 Day EMA ‘Golden Cross’ (the opposite of the Death Cross) - there is no sign of one yet. 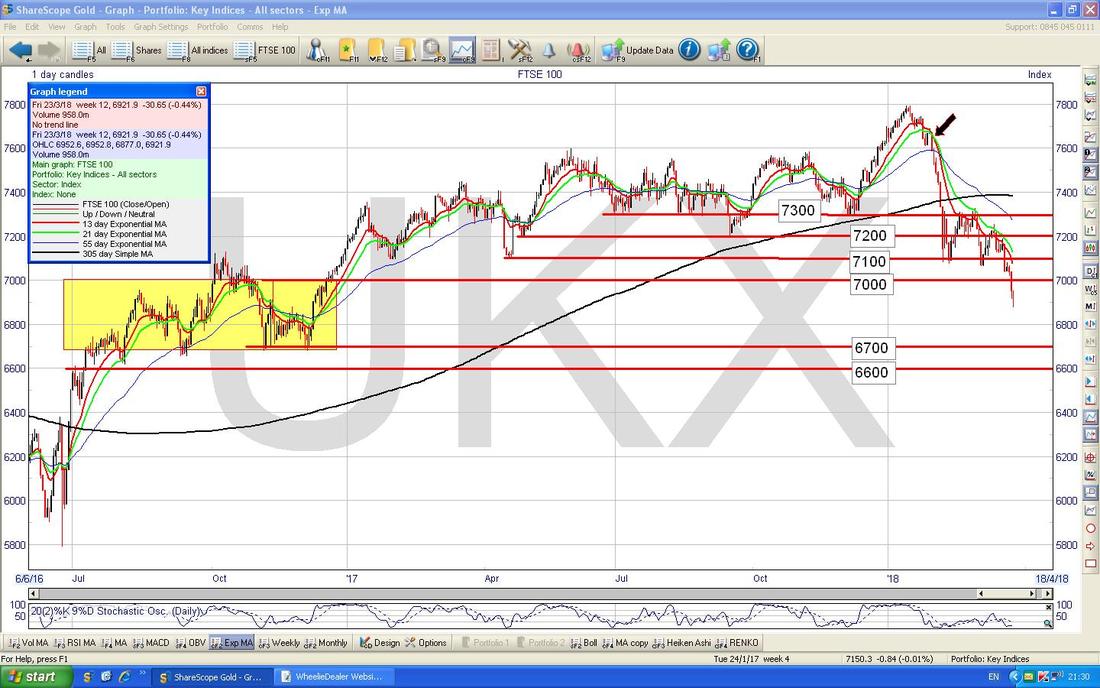
The Screen below has the Weekly Candles for the FTSE100 - my Yellow Box is showing the Big Red Down Candle for Last Week and clearly this is pretty ugly looking and on the face of it would imply more falls ahead. Note also how we have fallen out of the Uptrend Channel between the 2 Blue Lines (Blue Arrow) - such a drop out of the Channel is not good and now the Bottom Line of the Channel could be Resistance at about 7300-7400 etc. - so any Recovery here will be slow in the making I suspect.
That is quite a messy Chart so please don’t bother dwelling on it. 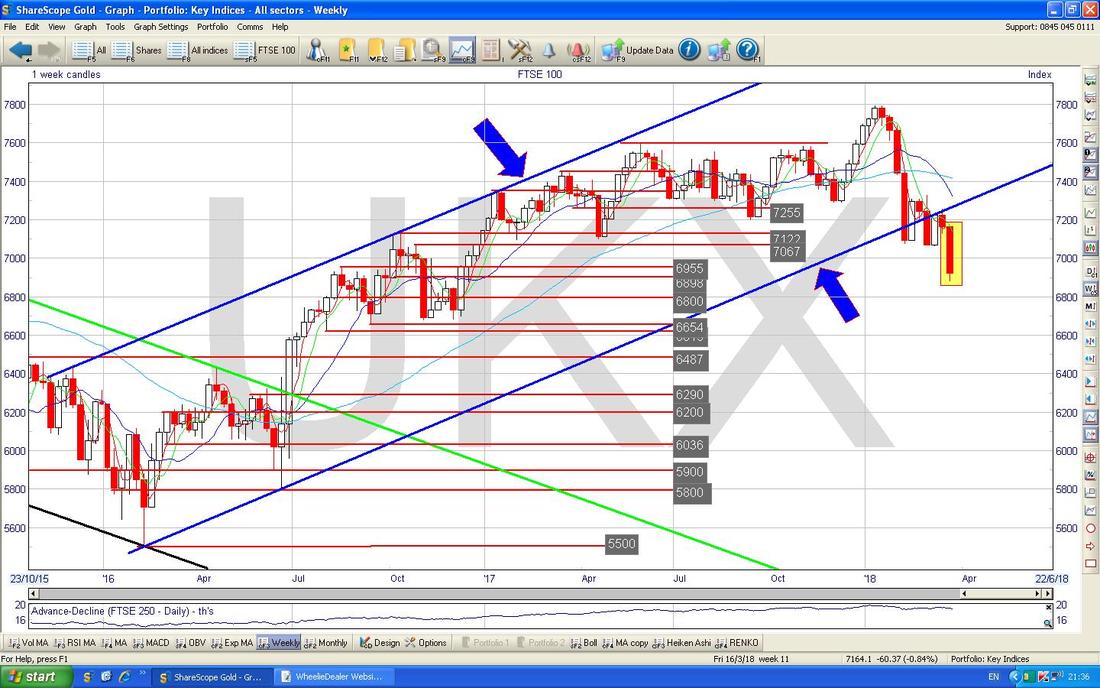
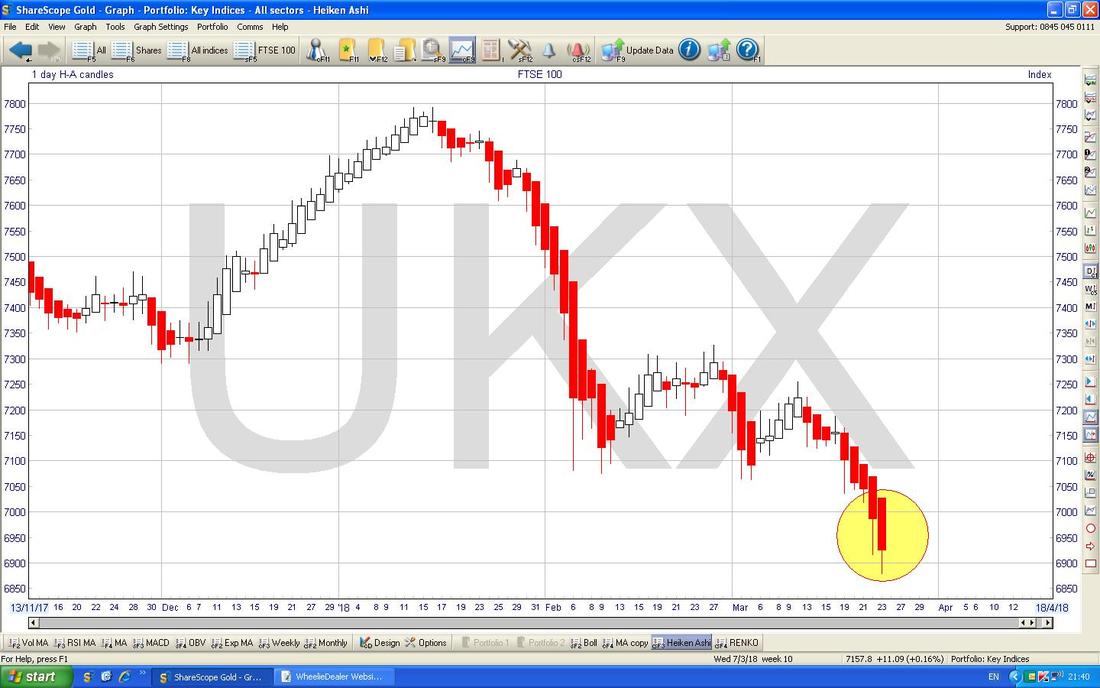
The Chart below has the Daily Heiken Ashi Candles - my Yellow Circle is capturing the Big Red Down Candle from Friday which implies more falls ahead - however, note the HA Candles are ‘slower’ than Normal Candles so we could get a Bounce which doesn’t show up on the HAs until later.
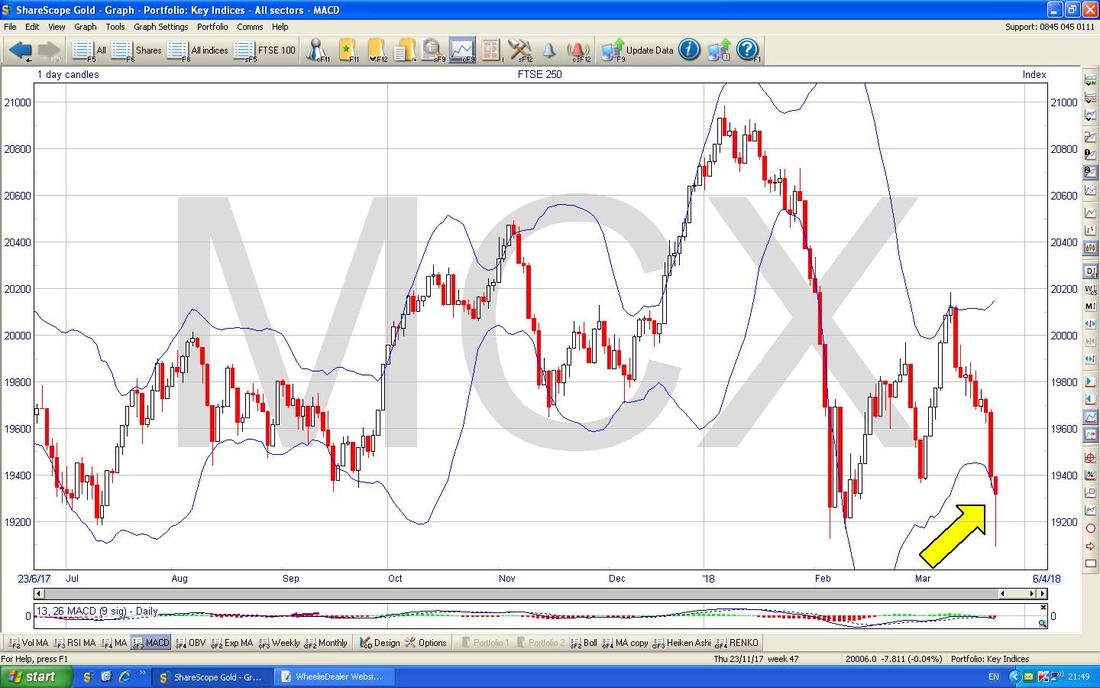
FTSE250
I won’t spend ages on this one but this is another reason why I closed my Short on the FTSE100 (most UK Indexes tend to move in tandem - not perfectly, but pretty close). The Chart below has the Daily Candles for the FTSE250 and my Pink Box is catching a beautiful example of a Hammer Candle and this suggests a Reversal is taking place - that was a major reason I closed the Short. However, the Hammer is a Short-term thing, more concerning as we go forwards is the 50/200 Day MA ‘Death Cross’ as implied by my Yellow Circle - this Cross will obviously happen now although it is possible that it gets reversed quite quickly with a ‘Golden Cross’ but for that to happen we would need some properly bullish behaviour now for quite a while - that is unlikely really. My Blue Arrow is pointing at the 50 Day MA and the Green Arrow is pointing at the 200 Day MA. 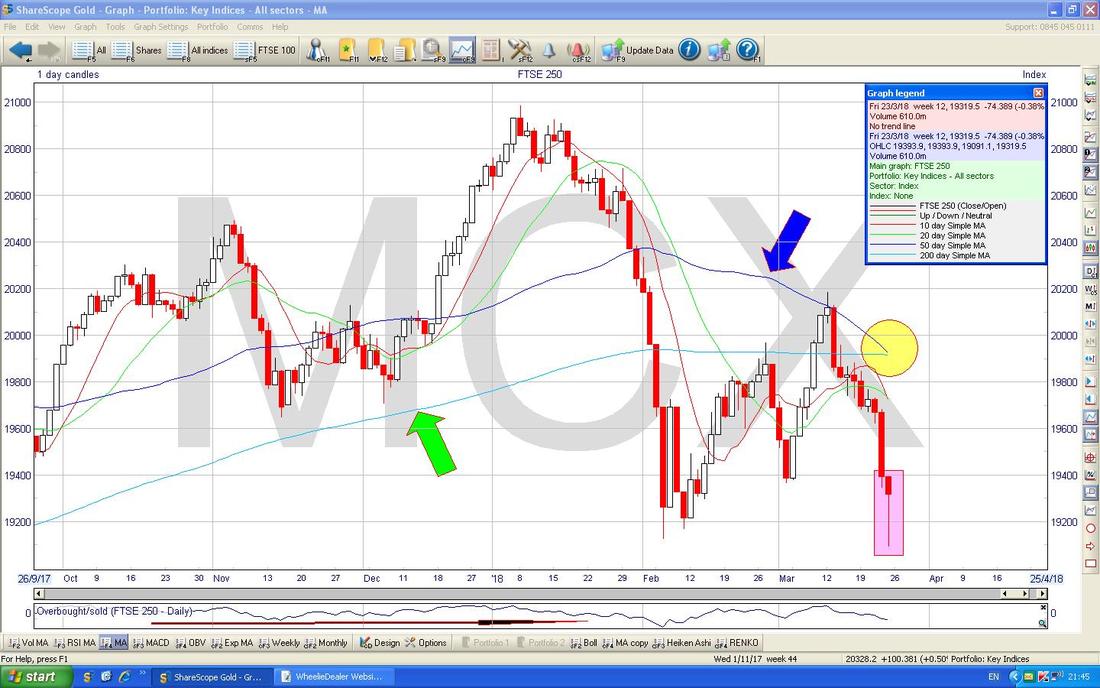
This one is interesting - this has the Daily Candles for the FTSE250 and where my Yellow Arrow is note how the Hammer Candle from Friday fell outside the Bottom Bollinger Band during the Day but closed back inside the Bands - this looks like more evidence of a Reversal where the Bulls are coming back in to give the Bears the Horn (calm down, Vicar).
FTSE SmallCap
Yet another Reversal Candle on Friday - my Yellow Circle is highlighting this. Note again how we are near a 50/200 Day MA ‘Death Cross’. 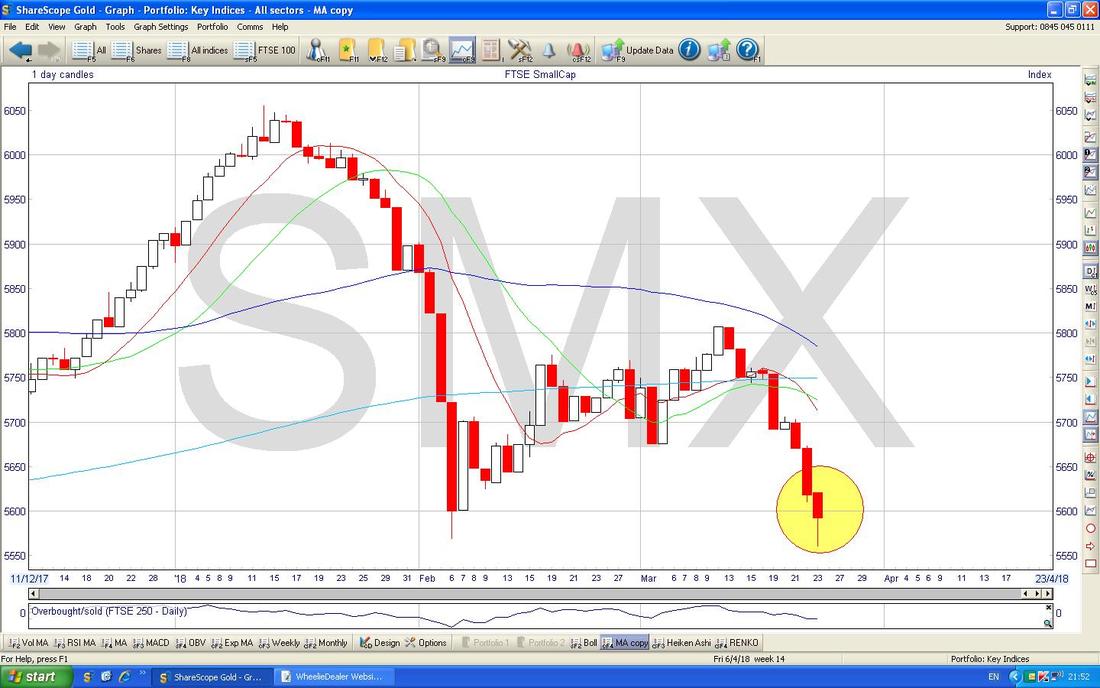
S&P500
After the UK Markets closed, the US Markets had a seizure and fell off the cliff !! The Graph below has the Daily Candles for the S&P500 and there is a lot of important information captured in just this simple chart. First off my Green Arrow is showing the Big Red Down Candle from Friday which on its own is obviously a Bearish development but note how it has Closed sat right on the Light Blue 200 Day Moving Average Line (marked by my Black Arrow) and this should be decent Support - so it might bounce from here. If it continues to fall on Monday and perhaps Tuesday, then a Bounce later in the Week has to be extremely likely. What I would dearly love to see on this Chart now is a nice Up Day on Monday so we get a Bullish Harami 2 Day Candle Pattern - that would be rather nice but with the current mood of the Markets anything could happen. However, there are reason for hope on this Chart. Note how the 200 Day MA (Black Arrow) is still very much rising and note how the 50 Day MA (Blue Arrow) is still nicely up above the 200 Day MA and although it has dipped down a bit, it is a long way from doing a 50/200 Day MA ‘Death Cross’ - it is something to keep an eye on, but really this is still a Medium Term Bullish Chart. 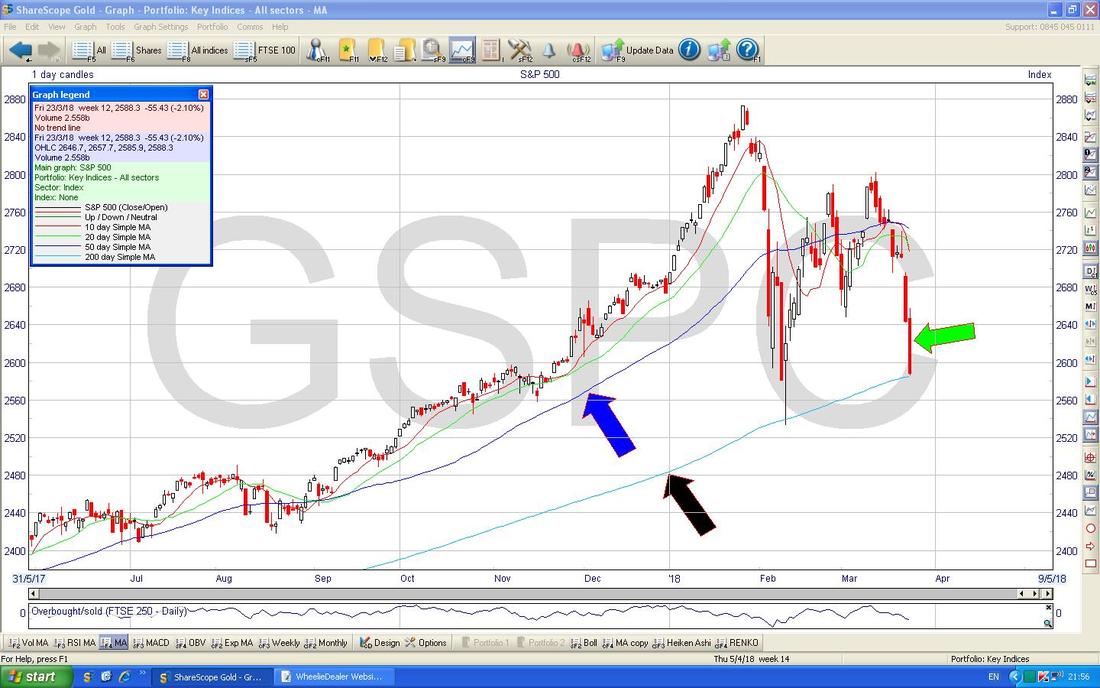
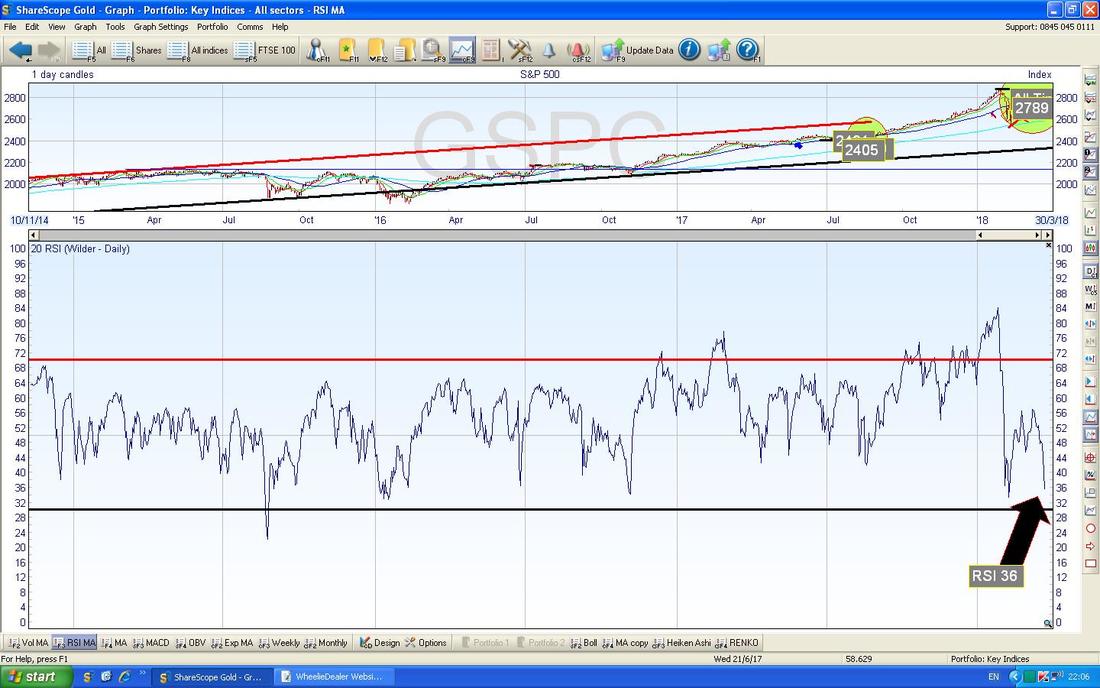
This is promising for the Bulls - the bottom window below has the RSI for the S&P500 Daily and on a reading of RSI 36 it is getting pretty low by its normal recent standards - clearly a Bounce is coming soon.
I won’t show the DOW this week because it is almost identical to the S&P500.
Nasdaq Composite The Tech Index is similar to the S&P500 and DOW but looks stronger in that it has not fallen as much and in recent Years/Months this has been the most Bullish Index. I want to draw this Blog to a close so I won’t spend much time on this but the bottom Window on the Screen below shows the RSI for the Nasdaq Comp Daily and on a Reading of RSI 40 this is very low by its recent standards - again, I would expect a Bounce soon and it is worth remembering the idea that “Monday reverses Friday” - so perhaps we can see some recovery tomorrow. OK, that’s it for this week - good luck everyone and don’t do anything silly !! Cheers, WD. 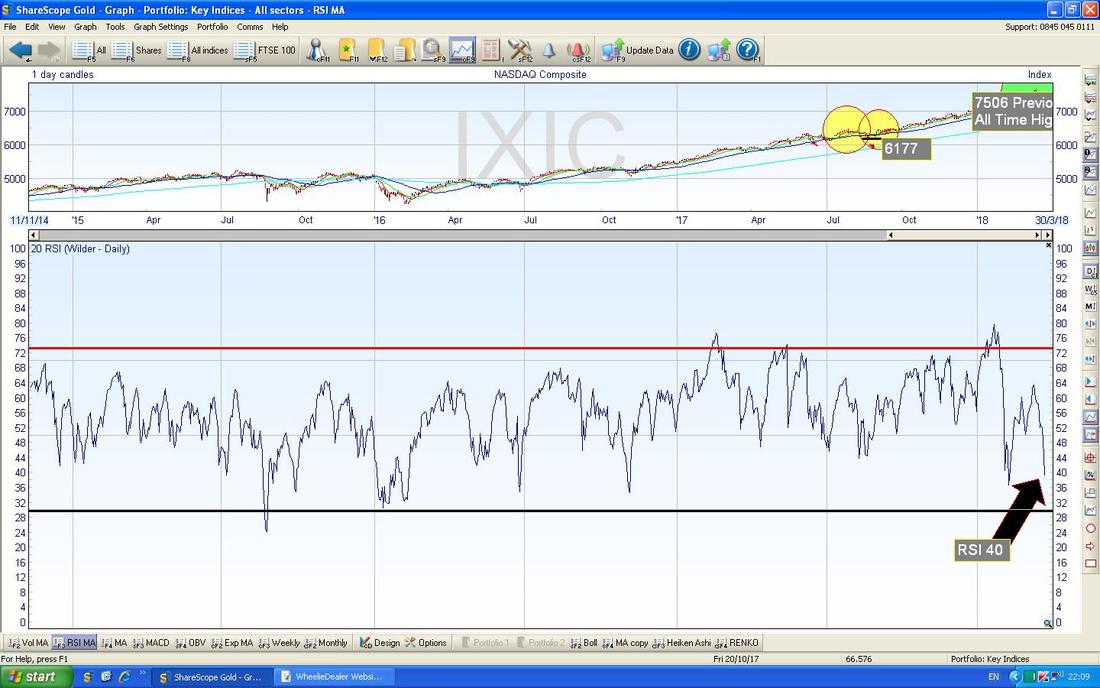
4 Comments
christopher jenkins
26/3/2018 11:01:05 am
Looks like you are getting your bounce today as you thought! Interesting that you had 30% short on the FTSE100. An alogorithmic strategy I run has 30% in shorts. Only trouble is, this is only one part of my overall portfolio! I think being down only 2% this year on your total portfolio is really excellent. I'm down 4% and I think this is pretty good! Using spreadbets to trade indexes in volatile markets looks like an interesting approach.
WheelieDealer
27/3/2018 11:06:21 pm
Hi christopher, thanks for your comments. Interesting that your Algorithmic Strategy comes up with 30% Short - this is just a number that fits with my Stoploss Approach really (I size my Positions on how much Loss I am prepared to accept if the Stoploss gets triggered). My intention on Hedging is to make a bit when the Markets drop but then to make a bit more on the Rebound - so winning both ways to help offset Losses on my Stock Portfolio - of course in practice it is not easy. As you say 4% down is pretty good and I have seen many People saying they are down more - this has been a tough start to a year. I am sure you will be interested in my 'System for Index Trades' which should start coming out in Blog form later this week,
mr catflap
26/3/2018 06:40:55 pm
Thanks for the Empiric link. The new FD sounds really on the ball actually... I still find it strange they are blaming their problems on Aberdeen ..... Aberdeen is only 2% of their room porfolio. It must be completely empty and Cardiff ( 6% of their room porfolio) must have 50% occupancy if everything else is ticketty-boo. That would account for the 5% miss in the occupancy level. So quite badly mis-managed. Pity none of the "Analysts" worked this out or asked them direct question on occupancy in these locations. Seems to be the key metric to look for in the next update........
WheelieDealer
27/3/2018 11:10:43 pm
Hi mr catflap, Leave a Reply. |
'Educational' WheelieBlogsWelcome to my Educational Blog Page - I have another 'Stocks & Markets' Blog Page which you can access via a Button on the top of the Homepage. Archives
January 2021
Categories
All
Please see the Full Range of Book Ideas in Wheelie's Bookshop.
|
