

|
educational blogs |
|
There was a bit of discussion last night on the Tweet Factory about Bull Flags - I suggested one might be forming on Empresaria EMR and I got back the fairly likely question “what’s one of them then?”
I love Bull Flags (you will find a lot of people with a tad of Technical Analysis bent will be of like mind I suspect) because they are a very reliable Indicator that the Price is likely to move up soon. This should be a quick Blog to just give a clear illustration of what they look like and some other factors around them which are well worth knowing. I will use Dart Group DTG as an example and show what is happening over at EMR and why I highlighted that I thought a Bull Flag was perhaps starting to form.
DTG Example
If you look at the Chart below, you should see a couple of Blue Arrows - these mark out a ‘Flagpole’ that formed a few weeks back (this is an up to date ShareScope Daily Candles Chart as of End of Day 27th April 2015). The Parallel Red Lines should mark out the ‘Flag’ part of the Bull Flag Pattern - I have sort of pointed to this with the Big Green Arrow. The Bull Flag Pattern is made up of the Flagpole bit (the Wooden Stick) and the Flag bit (you know, the floppy material part that flaps around in the breeze) which is the sideways Price movement between the 2 Red Lines. In the case of this Bull Flag, it worked out extremely well and the fast move up of the Flagpole then led to a Sideways Consolidation for a couple of weeks, followed by a Breakout to the Upside and a Strong Move up as marked by the 2 Black Arrows. If you think about it in terms of what is actually happening in the Real World (as opposed to a Graphical device to show it), Buyers have driven the Price up strongly and this has then resulted in lots of Sellers taking advantage and dumping their Shares at the new Higher Price (this is the Flagpole bit). This puts a lid on things for a while, but the Price does not drop too far because there are still a lot of keen Bulls out there wanting to buy in on the slightest bit of weakness. This process of ‘Sideways Consolidation’ goes on for a while as the Bulls and Bears fight it out (this is the Flag part), until the Sellers are exhausted and the Bulls take command again and force the Breakout to the Upside. All Hell then Kicks off and the Buyers scramble for Stock and are prepared to pay higher Prices and we get the Fast Move up - sweet. A key thing to note here is that the Charting Theory behind Bull Flag Patterns says that the move up after the Breakout from the Flag should be Equivalent in Height to that of the Flagpole. In this case, if you look at the distance between the 2 Blue Arrows (i.e. the Height of the Flagpole), then you can see that the next move up which is marked between the Black Arrows, is not hugely dissimilar. Now, this is where it gets interesting, especially if you hold DTG. I think another Bull Flag Pattern is forming (“can you see what it is yet?” - ok, probably best not to go too Rolf Harris these days……and don‘t even think about getting your Diggeridoo out…..), where the Flagpole is the bit between the Black Arrows and the Black Parallel Lines mark out the Flag part. If may not happen, but if it does, then we might see another strong move up in coming weeks. The distance between the Black Arrows (the Flagpole Height) is about 40p - so if we get a Breakout of the Flag to the Upside, then we might see as much as 450p quite soon (410p, the top of the Flag, plus 40p). Shame I don’t hold DTG myself anymore……….. 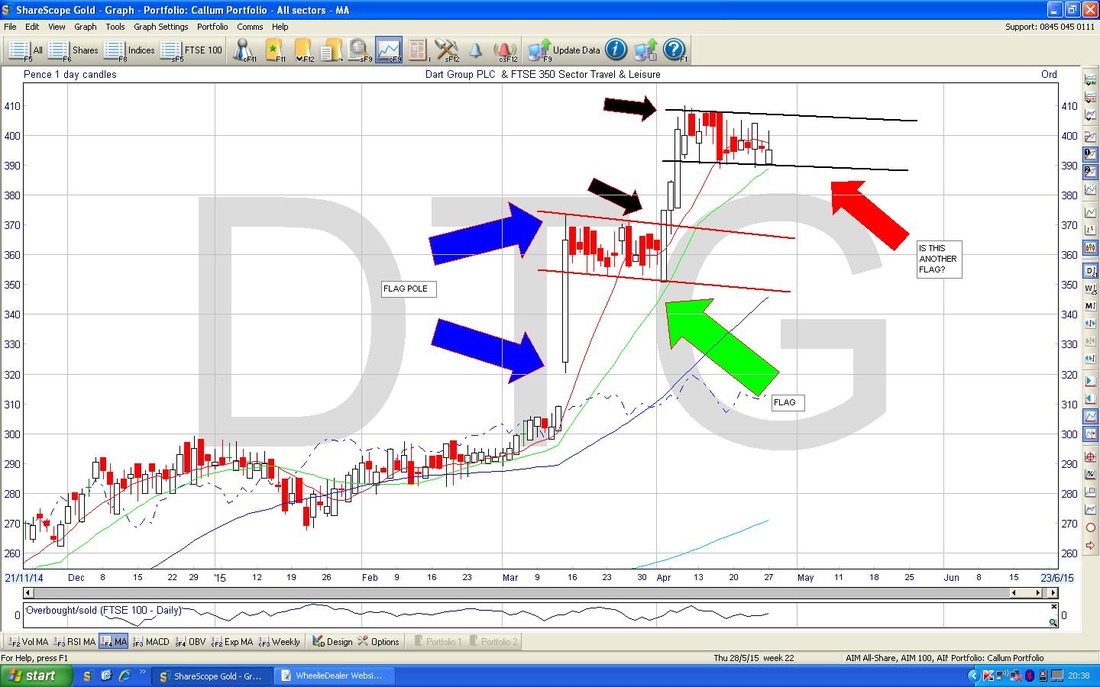
“OK, fair enough Wheelie, but what’s going down at EMR then mate?”
Right, well this is the one I flagged up last night as a possible Flag Pattern. It is early days as the Flag bit seems to be taking shape, but as each day passes, it looks more and more likely we are getting a Flag Pattern. Lovely. If you look at the Chart below, then it looks to me like the Blue Arrows are marking the Flagpole and the Black Parallel Lines I have drawn are possibly forming the Flag bit (the Green Arrow points this out). It is early days, and maybe we will not get a proper Pattern, but it looks more and more likely to me. If it works, then maybe we can see the Price move up by the Height of the Flagpole as per the Theory. This would be about 9p on the Price - so maybe we can see 75p quite soon if we get the Breakout to the Upside. I am sure most Readers are aware that I hold EMR and recently topped up on them because they looks very good value. There is a Blog on it from last week. 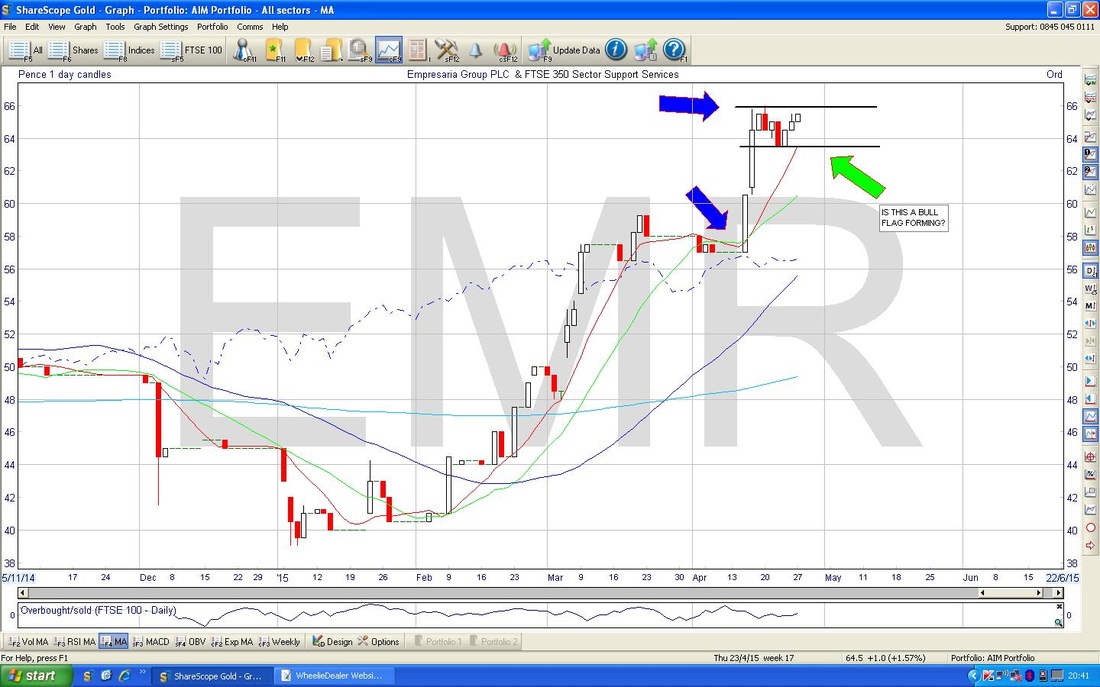
OK, that’s about it really. I hope this short Blog helps you get your head around what I bleat on about when I drone on about Bull Flags. With practice, you can probably start to see these Patterns forming up in the way that I have done with EMR - after a while your Brain sort of gets trained to looking for these things.
Bear in mind, that like all Charting Stuff Bulls Flags are probabilistic - they are very highly reliable but sometimes they do not work. The examples here have Flags that are sort of between 2 fairly Horizontal parallel lines - it is possible that you get more of what is known as a ‘Pennant’ Pattern, where the Flag sort of slopes downwards more. They work pretty much the same and purists might argue that the Bull Flag Pattern I highlighted in the DTG example with the Blue Arrows is really a ‘Pennant’ Pattern. As a supplementary point, you can also get ‘Bear Flags’ - these are the exact opposite - where a Price has moved down sharply, and then consolidates with a Sideways move before Plunging down again. We don’t like these so much !! I am flagging, time to go, wd
0 Comments
Leave a Reply. |
'Educational' WheelieBlogsWelcome to my Educational Blog Page - I have another 'Stocks & Markets' Blog Page which you can access via a Button on the top of the Homepage. Archives
January 2021
Categories
All
Please see the Full Range of Book Ideas in Wheelie's Bookshop.
|
