

|
educational blogs |
|
I am pushed for time so this will be short and sweet - I will outline why I decided to Topup my existing Vislink VLK Holding and what kind of Target I think is possible.
Very Quick Overview VLK is a specialist in Video Broadcast Technology, I am very aware of them because I am an avid Fan of motoGP Motorcycle Racing and the Cameras used on the Bikes while they are moving at speeds up to 220mph are provided by VLK. They also make self-contained Video and Audio Broadcast equipment that can be used by News Reporters etc. in remote locations where the Footage is beamed by Satellite to the News Station for instant transmission.
An Acquisition last year of Pebble Beach Systems brought more of a Software focus with regard to enabling Broadcasters to manage Content in a Real Time manner from multiple streams of input.
One of the most exciting New Products which is due quite soon is the result of a collaboration with GoPro. At the moment, the GoPro helmet mounted Cameras for Sportspeople etc. use recorded footage that needs to be downloaded after the event. The link up with VLK will enable GoPro to provide their Helmet Cameras with a Live Feed - this could dramatically improve the ‘Point of View’ camera angles that Sports Broadcasters can provide. You can see VLK’s Website here: http://www.vislink.com/ Greedy Management Incentive Plan The Share Price has come off a lot in recent weeks after the Company announced a new Management Incentive Plan which is clearly very greedy to the huge benefit of the Directors. This has caused a lot of consternation and understandably many Shareholders have sold out in disgust. For more details on this and to sign a Petition against this pretty outrageous Scheme, click on the Link below: http://www.freesharedata.com/vislink-poll However, I think this is an Opportunity for buyers because if the Incentive Plan remains unchanged, then it is hugely in the interest of the Directors to try every trick in the book to drive the Share Price up - and obviously that will benefit me as a Shareholder. If the Incentive Plan gets revised so it is less greedy, then I suspect the Share Price will rally hard as Buyers come back in. To my mind this is a very good time to be buying an innovative Tech Stock on a low valuation - as will become clear in a bit. Risks
Valuation As usual, I have put some ShareScope Screenshots in this Blog to show the information that was confronting me when I took my Decision to Buy more Stock on the Night of Thursday 16th July 2015. I had been stalking the Stock for a couple of weeks because I felt that there would be a bounce-back once the Selling Wave from the Incentive Plan annoyance had subsided. 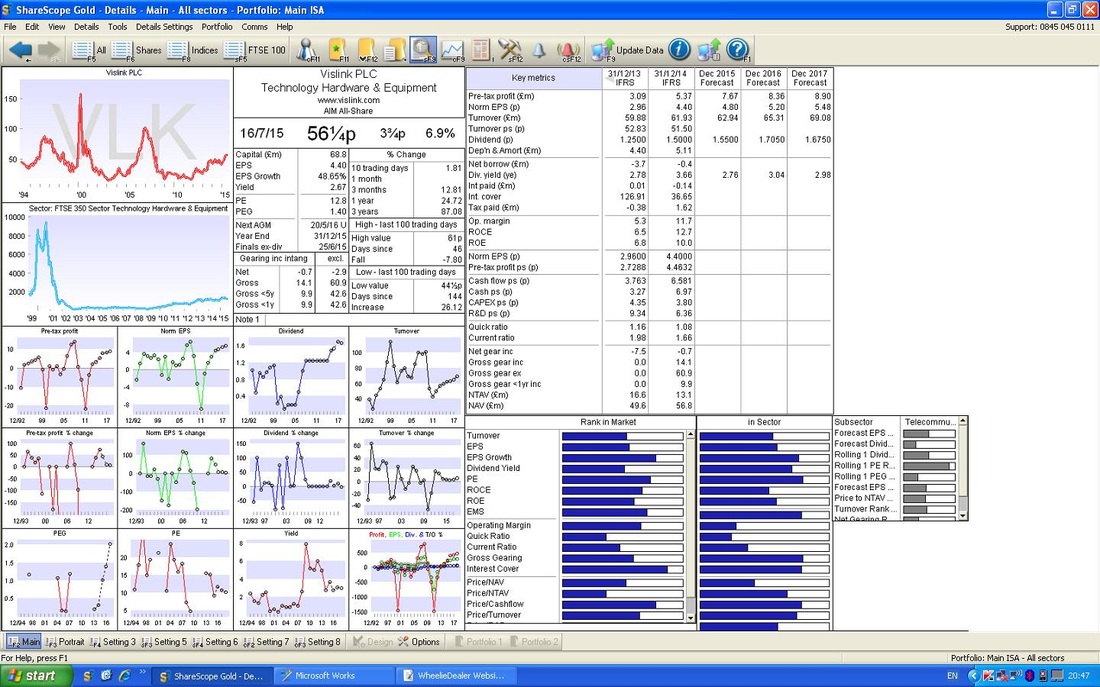
If you look at the Top Right of the ScreenShot above you should see ‘Norm EPS (p)’ for ‘Dec 2016 Forecast’ of 5.20. On my Buy Price of 57p, this gives a Forward P/E Ratio of 11.
If we go out to 2017 forecast earnings per share of 5.48p, we get a Forward P/E Ratio of 10.4. Note the company has a very small Net Cash position of £0.4m. At least there is no debt - so it has a Strong Balance Sheet in that respect - expect more Acquisitions. For ‘Dec 2016 Forecast’, the ‘Dividend (p)’ is due to be 1.7050. On my Buy Price of 57p, this gives a Dividend Yield for Next Year of 3.0%. So, it’s a pretty reasonable (if not stunningly cheap) P/E rating and a nice Divvy as well. These Forecast Numbers don’t strike me as particularly exacting - it must be possible that the Company can beat these - especially if they do some Bolt-on Acquisitions. Targets It’s a simple fact of the Stockmarket that Tech Stocks can demand some pretty high P/E Multiples. Without being over-generous, it suggests there could be considerable Upside for VLK in time. For instance, if we take Next Year’s EPS forecast of 5.20p and slam it on a P/E Multiple of 15, we get a Target of 78p. That is 36% Upside to my Buy Price of 57p. It doesn’t need too much of a stretch to give it a Multiple of 18 - especially if the Greedy Directors are hugely driven to max out on the Scheme !! On this basis, a Target of 93p would be in sight. And if we really wanna get excited, imagine the Company beating the numbers and doing perhaps 6p of EPS next year - on that basis, on a P/E of 18, we could see a Target of 108p. OK, some of these numbers are fanciful, but it gives an idea of how much Upside there could be. I am really targeting the 80p Level and I note there is Chart Resistance at 90p and particularly Strong Resistance at 110p - which was the Peak hit back in late 2006. If and when it gets to 80p, I will revisit the Investment Case and decide whether to Topslice or Sell out or whatever. Technicals The Chart below shows a Very Long Term picture - dragging back to 1997. The Blue Arrow marks a Red Line which was a Long Term Resistance Line - this was broken in late 2014 but it has only been during this Year that the Share Price has got a wiggle on and started to convincingly move up. The Black Arrow marks the Black Bottom Line of the Shorter Term Uptrend Channel and the Red Arrow marks the Top Line of the Channel. 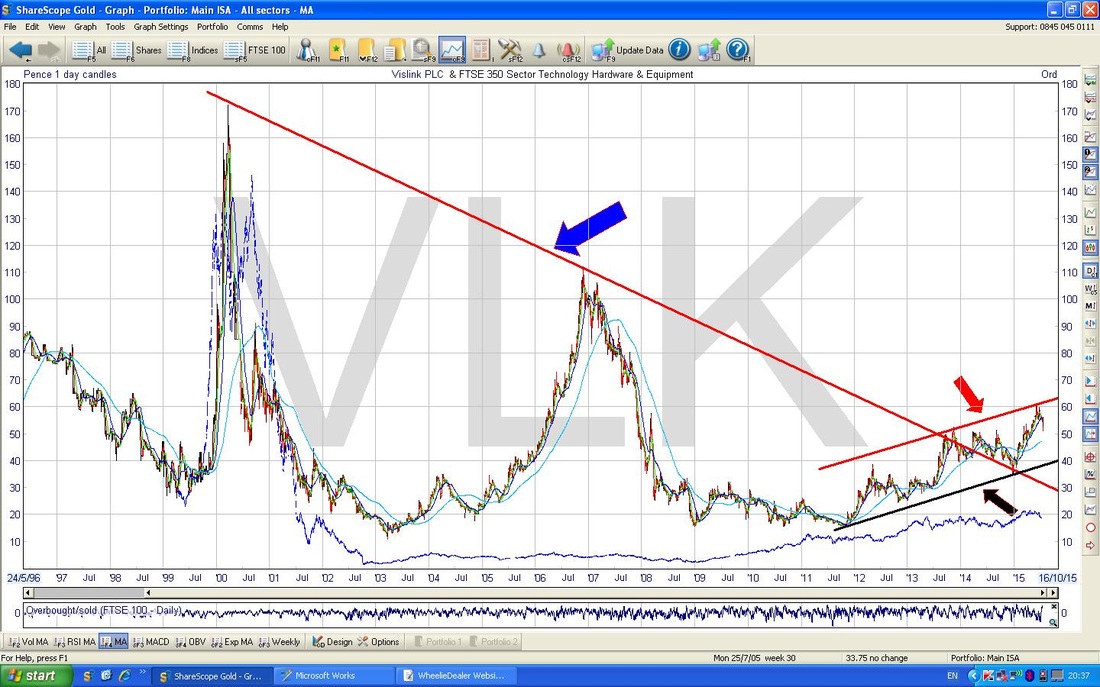
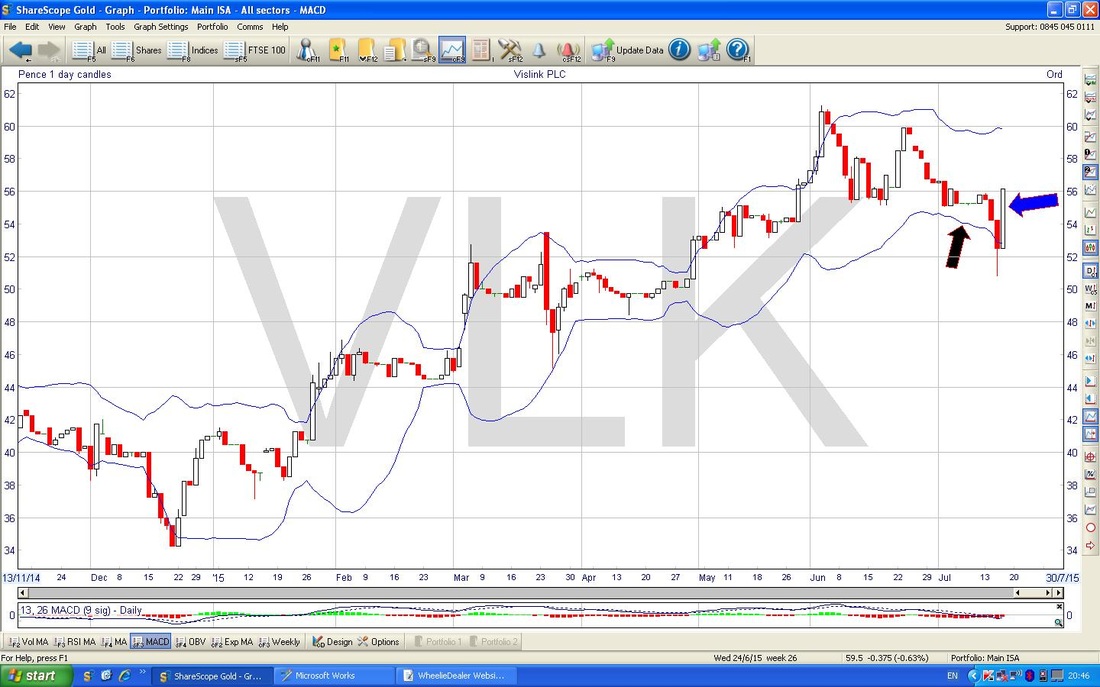
On the Chart below, I have zoomed in to really just the Share Price Action this year. Now I have marked an Uptrend Channel with Blue Lines top and bottom which runs upwards within the Shorter Term Channel that I marked in the previous Chart.
This time, the Share Price has fallen out of the Blue Lines Uptrend Channel but I suspect this is an ‘Overshoot’ that has been caused by the furore over the Incentive Plan. There were about 2 weeks of down moves after the Plan was announced and I suspect the Selling is now abating as shown by the Daily Candle I have marked with the Green Arrow. Note how this Candle went very low intraday (shown by the long ‘Tail’ down from the Body of the Candle) and then recovered - this shows the Bulls were coming in after the heavy Selling - a decent ‘Intraday Reversal.’ The Black Arrow marks the Candle from the following Day (the Thursday) when the Bulls were firmly back in charge and drove the Price up all day right from the Open to the Close - very Bullish behaviour and suggests completion of the Reversal Pattern after the wave of selling. 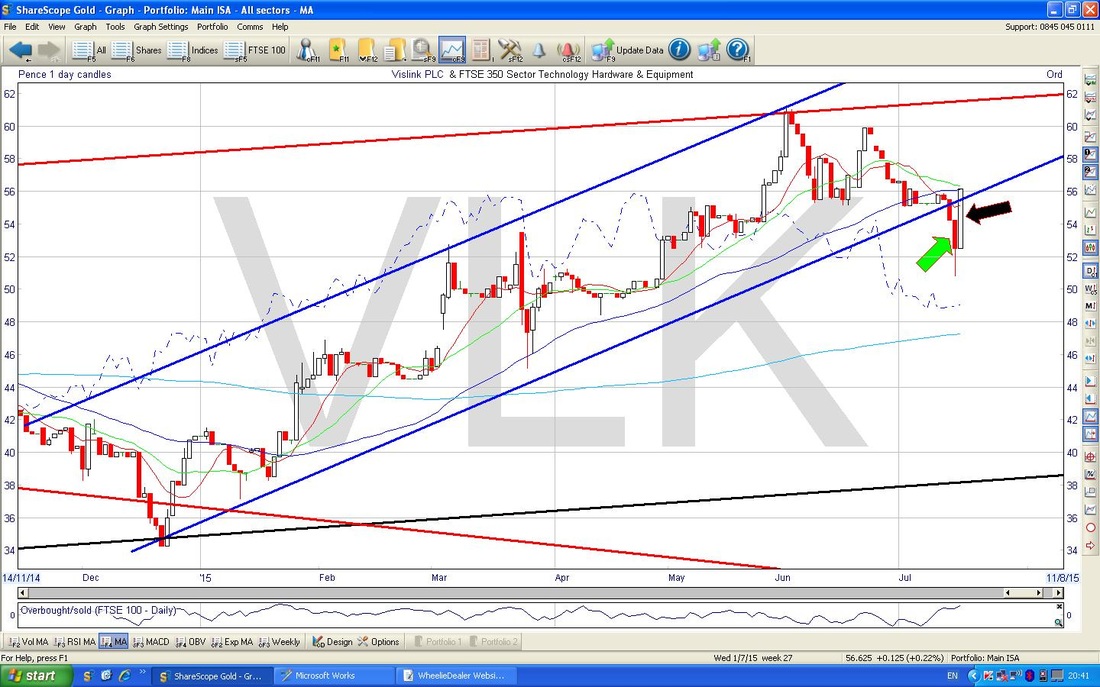
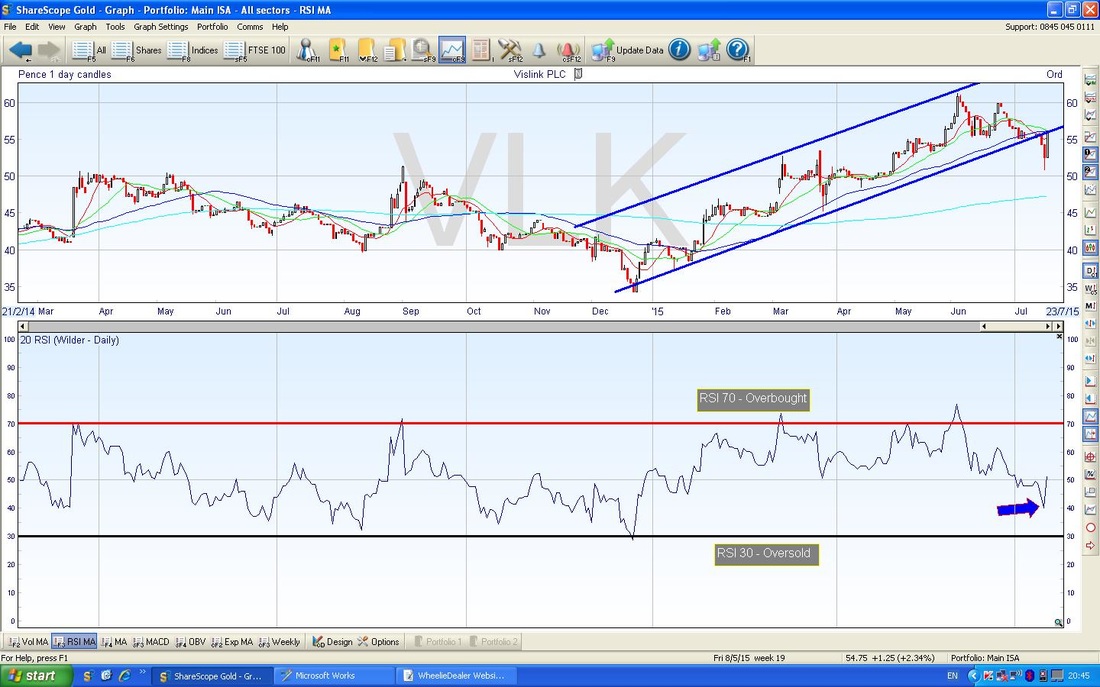
On the Chart below, please look at the Bottom Window. Here I have marked with a Blue Arrow how the Relative Strength Index (RSI) went down to a low of 40 before turning up. This suggests it was getting quite Oversold at 40.
The Chart below shows the Bollinger Bands which are the Blue Wiggly Lines around the Daily Candles. I have marked the Bottom Bollie Band with a Black Arrow and look how the Price has now moved up away from the Bottom Band - this is marked with the Blue Arrow.
The Chart below shows the Weekly Candles. Strictly speaking, we have not had a full week as I did this ScreenShot up until Thursday, however, it suggests that we will get a classy ‘Hammer’ Candle for the Week as I have marked with the Black Arrow. Such a development after a few Down Weeks should mean we see some Up Weeks !!
OK, that’s enough, wd 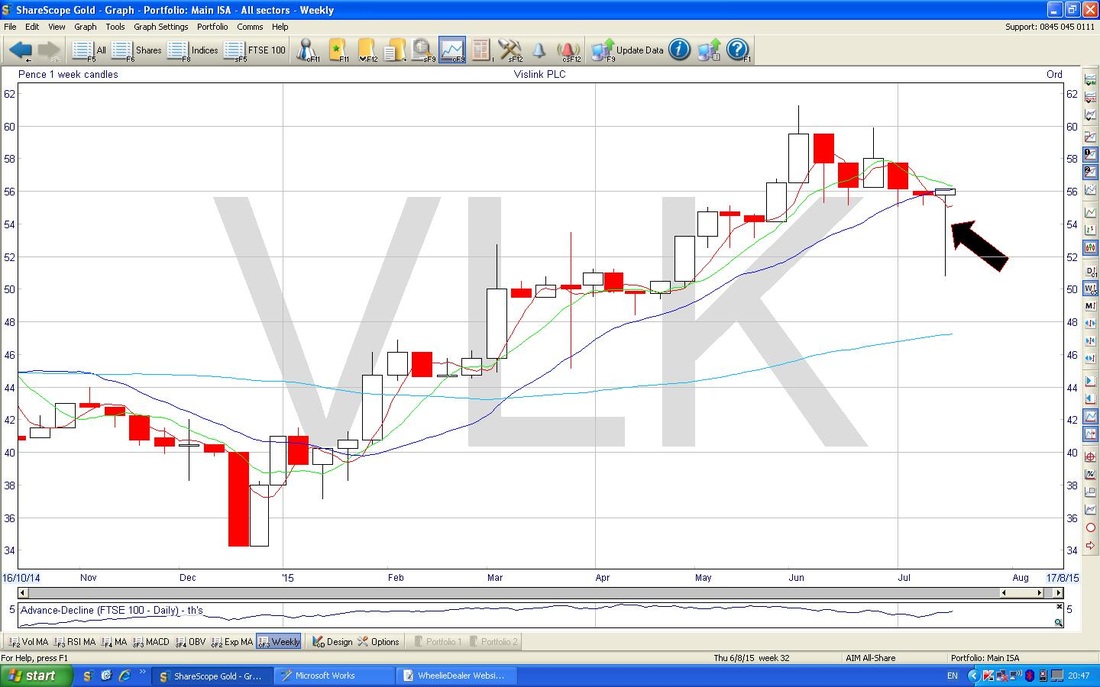
0 Comments
Leave a Reply. |
'Educational' WheelieBlogsWelcome to my Educational Blog Page - I have another 'Stocks & Markets' Blog Page which you can access via a Button on the top of the Homepage. Archives
January 2021
Categories
All
Please see the Full Range of Book Ideas in Wheelie's Bookshop.
|
